Switch Web Portal Documentation - Enfocus
←
→
Page content transcription
If your browser does not render page correctly, please read the page content below
Switch Web Portal Documentation
Switch

Contents
1. Copyrights............................................................................................................................................... 3

2. Using the Switch Web Portal.................................................................................................................. 4
    2.1. Signing in to the Switch Web Portal.....................................................................................................4
      2.2. Changing the language of the Switch Web Portal............................................................................... 5
      2.3. Viewing log messages through the Switch Web Portal....................................................................... 5
           2.3.1. The Messages overview.............................................................................................................. 6
           2.3.2. Filtering log messages............................................................................................................... 9
           2.3.3. Sorting log messages............................................................................................................... 10
           2.3.4. Exporting log messages............................................................................................................11
           2.3.5. Clearing log messages............................................................................................................. 11
      2.4. Finding Switch jobs through the Switch Web Portal.......................................................................... 12
           2.4.1. About job boards....................................................................................................................... 12
           2.4.2. Creating a job board................................................................................................................. 12
           2.4.3. Managing a job board............................................................................................................... 13
           2.4.4. Viewing and finding jobs on a job board.................................................................................. 14
      2.5. Managing dashboards on the Switch Web Portal.............................................................................. 15
           2.5.1. About dashboards and widgets................................................................................................ 15
           2.5.2. Creating a dashboard............................................................................................................... 18
           2.5.3. Managing a dashboard............................................................................................................. 19
           2.5.4. Viewing a dashboard................................................................................................................. 21
           2.5.5. Dashboard widgets overview.................................................................................................... 21
      2.6. Submitting and checking jobs through the Switch Web Portal..........................................................27
           2.6.1. Setup in Switch......................................................................................................................... 28
           2.6.2. The Switch Web Portal User Interface..................................................................................... 35
           2.6.3. Submitting jobs through the Switch Web Portal...................................................................... 39
           2.6.4. Viewing jobs through the Switch Web Portal........................................................................... 41
           2.6.5. Reviewing and processing jobs through the Switch Web Portal..............................................46

                                                                                                                                                       ii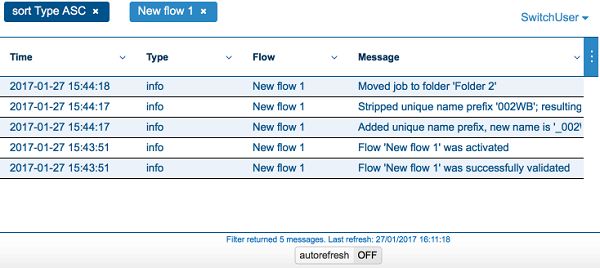
Switch

1. Copyrights
    © 2018 Enfocus BVBA all rights reserved. Enfocus is an Esko company.

    Certified PDF is a registered trademark of Enfocus BVBA.
    Enfocus PitStop Pro, Enfocus PitStop Workgroup Manager, Enfocus PitStop Server, Enfocus
    Connect YOU, Enfocus Connect ALL, Enfocus Connect SEND, Enfocus StatusCheck, Enfocus
    CertifiedPDF.net, Enfocus PDF Workflow Suite, Enfocus Switch, Enfocus SwitchClient, Enfocus
    SwitchScripter and Enfocus Browser are product names of Enfocus BVBA.
    Adobe, Acrobat, Distiller, InDesign, Illustrator, Photoshop, FrameMaker, PDFWriter,
    PageMaker, Adobe PDF Library™, the Adobe logo, the Acrobat logo and PostScript are
    trademarks of Adobe Systems Incorporated.
    Datalogics, the Datalogics logo, PDF2IMG™ and DLE™ are trademarks of Datalogics, Inc.
    Apple, Mac, Mac OS, Macintosh, iPad and ColorSync are trademarks of Apple Computer, Inc.
    registered in the U.S. and other countries.
    Windows, Windows 2000, Windows 7, Windows 8, Windows 8.1, Windows 10, Windows 2008
    Server, Windows 2008 Server R2, Windows Server 2012, Windows Server 2012 R2 and Windows
    Server 2016 are registered trademarks of Microsoft Corporation.
    PANTONE® Colors displayed here may not match PANTONE-identified standards. Consult
    current PANTONE Color Publications for accurate color. PANTONE® and other Pantone, Inc.
    trademarks are the property of Pantone, Inc. ©Pantone, Inc., 2006.
    OPI is a trademark of Aldus Corporation.
    Monotype is a trademark of Monotype Imaging Inc. registered in the U.S. Patent and Trademark
    Office and may be registered in certain jurisdictions. Monotype Baseline is a trademark of
    Monotype Imaging Inc.
    Quark, QuarkXPress, QuarkXTensions, XTensions and the XTensions logo among others, are
    trademarks of Quark, Inc. and all applicable affiliated companies, Reg. U.S. Pat. & Tm. Off. and
    in many other countries.
    This product and use of this product is under license from Markzware under U.S.Patent No.
    5,963,641.
    Other brand and product names may be trademarks or registered trademarks of their
    respective holders. All specifications, terms and descriptions of products and services are
    subject to change without notice or recourse.

                                                                                                  3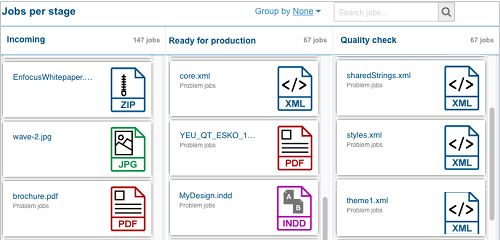
Switch

2. Using the Switch Web Portal
      The Switch Web Portal allows users to access the Switch Server through a web browser. This
      means that users can access the Switch Server from another computer than the one that is
      running the Switch Server, without the need for a Switch Designer.
      Currently, the following functionality is available:
      • Viewing log messages issued by the Switch Server. This includes customizing the messages
        overview (sorting, filtering, etc) and exporting and clearing messages as required.
      • Viewing and finding jobs processed by the Switch Server. This includes creating your own job
        board(s), which allows you to visualize the jobs present in certain flows and with certain flow
        stages. If you have purchased a Reporting Module license, you can use the data on these job
        boards to create dashboards with counters and graphs.
      • Submitting and checking jobs, on condition that you have licensed the SwitchClient Module.
      Note that users should be granted access via the Users pane.
      The connection can be encrypted as required (HTTPS); this can be configured through the user
      preferences. Refer to the Switch Reference Guide (Switch preferences: Web Services).

2.1. Signing in to the Switch Web Portal
      To sign in to the Switch Web Portal

      1. Open a browser.
          Google Chrome, Safari, Edge and Firefox are supported.

      2. Enter the IP address or the hostname of the computer running the Switch Server followed
         by ":" and the port number for the Switch Web Portal (as set in the Switch Preferences (Web
         Services category)). The default port number is 51089.
         For example:

          A login screen appears. The first time you'll see a banner stating that cookies on the site are
          used to enhance the user experience.

      3. In the banner, click Accept to allow Switch to save your preferences.
         If you accept cookies, your preferences are saved by the browser. As a consequence, you
         don't have to set your preferences next time you sign in; they are remembered. If you click
         Do not use cookies, you can continue to work, but you will have to set your preferences
         again next time you log in.

      4. Enter your user name and password and click Sign in.
          The Switch Server must be running, otherwise you will not be able to sign in.

                                                                                                    4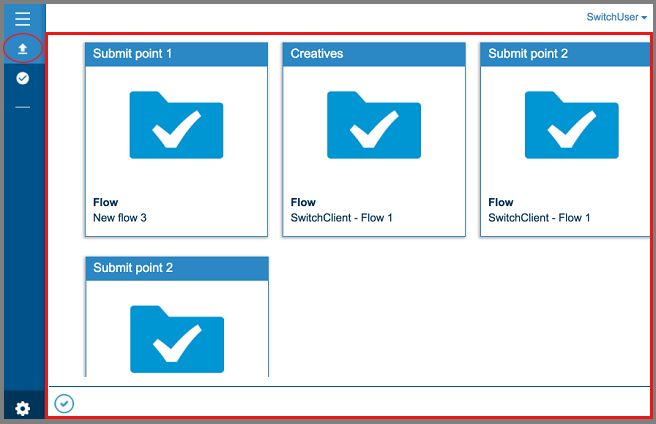
Switch

           The Switch Web Portal main screen appears. What you can see and do, depends on your
           permissions (as configured by the Switch administrator through the Users pane).

2.2. Changing the language of the Switch Web Portal
      By default the language on the Switch Web Portal is determined by your system's local settings.
      To select a different language (i.e. one of the Switch languages), proceed as follows:

      1. In the top right corner of the screen, click your user name.
           The name displayed is your user name as defined in the Users pane in the Switch Designer.

      2. Click the language of your choice.
           Possible languages:
           •   English
           •   German
           •   French
           •   Japanese
           •   Chinese
      Your choice is remembered. Next time you sign in to the Web Portal (through the same
      browser), the content will be displayed in the chosen language.

2.3. Viewing log messages through the Switch Web
Portal
      If you have the right permissions, you can view the log messages in a browser without having to
      open a Switch Designer. The permissions are set through the Users pane.
      To view the log messages

      1. Sign in to the Switch Web Portal.
           See Signing in to the Switch Web Portal on page 4.

      2.
           If the messages are not displayed, in the navigation area on the left, click       Messages.
           The most recent log messages are displayed, with a maximum of 1000 messages in total.
           If the autorefresh option is turned on (at the bottom of the screen), the list is automatically
           renewed. By default, the list is sorted chronologically, most recent messages at the top.
           Remark:
           • If the message text is too long to be displayed, you can turn on the Wrap text option.

           • If you don't want to see all columns, you can hide some of them using the Columns
             option.

           Both options are available in the menu that appears when you click the button       on the right,
           below your user name (see screenshot).

                                                                                                       5
Switch

       You can now sort the messages, filter out the messages you're not interested in, or export
       messages as required. Refer to Filtering log messages on page 9, Sorting log messages on
       page 10 and Exporting log messages on page 11.

2.3.1. The Messages overview
       This topic describes the Messages overview. You can open this overview in different ways:
       • Through the Switch Web Portal.
       • By clicking the Messages button in the toolbar of the Switch Designer. Alternatively, you can
         press F6 or select View > Messages.

       Buttons and menus
       The table below explains the meaning of the main buttons, labels, icons and menus in the
       Messages overview.

                                                                                                    6
Switch

Button/menu   Description
              Shows the name of the user that logged in.
              If you click the icon , you'll get a menu where you can change
              the language and sign out as required.
              See Changing the language of the Switch Web Portal on page
              5.

                      Note: If you open the Messages overview from within
                      Switch, this option is not available. In that case, the
                      Messages overview is displayed in the language of the
                      Switch Designer.

              Opens a menu with the following options:
              • Wrap text: Moves text that does not fit on one line (because
                the column is too small) to the next line (instead of cutting it
                off).

              • Columns: Allows you to show or hide columns as required
                (and afterwards reset them as required).

              • Export messages: Allows you to export the filtered log
                messages to a .csv file. You can either open the file or save it
                locally.

              • Clear messages: Allows you to remove all log messages
                from the log database. Note that there is no undo for this
                action!

              If you click a column header, the sort and filter options are
              displayed. For most columns, you can change the sort order
              (A-Z or Z-A) and/or set a filter (e.g. only display the messages
              of the last x hour(s)/day(s), only the ones that contain a certain
              string, ...). See also Filtering log messages on page 9.

              The applied filters are listed in the white space above the
              column headers. In this example, the dark blue label indicates
              that the messages are sorted by the values in the Type column,
              from A-Z (ascending). The light blue label indicates that only the
              messages triggered by "new flow 1" are shown.

autorefresh   Allows you to refresh the page automatically, to always have an
              up-to-date overview.
              When turned on (default), the button is blue; when turned off,
              the button is gray.

                                                                              7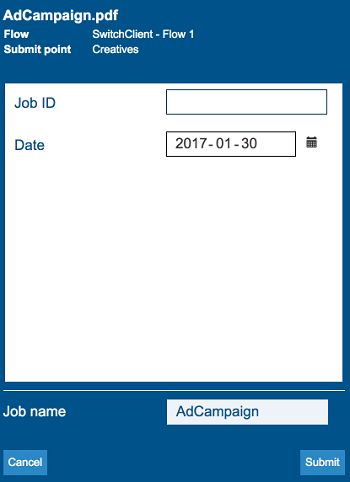
Switch

  Button/menu                  Description
                               You can enable this option only if the sort order of the "Time"
                               column is set to "Descending (Z-A)". If you change the sort
                               order, the autorefresh option is disabled automatically.

Columns
The following table describes the columns in the Messages overview.

Remember that you can hide columns as required via the icon in the top right corner . It's
also possible to resize the columns and to move them to another position (by dragging them
sideways).
The Reset view option sets the columns to their default position and size and makes them all
visible. This option is also accessible via the context menu of the Messages view.

  Column           Description

  Time             Date and time when the message was triggered.

  Type             Message type, indicating the severity level of the message (error, warning,
                   info, debug or assert). See also the table below (Message types).

  Module           The Switch module (such as Control) or type of flow element (such as
                   folder) that triggered the message.

  Flow             The name of the flow that triggered the message.

  Element          The name of the flow element that triggered the message.

  Prefix           The unique name prefix of the job referred to in the message, or blank if
                   there is no unique name prefix.

  Job              The name of the job for which this message was issued.

  Message          The message itself.

Message types
The following table describes the different types of messages that can appear in the Type
column of the Messages overview.

  Type             Description

  Info             An informational message that has no other purpose than to inform the
                   user of a certain occurrence.
                   Info messages are always shown in the Messages overview (unless a filter is
                   applied).
                   The Messages overview displays all types of info messages (related to
                   Switch Server and to Switch Designer).

                                                                                                 8
Switch

            Type            Description

            Warning         A warning message that informs the user of a recoverable problem or non-
                            fatal error.
                            Warnings are always shown (in orange) in the Messages overview (unless a
                            filter is applied).

            Error           An error message that informs the user of a fatal error.
                            Errors are always shown (in red) in the Messages overview (unless a filter is
                            applied).

            Debug           An informational message solely intended for debugging purposes (often
                            generated by configurators).
                            Debug messages are not shown by default. If the Log debug messages
                            preference is enabled, you can display them using a filter.
                            Refer to the documentation about Switch Preferences: Logging in the
                            Switch Reference Guide.

            Assert          A message solely intended for debugging purposes that is issued only when
                            a coding error is discovered.
                            Assert messages are not shown by default. If the Log debug messages
                            preference is enabled, you can display them using a filter.
                            Refer to the documentation about Switch Preferences: Logging in the
                            Switch Reference Guide.

                Note: Scripters have access to all messages, to be able to debug their scripts.

2.3.2. Filtering log messages
       To filter the log messages

       1. Click the header of the column you want to use to filter the messages.

       2.
            In the menu that appears, click the filter icon.

       3. Set your filter as required:
            There are some small differences depending on the chosen column.
            • In the Time column, select the filter of your choice from the list and configure it as
              required. For example, to only view the latest messages, select After and click the date
              and time of your choice. Other filter options are:
               • Messages issued in the last x number of hours or days
               • Messages issued before or after a particular date and time, or between two dates
                 (with a precision of 5 minutes)

                                                                                                            9
Switch
• In the Type column, select the checkbox of the messages type(s) you want to view in the
list, for example Error and Warning. See also The Messages overview on page 6.
• In the other columns, enter one or more strings to only view the entries that contain
those strings. The case of the entered strings is not taken into account.
Note:
• To view messages that contain several strings in one entry (e.g. configurator
AND workflow), type those strings in one filter field.
• To view messages that contain either string x or string y (e.g. configurator OR
workflow), type those strings in two different filter fields (see screenshot).
Extra filter fields are added by clicking and removed by clicking the cross
button.
4.
Click to confirm.
The filter is applied immediately. The strings used to filter the messages are displayed
above the columns in blue labels.
5. To clear a filter, click the cross icon in the blue label.
The label is removed and the messages overview is updated immediately.
Remark for Web Portal users only
You can save your message filters by clicking the + Save current filter button in the blue
navigation area.
2.3.3. Sorting log messages
To sort the log messages
1. Click the header of the column you want to use to sort the messages.
The Messages overview can be sorted by the values in all columns except for the Messages
column.
2. Choose the preferred sort order:
10Switch
To sort Click
Ascending, from old to new (Time column)
Descending, from new to old - this is the
default sort order (Time column)
Ascending, from A to Z (all other columns,
except for Messages)
Descending from Z to A (all other columns,
except for Messages)
The new sort order is applied immediately and indicated in the white space above the
messages (in a blue label), e.g. "sort Module DESC" means that the messages are sorted by
the items in the Module column, in descending order.
2.3.4. Exporting log messages
Log messages can be exported to a CSV file for processing by third-party tools. If you have set
filters, these filters are taken into account; only the messages that are shown will be exported
to a file.
Note: As of Switch 2017 it is no longer possible to export log messages to an XML file.
To export log messages
1. Open the Log messages overview.
2. Do one of the following:
•
Click the icon in the top right corner and click Export messages.
• Right-click in the overview and click Export messages.
A log.csv file is created.
2.3.5. Clearing log messages
Log messages are stored in a database on disk and thus remain available after quitting and
restarting Switch. The application data preferences determine for how long messages are
retained.
To permanently clear all log messages
1. Open the Log messages overview.
2. Do one of the following:
•
Click the icon in the top right corner of the overview and click Clear messages.
• Right-click in the overview and click Clear messages.
11Switch
A confirmation dialog appears. If you click Yes, all messages will be removed from the log
database. Note that there is no undo for this action!
2.4. Finding Switch jobs through the Switch Web
Portal
2.4.1. About job boards
Job boards (aka Job finder boards) were introduced in Switch 2018. These boards provide you
with a handy tool to follow up on the status of your jobs. No need to use a (Remote) Designer to
watch how your jobs move through the flows; instead you can open a browser on any computer,
log into the Switch Web Portal and create your own job board(s) with only those flows and jobs
that are of interest to you.
Here is an example of a job board that shows you which jobs are in which stage. The jobs can be
further grouped by flow or state, using the Group by field in the top right corner of the screen.
2.4.2. Creating a job board
A job board on the Switch Web Portal can display the jobs of your choice. You can select the
flows for which you want to display jobs and - if you want to - only show those jobs that have a
certain job status or that are in a certain job stage.
Note: The job boards are linked to your user account. As a consequence, you can only
see your own job boards and other users can't see yours.
To create a job board
1. With the Boards view selected, click + Manage.
The Manage boards dialog appears.
2. In the bottom right corner of the dialog, click New job board.
12Switch
3. Configure your board:
a. Enter a name for your board.
b. Click Select flows (the blue button to the right of the navigation area).
c. In the dialog that appears, select the flows you want to see on your job board. To do so,
click Select all (if applicable), drag the slider to the right or click the flow name of the
flows you want to select.
Flow groups are shown in gray, flow names in blue. You can select all flows in a group by
clicking the group name.
Note: Make sure to select all flows you want to see on your job board; in the next
step you can divide these flows over different columns.
d. Click Apply.
4. Configure the first column of your job board:
a. Enter a column name.
b. Select at least one flow.
c. Select the flow stages if applicable.
Problem jobs and No stage are by default available. If stages have been defined in the
selected flows, they will be added and can be shown as well.
If nothing is selected, all jobs are shown, regardless of their job stage.
5.
To add another column, click the plus button to the right of the configured column and
proceed in the same way. You can add as many columns as you need.
6. Click Save.
2.4.3. Managing a job board
This topic explains how to handle the custom job boards on the Switch Web Portal.
Proceed as follows:
1.
In the navigation area on the left, click Boards.
Make sure the navigation area is expanded (by clicking ).
2. Click + Manage.
The Manage boards dialog appears.
3. Do one of the following as required:
To... Do the following:
To create a new job Click New job board (blue button in the bottom right
board corner). See also Creating a job board on page 12.
To show or hide
a job board in the Click the slider in front of the job board you
navigation area want to show or hide. If the slider is blue, the job board
is visible in the sidebar.
13Switch
To... Do the following:
Alternatively, you can drag the slider to the right (to
show the board) or to the left (to hide it).
Note: This functionality is useful for job
boards you want to keep for later use or for job
boards that you want to use as data set for a
dashboard (for users of the Reporting module).
To edit a job board
Click the edit button.
Note: Alternatively, you can click the edit
button beside the job board name in the
navigation area.
You can now edit the board name and the columns:
• To change the number of flows on board level, you
should click the blue button ("x flows selected") next
to the board name.
• To add a new column, click the plus icon to the right
of the last configured column.
• To move the columns to another position, click the
icon and drag the columns you want to move
sideways.
Note: Instead of dragging the sliders to make
a selection, you can just click the group, flow
or stage name to make a selection or to undo a
selection.
To return to view mode, click the Save button (in the top
left corner, next to the name of the board).
To permanently Click the remove button.
remove a dashboard
4. To save the changes made in the Manage jobs dialog, click Apply.
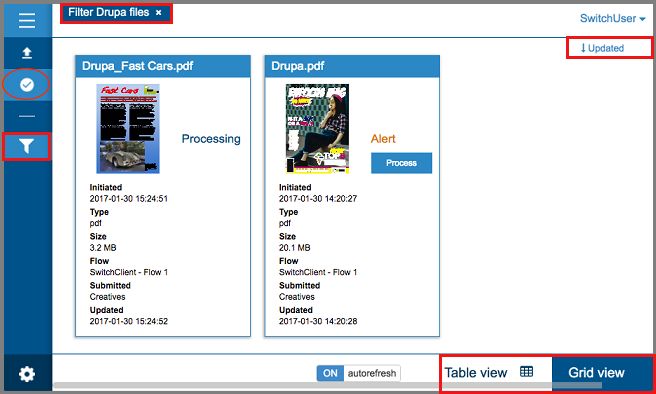
2.4.4. Viewing and finding jobs on a job board
If you have the right permissions, you can view Switch jobs through the Switch Web Portal. The
permissions are set by the Switch administrator through the Users pane.
To find jobs on a job board
1.
In the navigation area on the left, click Boards.
14Switch
Make sure the navigation area is expanded (by clicking ).
2. Select one of the boards in the navigation area, below the divider.
The jobs are listed in columns. What is shown depends on the configuration of the board.
3. To reorganize the overview, click the Group by list field in the top right corner of the screen,
and select the option of your choice (Flow, Stage, State or None (which removes any
previous grouping).
A group adds an extra level to a column.
For example, suppose one of the columns of your board lists all problem jobs of all flows.
With 'Group by' set to 'None', the jobs are put arbitrary one after the other. With 'Group by'
set to 'Flow', the Problem jobs column is divided into different sections per flow, so you can
easily see which problem job belongs to which job.
4. To search for a particular job for example to see if it reached a particular flow stage, enter
(part of) the job name in the search field in the top right corner of the screen.
The search is limited to the file name (name and extension).
2.5. Managing dashboards on the Switch Web Portal
2.5.1. About dashboards and widgets
As of Switch 2018 update 1, it is possible to create your own dashboards on the Switch Portal.
This requires a license for the Reporting Module.
Dashboards on the Switch Web Portal can give you a quick overview of the number of jobs that
are being processed by the Switch Server. You can for example display a counter (how many
jobs failed, how many jobs are in a particular stage,…) or a graph with numbers per file type,
flow,... It's also possible to visualize historical job data (e.g. number of problem jobs per week
over the past 3 months).
The graphs and counters are actually widgets that can be configured at wish. The input for
these widgets (i.e. the data that is visualized) comes from a job board. The widgets can be
customized to a certain level: you can for example add a frame around a widget in the color of
your choice, you can add a title, in case of a graph you have the choice between a bar, a donut or
a pie chart,...
Currently, six different widgets are available for use on the Switch Web Portal. They are listed
below.
Column Layout
This is actually a layout that helps you position the widgets on the screen. You need it to put
different widgets next to each other. If you want to put the widgets one after the other, in a
vertical arrangement, you don't need a layout.
Example of 2 live counters in a column layout (horizontal arrangement):
15Switch
Example of 2 live counters without column layout (vertical arrangement):
See also: Dashboard widgets - Column Layout on page 21
Custom HTML
This widget allows you to add a title, a logo, text and even a movie to your dashboard.
See also: Dashboard widgets - Custom HTML on page 22
16Switch
Live counter
This widget displays a number, representing the amount of jobs currently present on the
selected job board.
See also: Dashboard widgets - Live counter on page 23
Live graph
This widget counts both the total number of the jobs on the selected job board and the number
of jobs per column, and presents this data as a graph.
See also: Dashboard widgets - Live graph on page 24
Live table
This widget displays information about the jobs counted in a live graph on the same dashboard.
For example, if your graph gives an overview of the number of jobs per flow, the live table
displays detailed information about these jobs (job name, flow name, stage and state of the job).
17Switch
See also: Dashboard widgets - Live table on page 25
History graph
This widget visualizes the evolution of the number of jobs or the job size over a particular period
of time, for example the total number of problem jobs of the last month, grouped by week.
See also: Dashboard widgets - History graph on page 26
2.5.2. Creating a dashboard
A dashboard is an overview screen with one or more widgets that visualize job data.
Before you start, make sure to create a job board with the data you want to display on the
dashboard. This is necessary for all widgets, except for the history graphs and custom HTML.
18Switch
For example, if you want your dashboard to display the total number of problem jobs on the
server, you first need to create a job board that collects all problem jobs.
Note: The dashboards are linked to your user account. As a consequence, you can only
see your own dashboards and other users can't see yours.
To create a dashboard
1. With the Boards view selected, click + Manage.
The Manage boards dialog appears.
2. In the bottom right corner of the dialog, click New dashboard.
3. Configure your board:
a. Enter a name for your board.
b. Choose a layout:
• If you want to place the different widgets one below the other (vertical arrangement),
you don't need a layout. If there is one on your dashboard (default configuration when
creating a new board), click the remove button to remove it.
• If you want a horizontal arrangement with two or more columns next to each other,
you need a column layout. If there is one on your dashboard (default configuration
when creating a new board), click the edit button to configure it. Refer to
Dashboard widgets - Column Layout on page 21.
c. Drag and drop one or more widgets onto the column of your choice (in case of a column
layout) or directly onto the dashboard and configure them as required:
• Dashboard widgets - Custom HTML on page 22
• Dashboard widgets - Live counter on page 23
• Dashboard widgets - Live graph on page 24
• Dashboard widgets - Live table on page 25
• Dashboard widgets - History graph on page 26
d. To switch between configuration or edit mode and view mode:
• Click the edit button in the header of the widget to make changes.
• Click the view button in the header of the widget to view the result of your
changes.
4. Click Save.
The dashboard is added to the navigation area.
Note that you can still make changes by clicking the edit button beside the name of the
dashboard in the navigation area.
2.5.3. Managing a dashboard
This topic explains how to handle the custom dashboards on the Switch Web Portal.
19Switch
Remember that dashboards are only available if the Reporting Module is licensed.
Proceed as follows:
1.
In the navigation area on the left, click Boards.
Make sure the navigation area is expanded (by clicking ).
2. Click + Manage.
The Manage boards dialog appears.
3. Do one of the following as required:
To... Do the following:
To create a new Click New dashboard (blue button in the bottom right
dashboard corner). See also Creating a dashboard on page 18.
To show or hide a
dashboard in the Click the slider in front of the dashboard
navigation area you want to show or hide. If the slider is blue, the
dashboard is visible in the sidebar.
Alternatively, you can drag the slider to the right (to
show the board) or to the left (to hide it).
Note: This functionality is useful for
dashboards you want to keep for later use.
To edit a dashboard
Click the edit button.
Note: Alternatively, you can click the edit
button beside the dashboard name in the
navigation area.
You can now add or remove widgets and make changes
to the widgets as required:
• To add a widget, click it (in the right part of the
screen) and drag it onto the dashboard.
• To remove a widget, click the remove button in
the header of the widget.
• To make changes to a widget, click the edit button
in the header of the widget.
• To view your changes, click the view button in the
header of the widget.
Do not forget to save your changes, by clicking the Save
button (in the top left corner, next to the name of the
dashboard). By saving your changes, you automatically
switch to view mode.
20Switch
To... Do the following:
To permanently Click the remove button.
remove a dashboard
4. To save the changes made in the Manage jobs dialog, click Apply.
2.5.4. Viewing a dashboard
If you have the right permissions, you can create and view dashboards through the Switch Web
Portal. The permissions are set by the Switch administrator through the Users pane.
To view your (earlier created) dashboards on the Switch Web Portal
1.
In the navigation area on the left, click Boards.
Make sure the navigation area is expanded (by clicking ).
2. Click one of the boards in the navigation area, below the divider.
There are two types of boards listed below the divider: job boards and dashboards (only
available if the Reporting Module is licensed). The board type is mentioned in the Manage
boards dialog (which can be opened by clicking + Manage).
The dashboard is shown to the right of the navigation area. There may be several widgets
present on the dashboard. Some of the widgets show extra information when hovering or
clicking the legend. For more information, refer to the description of the widgets (Dashboard
widgets overview on page 21).
2.5.5. Dashboard widgets overview
This is an overview of the widgets available for use on a Dashboard on the Switch Web Portal.
2.5.5.1. Dashboard widgets - Column Layout
About the Column Layout
The column layout is actually a layout, so not a graph or a counter. It allows you to place several
widgets next to each other in columns, for a horizontal arrangement. If no column layout is
chosen, the widgets will be placed one after the other, in a vertical arrangement.
How to configure the Column Layout
By default, two columns are available, but you can add more columns by switching to edit mode
and clicking the button.
Note that you should first configure the column layout; afterwards (after having saved/having
clicked the button) you can drag the widgets onto the layout.
Properties
21Switch
Property Description
Spacing White space between two columns.
You can enter a value expressed in the unit of your choice: px, em or %
When using pixels or em, the size of the white space will be fixed; when
using a percentage, the white space will adjust when the screen is resized.
Note that this setting is optional and only needed when you want separate
the widgets.
Columns For each of the individual columns you can either define a column width or
with width a minimum and/or maximum width.
settings
The width can be fixed (expressed in px or %) or "fit the content" (meaning
that you let Switch decide which is the best size).
Show frame When selected, a thin frame is drawn around the widget and the following
additional properties are displayed:
Title Text that will be shown in the title bar of the widget. You can leave it empty
as required.
Frame color Color that will be used for the title bar and the frame around the widget.
Clicking the color patch will open a color picker dialog.
2.5.5.2. Dashboard widgets - Custom HTML
About the Custom HTML widget
This widget allows you to add text, tables, pictures, movies and links to your dashboard. You can
use the text color and font of your choice, insert bullets, ...
How to configure the Custom HTML widget
You can type text in the text field and modify it using the tools in the editor.
An overview of shortcuts is available behind the question mark button.
Properties
Property Description
Show frame When selected, a thin frame is drawn around the widget and the following
additional properties are displayed:
Title Text that will be shown in the title bar of the widget. You can leave it empty
as required.
22Switch
Property Description
Frame color Color that will be used for the title bar and the frame around the widget.
Clicking the color patch will open a color picker dialog.
2.5.5.3. Dashboard widgets - Live counter
About the Live counter widget
This widget displays a number, representing the amount of jobs currently present on the
selected job board. Note that all jobs in all columns are taken together, resulting in one number,
for example the number of problem jobs.
This number can be linked with a color, for example, if the number of jobs remains below a
certain threshold, the background of the widget turns green; otherwise it turns orange or red.
The counter is updated at regular intervals (see properties), giving a live view on the Switch
server.
How to configure the Live counter widget
You can configure the properties listed in the table below.
Properties
Property Description
Job board Data that will be used for the dashboard.
'None' is not a valid option.
Color Background color of the widget based on the value of the counter.
To change a value, click it and increase or decrease the value using the
small arrow buttons.
To change a color, click it to open the color picker and select the color of
your choice.
Note that there's also a small text field below the color patches. You can
click it and type the text of your choice. This text will be displayed below the
counter.
Refresh This value indicates how often the number of jobs is recalculated.
interval (in
seconds)
Show frame When selected, a thin frame is drawn around the widget and the following
additional properties are displayed:
Title Text that will be shown in the title bar of the widget. You can leave it empty
as required.
23Switch
Property Description
Frame color Color that will be used for the title bar and the frame around the widget.
Clicking the color patch will open a color picker dialog.
2.5.5.4. Dashboard widgets - Live graph
About the Live graph widget
This widget counts both the total number of the jobs on the selected job board and the number
of jobs per column, and presents this info in a graph.
Note that this requires a job board with more than one column; each column is represented as a
separate section in the graph. You can choose between a pie, a bar and a donut chart.
How to configure the Live graph widget
You can configure the properties listed in the table below.
Properties
Property Description
Chart Type of chart to be used. Options are:
• Pie
• Donut
• Bar
Tip: Use "Pie" and "Donut" to show how the parts (i.e. values per
column) compare to the whole (total number of jobs); use "Bar" to
show how the parts compare to each other or to show trends.
Job board Data that will be used for the dashboard. For this type of charts, you should
have a board with more than one column.
'None' is not a valid option.
Refresh This value indicates how often the values are recalculated.
interval (in
seconds)
Show frame When selected, a thin frame is drawn around the widget and the following
additional properties are displayed:
Title Text that will be shown in the title bar of the widget. You can leave it empty
as required.
Frame color Color that will be used for the title bar and the frame around the widget.
Clicking the color patch will open a color picker dialog.
How to use Live graphs
Smaller parts are not always easy to read, so when hovering over one particular part of
the chart, this part is highlighted and you get a small dialog with the column name and the
percentage value of the highlighted part.
24Switch
When clicking an item in the legend, the corresponding part of the chart is disabled (grayed out
in the legend) and taken out of the chart. Clicking once more will bring it back.
2.5.5.5. Dashboard widgets - Live table
About the Live table widget
This widget displays information about the jobs counted in a live graph on the same dashboard.
For example, if your graph gives an overview of the number of jobs per flow, the live table
displays detailed information about these jobs (job name, flow name, stage and state of the job).
How to configure the Live table widget
You can configure the properties listed in the table below.
Properties
Property Description
Parent Live graph that is used as dataset for the live table.
'None' is not a valid option.
Group by Determines how the data in the table is grouped (or divided into
subsections). Options are:
• None: all data in one list
• Set: data grouped by job board column
• Flow: data grouped by flow
• Stage: data grouped by flow stage (for more information, refer to
Working with flow stages
• State: data grouped by job state
Show frame When selected, a thin frame is drawn around the widget and the following
additional properties are displayed:
Title Text that will be shown in the title bar of the widget. You can leave it empty
as required.
Frame color Color that will be used for the title bar and the frame around the widget.
Clicking the color patch will open a color picker dialog.
How to use live tables
To see the details of a particular part/category in the chart, e.g. one slice of the pie, just click
in the chart. Only the details of the corresponding jobs will be shown in the table. Clicking once
more will reset the table.
To search for a particular job/a set of jobs, you can filter the table by entering a key word in the
filter fields below the column headers. Note that these filter fields are not case sensitive.
25Switch
To sort the list in ascending or descending order, click the column header of the column by
which you want to order it. Note that the small arrow in the column header will become a bit
darker, to indicate this.
2.5.5.6. Dashboard widgets - History graph
About the History graph widget
A history graph visualizes the evolution of the number of jobs or the job size over a particular
period of time, for example the total number of problem jobs of the last month, grouped by
week. A further subdivision is possible, you can for example further group the jobs by file type,
flow, stage or state.
Note that this graph only counts jobs that are completely finished, meaning that they have left
the Switch flows. Data is available for the time period set in the user preferences, for example
for 120 days. Refer to the Switch Reference Guide (Switch Preferences: Dashboard)
How to configure the History graph widget
You can configure the properties listed in the table below.
Properties
Property Description
Chart Type of chart to be used. Options are:
• Line
• Spline (curved line)
• Bar
Job board For the time being, only job boards with one column are supported.
(single
'None' is a valid option for history graphs: if selected, all jobs on the Switch
column only)
server are taken into account!
Unit Determines what is counted and displayed:
• Number of jobs
• Total size
Group by Determines how the values are grouped:
• None: no grouping; the total number of jobs or the total size is
mentioned. For example, 200 jobs on day1, 190 jobs on day 2, etc.
• Type: the total number or the total size is further divided by file type. For
example, 100 PDF files and 100 text files on day1, 90 PDF files and 100
text files on day2, ...
• Stage: the total number or the total size is further divided by flow stage.
For example, 75 jobs in stage1 and 125 in stage2 on day1, 70 in stage1
and 120 in stage2 on day2, ...
• State: the total number or the total size is further divided by job state.
For example, 33 jobs in state1 and 167 in state2 on day1, 22 in state1 and
168 in state2 on day2, ...
26Switch
Property Description
• Flow: the total number or the total size is further divided by flow. For
example, 50 jobs in flow1, 50 in flow2 and 100 in flow3 on day1, 99 in
flow, 1 in flow2 and 90 in flow3 on day2, ...
Period Determines how the data will be grouped, i.e. which data will be taken
together.
• Day
• Week
• Month
For example, if grouped by week, you'll get one value for all jobs of a
particular week (optionally further divided by flow, file type, etc.)
Days Refers to the time period that will be shown in the graph.
previously
For example, if set to '200', the data of the last 200 days (= today minus
200 days) will be shown. Note that the maximum number of days that is
possible is determined by the Dashboard preference (see higher).
Show frame When selected, a thin frame is drawn around the widget and the following
additional properties are displayed:
Title Text that will be shown in the title bar of the widget. You can leave it empty
as required.
Frame color Color that will be used for the title bar and the frame around the widget.
Clicking the color patch will open a color picker dialog.
How to use history graphs
Smaller parts are not always easy to read, so when hovering over one particular part of the
chart, this part is highlighted and you get a small dialog with more information (for example the
number of jobs/the total size per group; if there is no grouping, the dialog mentions the "overall"
value).
When clicking an item in the legend, the corresponding part of the chart is disabled (grayed out
in the legend) and taken out of the chart. Clicking once more will bring it back.
2.6. Submitting and checking jobs through the Switch
Web Portal
Submitting and checking jobs through the Switch Web Portal is only possible if you have
licensed the SwitchClient Module (2017 or higher) and you're using the new, web-based
version of the client. In that case, the job client type option (in the Internal Communications
preferences) must be set to Default.
Overview
An active SwitchClient Module gives access to the following functionality:
• Connect to one or more Switch Servers on the local network/internet.
27Switch
• Submit jobs (files or job folders) and metadata describing these jobs to a Submit point in a
flow.
• Review and act on jobs being held in a Checkpoint in a flow.
• View progress information and the status of submitted jobs.
• View log messages issued by processes on the server.
Good to know
• Access to particular Submit points and Checkpoints can be restricted, by configuring access
rights at user or user group level.
• Metadata information attached to a job can be used to make automated routing decisions or
to provide variable input to various tools and configurators.
• If you want to connect to more than one Switch Server at a time, you must open a browser
window per server and sign in to the Switch Web Portal for each server separately. The IP
address of the server is displayed in the URL.
2.6.1. Setup in Switch
Allowing users to submit and check jobs via the Switch Web Portal, requires some preparation
in Switch, usually done by a system administrator.
This includes:
• Installing and activating Switch (this includes activating the SwitchClient Module)
• Designing and activating one or more flows that will process the jobs submitted and
monitored through the Switch Web Portal.
• Configuring user access rights (in the Users pane)
• Configuring or checking the communication settings (through the Switch user Preferences)
2.6.1.1. Installing and activating Switch and the SwitchClient
Module
Licenses
A regular SwitchClient Module includes a license for up to five concurrent connections. If this
is not sufficient, you can purchase additional licenses. The number of licenses can be raised by
entering a new activation key in the Manage licenses dialog in Switch.
An active SwitchClient Module allows you access to the following flow elements:
• Submit point
• Checkpoint
• Checkpoint via mail
If SwitchClient is not licensed, the above flow elements will not be available and you will not be
able to submit and check jobs through the Switch Web Portal.
How to proceed
Follow the guidelines and instructions described in the Switch Reference Guide ("Installing,
activating and starting Switch"):
1. Install Switch.
2. Activate Switch, including the SwitchClient Module.
28Switch
3. Activate additional licenses if required.
2.6.1.2. Designing flows for use with the Switch Web Portal
Managing files through the Switch Web Portal requires a particular flow design in Switch.
About flows in Switch
To design a flow, the Switch user drags flow elements (such as Submit points, processors and
folders) on the canvas and connects them according to the desired job flow. After configuring
appropriate property values for each flow element (and in some cases, the connections), the
Switch user can activate the flow for execution. From then on, Switch automatically moves and
processes jobs along the flow.
If you're new to Switch, we recommend having a look at the Switch Quick Start Guide (available
on the Enfocus website).
Dedicated flow elements
Submit points and Checkpoints are flow elements designed for use with the Switch Web
Portal. For more information, refer to the Switch Reference Guide (Flow elements: overview >
Communication).
Note:
• Make sure the flows you want to use with the Switch Web Portal are active. A user
with the appropriate access rights can access Submit points, Checkpoints and jobs in
inactive flows but the jobs will not move along the flow.
• The Switch Web Portal only interacts with the Switch Server, not with the Switch
Designer. Users can safely quit the Designer without disturbing the operations via
the Portal as long as the Switch Server is running. For more info on the behavior of
Switch when exiting the flow designer, refer to the Switch user preferences (User
interface).
Example flow
Here's a flow example as it is shown on the Switch canvas:
29Switch
Since this example focuses on Web Portal features, there is a lot of interaction with human
operators and little automated processing (other than moving jobs around). Real-life flows
would probably include processing steps such as preflight or color conversion.
The Submit point on the left (Creatives) allows submitting jobs to the flow in a controlled way
using the Switch Web Portal. The user's name is automatically remembered; multiple users
can use the same Submit point since each user is identified to Switch through his/her user
name and password. The "Set User Name" script serves to add a user name for jobs submitted
through a regular hot folder (Henry).
The first Checkpoint (Visual Proof) holds the incoming jobs for inspection by a user through the
Switch Web Portal. The user will see the names of the output connections (Approve and Decline)
as buttons in the job card. Pressing one of these buttons moves a job along the corresponding
connection.
The second Checkpoint (Output Jobs) allows a Switch Web Portal user to decide how the jobs
will be stored or processed. This Checkpoint is configured to allow multiple outputs at the same
time; for example both "Store in DAM" and "Create Proof".
Setting up a Submit point
When setting up a Submit point (Creatives in the example flow), you can configure it in such a
way that the user must enter one or more data fields before submitting a job to this Submit
point. The entered values are associated with the job as metadata.
To enable this option, in the properties of the Submit point element:
1. Set Enter metadata to Yes.
2. Double-click the Metadata fields property and define the metadata fields for which the user
should provide a value, for example a Job ID and the date of submission.
3. The Dataset name field is completed automatically. This is the name of the dataset that will
be created containing the contents of the metadata fields entered by the user.
For a full description, refer to "Defining metadata fields" in the Switch Reference Guide.
The following screenshot shows how a user will have to enter the data (Job ID and Date)
configured in the Submit point.
30Switch
Setting up a Checkpoint
Similarly, when setting up a Checkpoint (Visual Proof and Output Jobs in the example flow), you
can ask Switch to display additional information about the job, and the user may be asked to
enter additional data fields before acknowledging a job. (This is the case if the Enter and display
metadata property is set).
Furthermore, the output connections of the Checkpoint determine which buttons will be shown
to the user for acknowledging a job.
For example, the Visual Proof Checkpoint in the example flow is configured in such a way that
the user will see two radio buttons ('Decline' and 'Approve', named after the connections);
clicking one of the buttons causes the job to move along the corresponding connection. This is
the default behavior of a Checkpoint if two output connections are defined and no metadata has
been enabled.
31Switch
On the other hand, the Output Jobs Checkpoint in the example flow is configured in such a way
that the user can select more than one option, causing a duplicate of the job to be sent out over
each of those connections. This is possible if the Allow multiple outputs property is enabled.
In this example, the user that has to review the files will see 3 checkboxes (the names come
from the output connections in Switch) and can select one, two, or three checkboxes as
required.
For an overview of all properties, refer to the description of the Checkpoint flow element in the
Switch Reference Guide.
Metadata in Submit points and Checkpoints - default values
When defining the default values for the metadata fields, you can use a number of variables that
automatically retrieve information from the machine that is used to submit or check jobs. As a
consequence, this information does not need to be entered explicitly by the user; it can even be
sent along with the job without being displayed.
The variables concerned are the so-called Connection variables:
• [Connection.Email]
• [Connection.FullUserName]
• [Connection.IP]
• [Connection.UserName]
If you use those as default values for your metadata fields, they will be replaced automatically
with their actual values.
To make this happen, "bidirectional communication" is established between Switch and the
Switch Web Portal:
1. The Switch Web Portal requests the default value of the metadata fields, being a connection
variable.
2. Switch Server sends the connection variable e.g. [Connection.IP] to the Portal.
3. The Portal replaces the variable with its actual value and sends the actual value along with
the job back to Switch Server.
Use case: To keep track of the clients used to submits jobs, you could configure a metadata
field "IP address" and set the default to [Connection.IP]. When a file is submitted, the IP address
of the system used to submit this file is entered automatically and sent along with the job. It
depends on the metadata field properties whether or not this field (with the actual value) is
shown to the user and whether or not it can be changed.
Re-using metadata fields from a Submit point in a Checkpoint
Switch provides an easy way to re-use the metadata fields defined for Submit points in a
particular Checkpoint.
To re-use an existing metadata field, simply click the button (instead of the green plus
button) in the Define metadata fields dialog. This will open a dialog like the one shown below.
32Switch
You can now select the metadata fields you want to re-use (based on the Submit points defined
for the current flow). Note that the added metadata fields have only two editable options: Read
only (yes/no) and Display metadata field (yes/no). The other options are grayed out and cannot
be changed.
Remark: Although all Submit points present in the flow are shown, you must keep in mind that
only the Submit point that is used for the job will send metadata. Refer to the example below:
since all jobs in Checkpoint 1 come from Submit point 1, it does not make sense to add metadata
from Submit point 2 to Checkpoint 1 (and vice versa).
If configured incorrectly, the connection variables (if used) will not be replaced with the actual
values (users will see e.g. [Connection.UserName]) and metadata fields for which there is no
value entered will be blank.
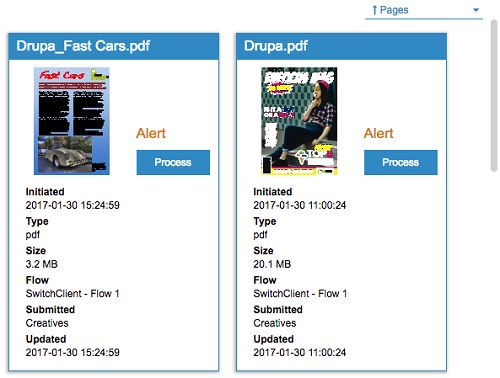
If configured correctly, when checking the Alert job on the Portal, the connection variables (if
used) will be replaced with the actual values (e.g. EAW13DL399 instead of the [Connection.IP])
and the metadata fields that were completed at the time of submission will show the entered
data.
33Switch
2.6.1.3. Configuring user access
How to proceed
Follow the guidelines and instructions described in the Switch Reference Guide ('Configuring
users'):
1. Set up the appropriate users and configure their user name, password, email address,...
2. Give them access to the appropriate Submit points and Checkpoints.
2.6.1.4. Configuring the communication settings
To configure the communication settings for communication with the Switch Web Portal
1. Navigate to:
• On Windows: Edit > Preferences.
• On Mac OS: Enfocus Switch > Preferences.
The User preferences dialog appears.
2. In the left part of the dialog, click Internal communication.
3. Make sure that Job client type is set to Default.
This indicates that you're using the new web-based client instead of the old SwitchClient
desktop application.
4. In the left part of the dialog, click the Web services category.
5. Make sure the Port for the Switch Web Portal preference is set to 51089, unless there is a
good reason to change it.
34Switch
6. Click OK.
2.6.2. The Switch Web Portal User Interface
2.6.2.1. The navigation area
When opening the Switch Web Portal, you can access the functionality to submit and check
jobs through the navigation area in the left part of the screen. This area can be collapsed or
expanded; when collapsed (see screenshot), the icons remain visible allowing you to switch to
the appropriate view. The view that is active is highlighted; in this example, that is the Submit
jobs view.
The table below explains the meaning of the buttons in the navigation area.
Button Click this button to...
Expand or collapse the menu.
Display the Submit jobs view.
Display the Check jobs view.
Find more info. A new dialog is opened with links to:
• The Switch documentation on the website
• The Enfocus Support Portal (to report a problem)
• The Support page on the Enfocus website
• The Switch system requirements.
35You can also read