HALF-YEAR 2020 RESULT PRESENTATION - 18 November 2019 - AWS
←
→
Page content transcription
If your browser does not render page correctly, please read the page content below

HALF-YEAR 2020
RESULT PRESENTATION

18 November 2019
Disclaimer
Kiwi Property Group Limited has prepared this document. By accepting this document and to the maximum extent permitted by law, you acknowledge and agree to the following matters.
No liability
Kiwi Property Group Limited, its advisers, affiliates, related bodies corporate, directors, officers, partners, employees and agents (together ‘Kiwi Property’) expressly exclude and disclaim any and all
liability which may arise from this document, any information provided in connection with this document, any errors in or omissions from this document, from relying on or using this document or
otherwise in connection with this document.
No representation
Kiwi Property makes no representation or warranty, express or implied, as to the accuracy, completeness, reliability or sufficiency of the information in this document or the reasonableness of the
assumptions in this document. All images (including any dimensions) are for illustrative purposes only and are subject to change at any time and from time to time without notice.
Not advice
This document does not constitute advice of any kind whatsoever (including but without limitation investment, financial, tax, accounting or legal advice) and must not be relied upon as such. This
document is intended to provide general information only and does not take into account your objectives, situation or needs. You should assess whether the information in this document is
appropriate for you and consider talking to a professional adviser or consultant.
Not an offer
This document is for information purposes only and is not an invitation or offer of financial products for subscription, purchase or sale in any jurisdiction. This document is not a prospectus or product
disclosure statement or other offering document under New Zealand law or any other law. This document does not constitute an offer to sell, or a solicitation of an offer to buy, any securities in the
United States and will not be lodged with the U.S Securities Exchange Commission.
Past performance
Past performance information given in this document is given for illustrative purposes only and should not be relied upon as (and is not) an indication or guarantee of future performance.
Future performance
This document contains certain "forward-looking statements" such as indications of, and guidance on, future earnings and financial position and performance. Forward-looking statements can
generally be identified by the use of forward-looking words such as, 'expect', 'anticipate', 'likely', 'intend', 'could', 'may', 'predict', 'plan', 'propose', 'will', 'believe', 'forecast', 'estimate', 'target',
'outlook', 'guidance' and other similar expressions. The forward-looking statements contained in this document are not guarantees or predictions of future performance and involve known and
unknown risks and uncertainties and other factors, many of which are beyond the control of Kiwi Property, and may involve significant elements of subjective judgement and assumptions as to
future events which may or may not be correct. There is no assurance or guarantee that actual outcomes will not materially differ from these forward-looking statements. A number of important
factors could cause actual results or performance to differ materially from the forward-looking statements. Investors should consider the forward-looking statements contained in this document in
light of this information. The forward-looking statements are based on information available to Kiwi Property as at the date of this document.
Investment risk
An investment in the financial products of Kiwi Property Group Limited is subject to investment and other known and unknown risks, some of which are beyond the control of Kiwi Property Group
Limited. Kiwi Property Group Limited does not guarantee its performance or the performance of any of its financial products unless and to the extent explicitly stated in a prospectus or product
disclosure statement or other offering document.
No duty to update
Statements made in this document are made only as the date of this document unless another date is specified. Except as required by law or regulation (including the NZX Listing Rules), Kiwi
Property undertakes no obligation to provide any additional or updated information or revise or reaffirm the information in this document whether as a result of new information, future events,
results or otherwise. Kiwi Property Group Limited reserves the right to change any or all of the information in this document at any time and from time to time without notice.
Caution regarding sales information
Any sales information included in this document has been obtained from third parties or, where such information has not been provided by third parties, estimated by Kiwi Property based on
information available to it. The sales information has not been independently verified. The sales information included in this document will not be complete where third parties have not provided
complete sales information and Kiwi Property has not estimated sales information. You are cautioned that this document should not be relied upon as a representation, warranty or undertaking in
relation to the currency, accuracy, reliability or completeness of the sales information contained in this document.
Copyright
The copyright of this document and the information contained in it is vested in Kiwi Property Group Limited. This document should not be copied, reproduced or redistributed without the prior
written consent of Kiwi Property Group Limited.
Real Estate Agents Act 2008
Kiwi Property Group Limited is licensed under the Real Estate Agents Act 2008.

Kiwi Property > Type Presentation Name > Date                                                                                                          Kiwi Property half-year 2020 result presentation               2

Contents

Half-year result….....…….……………...……………………                                                   4

Our strategic focus..….………………………………………                                                      10

Our mixed-use opportunities…………………….…………..                                                  11

Optimising our performance ..………………………………                                                   14

Priorities, outlook and dividend guidance ..........................                        15

Appendix one: Property update ……..................................                          17

Appendix two: Development update ……….......................                                 34

Appendix three: Market update …………………................                                       41

Appendix four: Financial update …………………...............                                      46

Appendix five: Other information ………………..................                                   60

This half-year result presentation, for the six months ended 30 September 2019, should be read in conjunction with the NZX announcement and Financial Statements
also released on 18 November 2019. Refer to our website kp.co.nz/half-year-result or nzx.com. Property statistics within this presentation represent owned assets
only; property interests managed on behalf of third parties are excluded. Unless otherwise indicated, all of the numerical data provided in this presentation is stated
for the six months ended and/or as at 30 September 2019. All amounts are in New Zealand dollars. Due to rounding, numbers within this presentation may not add up
precisely to the totals provided and percentages may not precisely reflect the absolute figures. Refer to Appendix 5.01 of this presentation for a glossary of terms. The
non-GAAP financial information does not have a standardised meaning prescribed by GAAP and therefore may not be comparable to similar financial information
presented by other entities. The GAAP financial information has been subject to review.
Kiwi Property > Type Presentation Name > Date                                                                           Kiwi Property half-year 2020 result presentation   3

Sound half-year result

                          $89.6m                                                                      •   Like-for-like (excluding Sylvia Park
                                                                                                          galleria, ANZ Raranga, and the sale
                                                                                                          of North City) net rental income
                        Net rental income                                                                 was +$1.8m or +2.1%
                             -$0.3m -0.3%1
                                                                                                      •   Net profit after tax impacted by fair
                                                                                                          value loss on interest rate swaps of
                           $51.9m                                                                         $12.9m, following recent interest
                                                                                                          rate cuts
                                        FFO
                              -$0.4m -0.8%

     $59.6m                                       $36.8m
      Operating profit                                 Net profit
        before tax                                      after tax
       -$0.5m -0.8%                                  -$11.5m -23.8%                                                          1.04 Net rental income
                                                                                                                             4.01 Profit after tax
                                                                                                                             4.04 FFO
    Note 1 Comparative figures in slides 1-9 relate to the 1H 2019 period, unless otherwise stated.
Kiwi Property > Type Presentation Name > Date                                                                        Kiwi Property half-year 2020 result presentation   4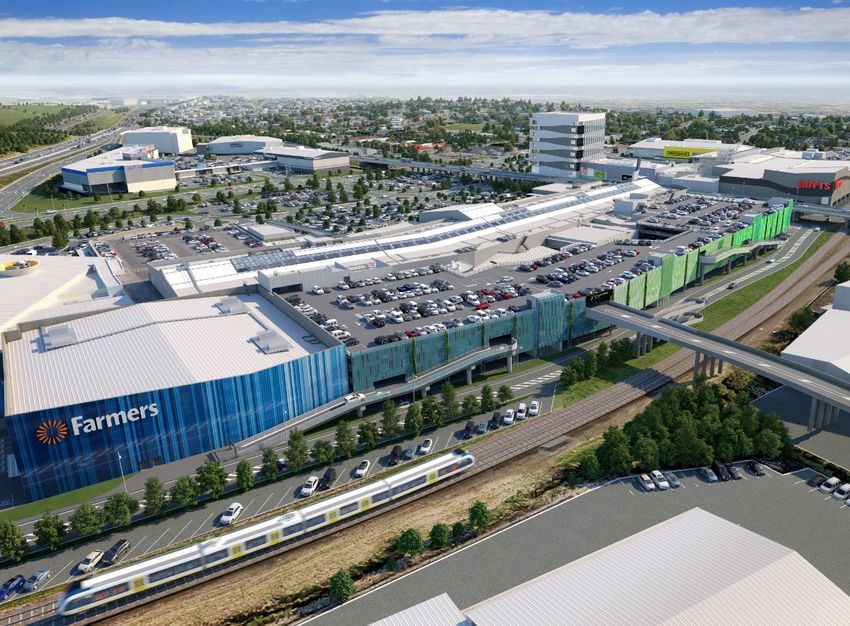
Solid rental growth

                              4.6%              •   Portfolio strength continues to
                                                    improve, driven by intensive asset
                      Total rental growth           management
                              FY19: +4.0%       •   New leases and renewals
                                                    particularly pleasing:

                           99.4%
                                                     • Mixed-use portfolio +14.1%
                                                     • Office portfolio +8.5%
                                                     • Retail portfolio +0.8%
                             Occupancy
                              FY19: 99.3%       •   Occupancy and weighted average
                                                    lease expiry metrics remain strong

                           5.1 years
          Weighted average lease expiry
                           FY19: 5.2 years

                                                                      1.03   Portfolio statistics
                                                                      1.04   Net rental income
                                                                      1.11   New leasing and rent reviews
                                                                      1.12   Lease expiry profile

Kiwi Property > Type Presentation Name > Date                 Kiwi Property half-year 2020 result presentation   5
Positive retail sales
                                             All centres               Shopping centres
                                                                        (excl. large format
                                                                                                    •   Total retail sales of $1.71 billion,
                                          (incl. large format
                                                centres)                     centres)1                  $1.54 billion of which came from
                                                                                                        shopping centre assets
Total sales (billion)                         $1.71                        $1.54
                                                                         (Mar-19: $1.53)            •   Increase in sales performance,
                                                                                                        with total sales growth, like-for-
Total sales growth                            +2.1%                        +2.3%                        like sales growth and specialty
                                                                                                        sales productivity all increasing
Like-for-like sales growth                   +2.4%                         +2.2%                    •   Good growth in discretionary
                                                                                                        spend categories:
Specialty sales (per sqm)                                              $11,400                            • Home and living +12.1%
                                                                                                          • Commercial services +11.0%
                                                                       (Mar-19: $11,000)
                                                                                                          • Pharmacy and wellbeing
Specialty GOC                                                               11.9%                           +10.6%
                                                                          (Mar-19: 12.1%)

Pedestrian count (million)                                                  46.2
                                                                          (Mar-19: 47.7)

Note 1 Mar-19 comparable data excludes large format centres and North City, which was sold during
the year.
                                                                                                                         1.14 Retail sales by centre
                                                                                                                         1.15 Retail sales by category

Kiwi Property > Type Presentation Name > Date                                                                    Kiwi Property half-year 2020 result presentation   6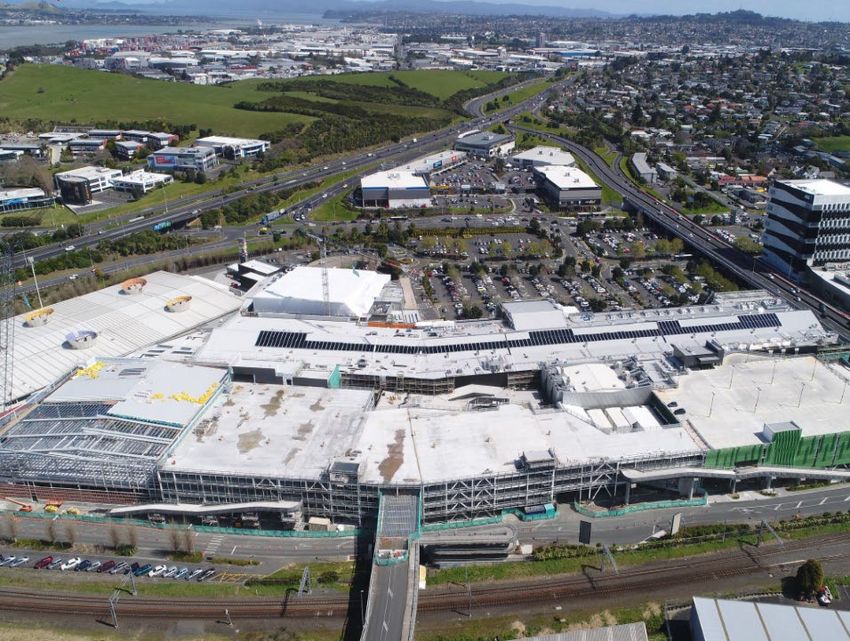
Active capital management

                                4.52%                                     •   During the period we extended
                                                                              $166m of existing debt facilities
               Weighted average cost of debt                              •   Equity raise undertaken post-
                                  FY19: 4.80%                                 balance date:
                                                                               • Raised $180m to reduce

                           3.3 years
                                                                                  gearing and fund development
                                                                                  pipeline, and new acquisition
                                                                                  opportunities
                         Weighted average                                      • Retail offer targeting $20m of
                      term to maturity of debt                                    additional equity
                               FY19: 3.2 years

                            Credit ratings

                    BBB+ BBB                                (stable)
                    Issue rating                Corporate credit rating
                (fixed-rate bonds)                                                              1.03   Portfolio statistics
                                                                                                4.07   Balance sheet
                                                                                                4.08   Investment properties movement
                                                                                                4.09   Net finance debt movement

Kiwi Property > Type Presentation Name > Date                                           Kiwi Property half-year 2020 result presentation   7
Solid balance sheet

                             $3.3b              •   Property assets have increased due
                                                    to development expenditure,
                          Property assets           primarily at Sylvia Park and the
                                                    acquisition of 51-53 Carbine Road
                             +$0.1b +3.5%           and 7-10 Arthur Brown Place
                                                •   Pro-forma gearing after allowing for

                           32.8%
                                                    new equity of ~27.4% comfortably
                                                    within our target band of 25%-35%

                                 Gearing
                              FY19: 31.0%

                             $1.42
                   Net asset backing per
                                                                      1.03   Portfolio statistics
                           share                                      4.07   Balance sheet
                                                                      4.08   Investment properties movement
                              FY19: $1.43                             4.09   Net finance debt movement
Kiwi Property > Type Presentation Name > Date                 Kiwi Property half-year 2020 result presentation   8
FFO, AFFO and half-year dividend

    3.60 cps                                    3.21 cps            • A half-year dividend of 3.525
                                                                      cents per share will be paid
                  FFO                                AFFO             • Up 1.4% on the comparable
                                                                         period last year
        -0.07 cps -1.8%                          +0.10 cps +3.1%
                                                                      • In-line with guidance

                        3.525 cps
                 FY20 half-year cash dividend
                              +0.05 cps +1.4%

             98%                                   110%
      FFO payout ratio                          AFFO payout ratio
                                                                                       4.04 FFO
                                                                                       4.05 Dividends
                                                                                       4.06 AFFO

Kiwi Property > Type Presentation Name > Date                                  Kiwi Property half-year 2020 result presentation   9
Our strategic focus

      We have embedded our mixed-use strategy in the first six
      months of the 2020 financial year, realigning the business to
      our core priorities and creating a platform for future growth

                                                                             Focus on
                                         Intensify the                       developing a
                                         mixed-use component   Optimise      funds management
                                         of our business       performance   business

Kiwi Property > Type Presentation Name > Date                                   Kiwi Property half-year 2020 result presentation 10
Our mixed-use opportunities Sylvia Park, Auckland LynnMall, Auckland total land holdings total land holdings 35 hectares 7 hectares The Base, Hamilton Drury, Auckland total land holdings total land holdings 30 hectares 51 hectares Kiwi Property > Type Presentation Name > Date Kiwi Property half-year 2020 result presentation 11
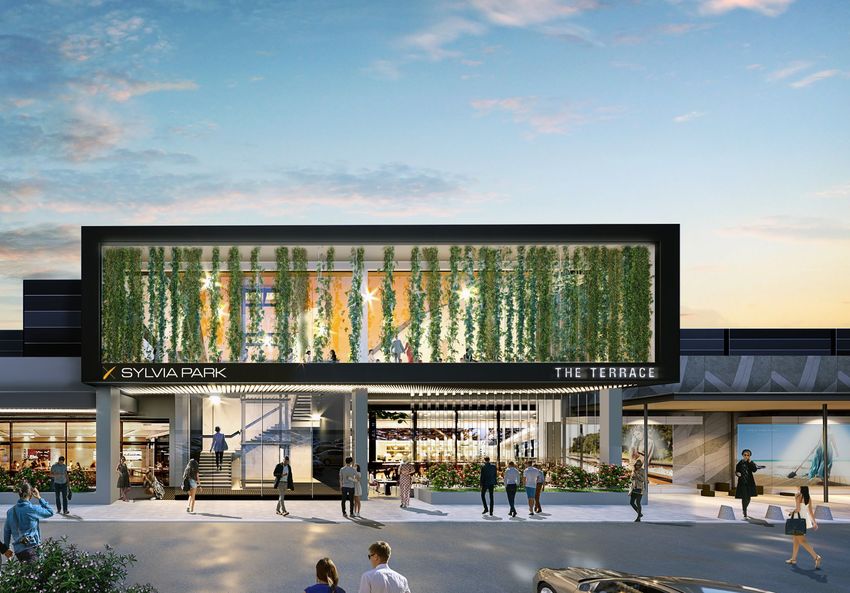
Delivering mixed-use at Sylvia Park

                    Concept only. Subject to change                 Concept only. Subject to change
                                                                                                                                            Indicative only.

  Commercial tower two                                Build to rent (BTR)                             Land acquisition
  ADVANCED PLANNING                                   UNDER ASSESMENT                                 ONGOING WHERE REQUIRED

  • Concept plan progressing, including               • Analysis of macro-fundamentals                • 51-53 Carbine Road and 7-10 Arthur
    potential for a 15,000 sqm office and               suggests strong potential demand                Brown Place acquired for $25.5m
    ~140 room hotel                                     for BTR accommodation                         • 20,745 sqm combined landholding
  • Strong interest from office tenants               • Initial design underway for potential         • Adjacency to Sylvia Park and
    and international hotel operators                   150-250 apartment complex                       excellent transport connectivity offers
  • Target construction from late 2020                • Assessing on-balance sheet vs. fund             strong potential for mixed-use
                                                        management funding options                      development

Kiwi Property > Type Presentation Name > Date                                                             Kiwi Property half-year 2020 result presentation 12
Sustained progress at Sylvia Park
south
carpark
galleria
Photo credit: Kmart Artist’s impression September 2019
Kmart Galleria South carpark
COMPLETE IN PROGRESS IN PROGRESS
• 5,000 sqm store commenced trading • New ~19,000 sqm galleria retail level • New ~900 space multi-level carpark
on 15 August 2019 featuring ~60 new stores • Includes 10 EV charging stations
• New Zealand’s first and only 24 hour • Retailers have committed to two- • Will feature advanced vehicle
Kmart store thirds of space (by NLA) management system
• Already one of NZ’s top performing • Finalising negotiations with key • On programme for opening mid-
Kmart outlets; top 10% in Australasia international and national retailers 2020
• Opening from August 2020
Kiwi Property > Type Presentation Name > Date Kiwi Property half-year 2020 result presentation 13Optimising our performance
Rental growth Organisation realignment Embedding sustainability
DELIVERED IN PROGRESS ONGOING
• Solid growth in new and renewed • Business-wide realignment instigated • 35 free "top up while you shop" EV
leases, in particular: to match teams to mixed-use and charging stations now in place
• Mixed-use +14.1% revenue opportunities • Northlands solar installation now
• Retail +0.8% • Reorganisation process nearing operational. The Plaza’s new array is
• Office +8.5% completion and delivering efficiency due for completion in November
enhancements • All office buildings achieved a
• Vero Centre leasing benefiting from
tight occupancy and increasing • Long term incentive scheme being NABERSNZ rating of 4 stars or above
replaced with new performance-
rents for premium-grade office
based share rights programme
space
Kiwi Property > Type Presentation Name > Date Kiwi Property half-year 2020 result presentation 14We have a clear focus
Intensify mixed-use
Sylvia Park
• Continue construction and leasing of
galleria and south carpark
• Progress planning of commercial
tower two and confirm build to rent
feasibility
The Base
Develop funds management
• Progress plans for new food and
beverage precinct
• Actively pursue opportunities to
leverage our portfolio and establish
Drury
new sources of revenue
• Submit plan change and continue
advocating for accelerated
construction timeline
Optimise performance
• Grow gross occupancy cost ratios
across our assets through rental
income improvement
• Complete organisational realignment,
embed new team structure and ways
of working
Kiwi Property > Type Presentation Name > Date Kiwi Property half-year 2020 result presentation 15Outlook and dividend guidance
FY20 cash dividend guidance Kiwi Property is well positioned for
7.05
growth:
• Clearly defined strategy
• High-quality asset portfolio
cents per share1
• Robust balance sheet
• Gearing well within range
• Strong development pipeline
• Organisation aligned to strategic
opportunities
4.04 FFO
4.05 Dividends
Note 1 Subject to the absence of material adverse effects or unforeseen circumstances.
.
Kiwi Property > Type Presentation Name > Date Kiwi Property half-year 2020 result presentation 16Property update
Property update: index 1.01 Our portfolio 19 1.02 Property portfolio summary 20 1.03 Portfolio statistics 21 1.04 Net rental income 22 1.05 Capitalisation rate history 23 1.06 Geographic diversification 24 1.07 Sector and tenant diversification 25 1.08 Mixed-use portfolio diversification 26 1.09 Retail portfolio diversification 27 1.10 Office portfolio diversification 28 1.11 Rent reviews and new leasing 29 1.12 Lease expiry profile 30 1.13 Tenant diversification 31 1.14 Retail sales by centre 32 1.15 Retail sales by category 33 Kiwi Property > Type Presentation Name > Date Kiwi Property half-year 2020 result presentation 18
Our portfolio                                                                                                                            1.01
Sylvia Park                                                                           Sylvia Park Lifestyle                                                LynnMall

                                                                                      The Base (50%)                        The Base (50%)

                     Westgate Lifestyle                          Centre Place North                           Vero Centre                        ASB North Wharf

                               The Plaza                                 Northlands                    The Aurora Centre                           44 The Terrace

Kiwi PropertyMixed-use
Key:         > Type Presentation
                       portfolio Name  > Date
                                   Retail portfolio   Office portfolio                                              Kiwi Property half-year 2020 result presentation 19
Property portfolio summary 1.02
30-Sep-19 31-Mar-19
Mixed-use Retail Office Total Mixed-use Retail Office Total
Number of assets 1.03 4 4 4 12 4 4 4 12
Value ($m)1,2 1.03 1,612.2 604.2 894.8 3,111.2 1,533.5 597.5 893.0 3,024.0
% of total portfolio by value 1.07 49 18 27 94 48 18 28 94
Weighted average capitalisation rates2 1.03 assets were not independently valued at Sep-19 5.71% 7.53% 5.45% 5.99%
Net lettable area (sqm) 1.03 229,077 114,868 95,995 439,941 226,347 114,531 95,992 436,870
Number of tenants 1.13 503 322 67 892 521 329 63 913
% investment portfolio by gross income 47 27 26 100 47 27 26 100
Occupancy (by area)3 1.03 99.8% 99.3% 98.8% 99.4% 99.5% 99.4% 98.7% 99.3%
Weighted average lease expiry (by income) 1.03 3.9 years 3.3 years 9.1 years 5.1 years 4.1 years 3.3 years 9.3 years 5.2 years
The following notes apply to all of appendix 1.00 (where applicable): Note 1 At 30-Sep-19, excluded other properties and development land with a combined value of $212.7 million
(6% of total portfolio value). At 31-Mar-19, excluded other properties and development land with a combined value of $183.4 million (6% of total portfolio value). Note 2 Assets were not
independently valued at 30-Sep-19. Assets are held at their 31-Mar-19 independent valuations adjusted for capital expenditure incurred over the period. Note 3 Vacant tenancies with
current or pending development works are excluded from the occupancy statistics. At 30-Sep-19 excluded 1,660 sqm at Sylvia Park and 353 sqm at The Base. At 31-Mar-19, excluded 488
sqm at Sylvia Park, 102 sqm at LynnMall and 204 sqm at Northlands. Tenancies at Westgate Lifestyle subject to vendor rental underwrites are treated as occupied. General note Kiwi
Property owns 100% of all assets except The Base which is 50% owned.
1.03 Portfolio statistics
1.07 Sector and tenant diversification
1.13 Tenant diversification
Kiwi Property > Type Presentation Name > Date Kiwi Property half-year 2020 result presentation 20Portfolio statistics 1.03
Adopted value $m Capitalisation rate % NLA sqm Occupancy % WALE years
As at 30-Sep-19 31-Mar-19 30-Sep-19 31-Mar-19 30-Sep-19 31-Mar-19 30-Sep-19 31-Mar-19 30-Sep-19 31-Mar-19
Sylvia Park 1,030.5 955.0 5.38 87,455 86,427 99.6 100.0 4.1 4.2
Sylvia Park Lifestyle 77.0 77.0 6.25 16,550 16,550 100.0 100.0 2.2 2.7
--- assets were not independently valued at Sep-19 ---
LynnMall 285.9 284.0 6.38 37,698 37,689 99.6 98.7 4.5 4.7
The Base 218.8 217.5 6.13 87,374 85,681 100.0 99.1 3.2 3.3
Mixed-use portfolio 1,612.2 1,533.5 5.71 229,077 226,347 99.8 99.5 3.9 4.1
Westgate Lifestyle 90.0 90.0 6.38 25,604 25,604 100.0 100.0 4.8 5.4
Centre Place North 53.3 53.5 10.25 15,833 15,805 97.9 97.0 2.5 2.9
The Plaza 209.5 207.0 7.38 32,232 32,201 99.7 99.9 3.1 3.3
Northlands 251.3 247.0 7.50 41,200 40,921 99.1 99.6 3.5 3.0
Retail portfolio 604.2 597.5 7.53 114,868 114,531 99.3 99.4 3.3 3.3
Vero Centre 451.5 450.0 5.13 39,542 39,539 97.0 97.0 6.1 6.1
ASB North Wharf 230.5 230.0 5.38 21,625 21,625 100.0 100.0 11.2 11.7
The Aurora Centre 159.5 159.5 6.13 24,503 24,503 100.0 100.0 14.7 15.2
44 The Terrace 53.3 53.5 6.50 10,325 10,325 100.0 100.0 7.2 7.7
Office portfolio 894.8 893.0 5.45 95,995 95,992 98.8 98.7 9.1 9.3
Investment portfolio 3,111.2 3,024.0 5.99 439,941 436,870 99.4 99.3 5.1 5.2
Adjoining properties 151.0 125.2 For notes supporting these values and statistics, refer to appendix 1.02.
Development land 61.7 58.2
Total portfolio1 3,323.9 3,207.4
1.02 Property portfolio summary
Note 1 Excludes right-of-use assets of $6.1 million
Kiwi Property > Type Presentation Name > Date Kiwi Property half-year 2020 result presentation 21Net rental income 1.04
30-Sep-19 30-Sep-18 Variance • Solid growth in rental income at The Base
Six months ended $m $m $m % underpinned by new lettings, while in
Sylvia Park 21.8 21.4 +0.4 +1.8 contrast, Centre Place North experienced
Sylvia Park Lifestyle 2.6 2.6 +0.1 +2.8
increased vacancies during the period
LynnMall 9.4 9.3 +0.1 +1.3
The Base 6.4 6.0 +0.4 +5.2
Mixed-use portfolio 40.2 39.3 +1.0 +2.3 • Completed Langdons Quarter positively
Westgate Lifestyle 3.0 3.0 +0.0 +0.0 impacting rents at Northlands.
Centre Place North 2.6 3.0 -0.4 -13.8
The Plaza 8.3 8.2 +0.1 +0.8
Northlands 9.9 9.3 +0.6 +6.2 • Vero Centre vacancies filled, lifting rental
Retail portfolio 23.7 23.5 +0.2 +0.9 performance; operating expenses at our
Vero Centre 10.9 8.9 +2.0 +18.9
Wellington office assets increased on the back
of rising insurance costs
ASB North Wharf 6.4 6.2 +0.2 +3.3
The Aurora Centre 4.2 4.5 -0.3 -6.6
44 The Terrace 1.6 1.6 -0.0 -2.8
Office portfolio 23.0 21.2 +1.8 +7.4
Other properties 2.1 1.9 +0.3 +13.8
Net operating income (before disposals) 89.1 85.8 +3.3 +0.8
North City - 2.7 -2.7 -100.0
Net operating income (after disposals) 89.1 88.5 +0.6 +0.7
Straight-lining of fixed rental increases 0.6 1.4 -0.9 -60.7 1.12 Lease expiry profile
4.01 Profit after tax
Net rental income 89.6 89.9 -0.3 -0.3
Kiwi Property > Type Presentation Name > Date Kiwi Property half-year 2020 result presentation 22Capitalisation rate history 1.05
8.48%
8.50%
8.43%
8.00%
7.99%
7.50% 7.53%
7.09%
7.00%
6.50%
6.00% 5.99%
5.71%
5.50%
5.45%
5.00%
Mar-10
Mar-11
Mar-12
Mar-13
Mar-14
Mar-15
Mar-16
Mar-17
Mar-18
Mar-19
Mar-07
Mar-08
Mar-09
Key: Mixed-use Retail Office Investment portfolio
Kiwi Property > Type Presentation Name > Date Kiwi Property half-year 2020 result presentation 23Geographic diversification 1.06
Geographic diversification
($2.37b) Auckland by portfolio value
Auckland region: Pop. 1,572,000
(Largest region, 33.4% of NZ)
3 x mixed-use assets
1 x retail asset
2 x office assets
($278m) Hamilton
Waikato region: Pop. 458,000
(4th largest region, 9.7% of NZ)
1 x mixed-use asset
1 x retail asset
2 x 3 rd party management mandates
($209m) Palmerston North
Manawatu-Whanganui region: Pop. 239,000
(6th largest region, 5.1% of NZ)
1 x retail asset
Wellington ($213m)
New Zealand’s capital city
Wellington region: Pop. 507,000
(3rd largest region, 10.8% of NZ)
2 x office assets
1 x 3 rd party management mandate Auckland 71%
Hamilton 8%
Christchurch ($258m)
Christchurch 8%
Canterbury region: Pop. 600,000
(2nd largest region, 12.8% of NZ)
Wellington 7%
1 x retail asset
Note Population statistics sourced from Statistics New Zealand,
Palmerston North 6%
2018 Census results (usually resident population count).
Kiwi Property > Type Presentation Name > Date Kiwi Property half-year 2020 result presentation 24Sector and tenant diversification 1.07
Sector diversification Tenant diversification
by portfolio value by investment portfolio gross income
Mixed-use 49% Specialty stores 47% Mini-majors 13%
Retail 18% Banking 8% Government 7%
Office 27% Department stores and DDS 6% Legal 5%
Other 6% Supermarkets 4% Insurance 3%
Financial services 2% Cinemas 2%
Consultancy and other office 2% Home and living majors 1%
Kiwi Property > Type Presentation Name > Date Kiwi Property half-year 2020 result presentation 25Mixed-use portfolio diversification 1.08
Property type Geographic diversification Tenant diversification
by mixed-use portfolio value by mixed-use portfolio value by mixed-use portfolio gross income
Regional centres1 95% Auckland 86% Specialty stores 60%
Large format centres 5% Hamilton 14% Mini-majors 21%
Department stores and DDS 6%
Note 1 Includes ANZ Raranga office building
which forms part of Sylvia Park. Supermarkets 4%
Cinemas 3%
Banking 3%
Insurance 1%
Home and living majors 1%
Other 1%
Kiwi Property > Type Presentation Name > Date Kiwi Property half-year 2020 result presentation 26Retail portfolio diversification 1.09
Property type Geographic diversification Tenant diversification
by retail portfolio value by retail portfolio value by retail portfolio gross income
Regional centres 76% Christchurch 41% Specialty stores 66%
Large format centres 15% Palmerston North 35% Mini-majors 11%
Sub-regional centres 9% Auckland 15% Department stores and DDS 10%
Hamilton 9% Supermarkets 8%
Cinemas 2%
Home and living majors 2%
Other 1%
Kiwi Property > Type Presentation Name > Date Kiwi Property half-year 2020 result presentation 27Office portfolio diversification 1.10
Property type Geographic diversification Tenant diversification
by office portfolio value by office portfolio value by office portfolio gross income
Premium 50% Auckland 76% Government 26%
A-grade campus 26% Wellington 24% Banking 25%
A-grade 18% Legal 20%
B-grade 6% Financial services 10%
Insurance 9%
Other office 4%
Specialty stores 4%
Consultancy 1%
Other 1%
Kiwi Property > Type Presentation Name > Date Kiwi Property half-year 2020 result presentation 28Rent reviews and new leasing 1.11
Rent reviews Mixed-use Retail Office Total Rent reviews
No. 149 105 28 282
• High percentage of structured reviews (81%)
NLA (sqm) 54,296 34,841 54,433 143,570
has again provided consistent uplift,
% investment portfolio NLA 12 8 12 33 averaging +2.6% on a compound annual basis
Rental movement (%) +3.6 +2.5 +4.6 +3.8
Compound annual growth (%) +3.5 +1.9 +2.3 +2.6
Structured increases (% portfolio) 97 86 55 81
New leases and renewals New leasing
No. 47 23 8 78
• Mixed-use +14.1% the result of positive
NLA (sqm) 9,474 6,248 3,777 19,499 leasing across the whole portfolio and
% investment portfolio NLA 2 1 1 4 particularly The Base and Sylvia Park
Rental movement (%) +14.1 +0.8 +8.5 +9.1
• Retail +0.8% under-pinned by new leasing at
WALE (years) 5.4 6.0 6.0 5.7 The Plaza
Total (excl development leasing) • Office +8.5% comprises new leases at the
No. 196 128 36 360 Vero Centre which continues to benefit from
NLA (sqm) 63,770 41,089 58,210 163,069 tight occupancy and increasing rents for
% investment portfolio NLA 15 9 13 37
premium-grade office space
Rental movement (%) +5.8 +2.2 +4.9 +4.6
Kiwi Property > Type Presentation Name > Date Kiwi Property half-year 2020 result presentation 29Lease expiry profile 1.12
Mixed-use and retail
Lease expiry profile
% of investment portfolio gross income
• Our focus for FY20 is on specialty store
50% expiries across our mixed-use and retail
47%
portfolios
40%
Office
30%
• We remain focused on leasing up
vacancy at the Vero Centre
20%
• Approximately 3,400 sqm of space at the
Vero Centre was leased or renewed
13% during the first half of the 2020 financial
9% 10% 10% year, for a weighted average lease term
9%
10% of six years
2%
0%
vacant or FY20 FY21 FY22 FY23 FY24 FY25+
holdover
Key: Mixed-use Retail Office
Kiwi Property > Type Presentation Name > Date Kiwi Property half-year 2020 result presentation 30Tenant diversification 1.13
Tenant diversification Top 20 tenants Our top 20 tenants
% of investment portfolio gross income % of investment portfolio gross income
● Department stores and DDS 6 ASB Bank 7.0
● Supermarkets 4 Ministry of Social Development 5.0
occupy
51%
● Cinemas 2 Farmers 3.2
● Home and living 1 ANZ Bank 2.4
● Mini-majors 13 Countdown 2.2 of investment
portfolio
● Fashion 16 The Warehouse 2.1 area
● Food 11 Bell Gully 1.9
● General 6 Cotton On Group 1.9
● Pharmacy and wellbeing 6 PAK’nSAVE 1.8
● Home and living 1 Hoyts 1.8 contribute
● Other retail
Banking
7
8
Suncorp
Just Group
1.8
1.7
42%
of investment
Government 7 Hallensteins/Glassons 1.5 portfolio gross
Legal 5 Russell McVeagh 1.5 income
Insurance 3 Kmart 1.5
Financial services 2 Rebel/Briscoes 1.1
Consultancy and other 2 Craigs Investment Partners 1.0 have a weighted
average lease expiry of
total (913 tenants) 100 BNZ Bank 0.9
Key: Majors Mini-majors Specialty Office
IAG 0.9 7.0 years
Westpac 0.8
Kiwi Property > Type Presentation Name > Date Kiwi Property half-year 2020 result presentation 31Retail sales by centre 1.14
Pedestrian
MAT $m % Var. from Sep-18 Specialty sales1 count • Overall sales (excluding large format
Like-for-
centres) grew by +2.3% or 2.2% like-for-
Year ended 30-Sep-19 Total like $/sqm GOC% Million pa like
Sylvia Park 559.0
• Specialty sales grew to $11,400 per
LynnMall 257.2 square metre (Mar-19: $11,000) and a
The Base – Te Awa 157.0 consistent gross occupancy cost of
Mixed-use centres 973.2 11.9% (Mar-19: 12.1%) means rentals
have also improved
Centre Place North 76.5
The Plaza 200.3
Northlands 290.4
Retail centres 567.2
Shopping centres 1,540.4 +2.3 +2.2 11,400 11.9 46.2
Sylvia Park Lifestyle2 7.3
Westgate Lifestyle2 23.2
The Base – LFR 142.6
Large format retail 173.1
Total 1,713.5
Note 1 Specialty sales $/sqm and GOC% include commercial services categories. Note 2 Sales data is being
requested, however most tenants are not obliged to provide it under current leases. Total sales reported are shown,
but due to the changing composition of those who do report, comparable statistics are not meaningful.
Kiwi Property > Type Presentation Name > Date Kiwi Property half-year 2020 result presentation 32Retail sales by category 1.15
MAT $m % Var. from Sep-18 • Positive growth has been recorded across
Year ended 30-Sep-19 Total Like-for-like most categories, with particularly good
uplift from:
Shopping centres
● Supermarkets 295.4 -2.3 +3.1 • Commercial services; discretionary spend
● Department stores and DDS 182.2 +4.4 +1.4 including travel and mobile phones
● Cinemas 34.2 -5.4 -5.4
• Pharmacy and wellbeing; including
● Mini-majors 240.9 +2.6 +1.2 personal services such as hair, beauty,
● Fashion 255.3 -2.3 -0.6 massage and cosmetics
● Commercial services 194.8 +11.0 +11.8
• Mini-majors; good growth from those in
● Food 135.1 +2.6 +1.0 the home/living categories
● Pharmacy and wellbeing 102.3 +10.6 +0.7
• While fashion recorded a sales decline
● General 77.7 +1.3 -0.3
overall, some sub-categories showed good
● Home and living 22.6 +12.1 -1.0 growth, including sportswear, fashion
Total 1,540.4 +2.3 +2.2 accessories and fine jewellery
• The supermarket category was impacted by
Key: Majors Mini-majors Specialty
the exit of Countdown from Sylvia Park in
FY19
Kiwi Property > Type Presentation Name > Date Kiwi Property half-year 2020 result presentation 33Development update
Development update: index 2.01 Development pipeline 36 2.02 Sylvia Park: Kmart 37 2.03 Sylvia Park: galleria and south carpark 38 2.04 Sylvia Park: progress update image 39 2.05 Sylvia Park: completed project render 40 Kiwi Property > Type Presentation Name > Date Kiwi Property half-year 2020 result presentation 35
Development pipeline                                                                                                            2.01

Mar-18             Sep-18            Mar-19            Sep-19        Mar-20         Sep-20         Mar-21           Sep-21             beyond

               Langdons Quarter

                                Sylvia Park Kmart
                                                                                                               ~$258 million of
                             Sylvia Park galleria & south carpark
                                                                                                               development in progress

         Drury structure planning                                Drury plan change activities                       Drury design & development

                                                        The Base food & beverage precinct

                                                                              Sylvia Park No.2 office/hotel building

                                                          Northlands major, mini-major & specialty space

                                                                                             Sylvia Park No.3 office building

                                                                                                              LynnMall mixed use & commercial

           Key:             Completed           In progress     Advanced planning      Master planning (indicative, not committed subject to change)

Kiwi Property > Type Presentation Name > Date                                                                 Kiwi Property half-year 2020 result presentation 36
2.02 Sylvia Park
Kmart
Project overview
• New 5,000 sqm store
• Conversion of the previous Countdown tenancy
• Initial 10-year lease
• Commenced trading 19 August 2019
Financial metrics
Total project cost $12.6m
Timetable
Construction commenced Oct-18
Construction completed Aug-19
spent to to spend
Cost profile ($m) FY19 1H 20 2H 20 FY21
Total (incl. letting up
5.5 7.1 - -
allowances)
372.03 Sylvia Park
Galleria and south carpark
Project overview
• New galleria retail level:
•~19,000 sqm with ~60 new retailers
•Two-level Farmers department store
•Next generation casual dining experience
•Retailers have committed to two-thirds of
space by NLA
• New five level ~900 space carpark building with
10 EV charging stations
Financial metrics
Expected total cost $258m
Projected Y1 yield (FY22) 5.7%
Projected Y3 yield (FY24) 6.2%
Projected 10-year IRR >10%
Projected development margin >$30m
Timetable
Construction commenced Mar-18
Projected construction completion From mid 2020
spent to to spend
Cost profile ($m) FY19 1H 20 2H 20 FY21
Total (incl. letting up
88.3 58.8 78.5 32.2
allowances)
Artist’s impression. Concept only. Subject to change.
38Sylvia Park galleria and south carpark
Progress update as at September 2019
2.04
39Sylvia Park galleria and south carpark 2.05
Render showing completed project
Artist’s impression. Concept only. Subject to change
40Appendix break slide
Market
update
Kiwi Property > Type Presentation Name > Date Kiwi Property half-year result presentation 2020 41Market update: index 3.01 NZ economic overview 43 3.02 Auckland CBD office market 44 3.03 Wellington CBD office market 45 Kiwi Property > Type Presentation Name > Date Kiwi Property half-year 2020 result presentation 42
New Zealand economic review 3.01
Gross domestic product (GDP)1
GDP trend
GDP growth pa (Mar-19 estimate) 2.7% 400
$296b
6%
GDP growth (% pa)
GDP (LHS)
GDP ($ billion)
300 4%
GDP (2019 estimate) $296 billion
200 2%
GDP per capita (2019 estimate) $60,995 2.7%
100 0%
GDP growth (RHS)
0 -2%
Inflation2
Mar-08
Mar-09
Mar-10
Mar-11
Mar-12
Mar-13
Mar-14
Mar-15
Mar-16
Mar-17
Mar-18
Mar-19
Mar-20
Mar-21
Mar-22
Mar-23
Mar-24
Annual inflation (Mar-19) 1.5%
Labour market2 Inflation trend
5%
Unemployment rate (Mar-19) 4.2%
4%
3%
1.5%
Currency 2%
1%
US $1.00 = NZ $1.58 0%
Currency (as at 13-Nov-19)
Mar-08
Mar-09
Mar-10
Mar-11
Mar-12
Mar-13
Mar-14
Mar-15
Mar-16
Mar-17
Mar-18
Mar-19
Mar-20
Mar-21
Mar-22
Mar-23
JPY100 = NZ $1.45
Household economic information2
Unemployment trend
Annual wages growth rate (Jun-19) 2.0% 8%
Note 1 Sourced from New Zealand Institute of Economic Research Quarterly 6% 4.2%
Predictions (Sep-19). Note 2 Sourced from Statistics New Zealand (statistics as at 4%
Jun-19).
2%
0%
Mar-08
Mar-09
Mar-10
Mar-11
Mar-12
Mar-13
Mar-14
Mar-15
Mar-16
Mar-17
Mar-18
Mar-19
Mar-20
Mar-21
Mar-22
Mar-23
Kiwi Property > Type Presentation Name > Date Kiwi Property half-year 2020 result presentation 43Auckland CBD office market 3.02
Outlook Key points (premium and a-grade accommodation) Our Auckland office exposure
► Supply - Premium: no change to stock until completion of the
39,000 sqm PwC Tower, now 2020
- A-grade: stock is expected to increase by over 35,000 sqm
in 2021 with the completion of 10 Madden Street, plus two
Mansons developments on Fanshawe Street
▲ Absorption - Premium: solid tenant demand environment is expected to
result in positive overall absorption as new supply comes on
board and landlords backfill remaining space Premium A-grade
- A-grade: negative absorption expected in 2020 as several
Buildings Vero Centre ASB North Wharf
occupiers upgrade to new space or backfill premium space
post the completion of the new PwC Tower. Positive Value $m 451.5 230.5
absorption is expected from 2021 Office portfolio %
50.5 25.8
by value
▲ Vacancy - Premium: forecast to be 2.3%
for 2019, increasing to 7.9% in
2020 following completion of the PwC Tower the Total portfolio %
13.6 6.9
by value
fluctuating between 5% and 10% through to 2023
WALE years 5.7 11.2
- A-grade: forecast to be 3.5% for 2019, increasing nominally
as supply increases but remaining below 9% through to Occupancy % 95.4 100.0
2023 Expectations With high premium- ASB North Wharf has
► - Premium: forecast to average $469/sqm for 2019, softening grade occupancy excellent investment
Rents and no new supply qualities; an
($/sqm/net to $460/sqm in 2020 with slow growth (1.6%pa) to 2023 until 2020, Vero unparalleled and
effective) - A-grade: forecast to average $366/sqm for 2019, softening Centre has benefited improving location,
from rental growth high-quality building
to $364/sqm in 2020 with slow growth (1.4%pa) to 2023
and strong and a long-term lease
investment interest in in place to a secure
▼ Yield - Premium: forecast to average 5.1% at end 2019, firming to the asset class tenant. Its value
5.0% in 2020 and remaining stable thereafter should continue to
- A-grade: forecast to average 6.0% at end 2019, firming to benefit from high
investor demand for
5.9% in 2020 and remaining stable thereafter these attributes
Note Sourced from CBRE Research: Auckland Property Market Outlook (Jun-19).
Kiwi Property > Type Presentation Name > Date Kiwi Property half-year 2020 result presentation 44Wellington CBD office market 3.03
Outlook Key points (a-grade and b-grade accommodation) Our Wellington office exposure
▲ Supply - A-grade: in 2019, nearly 50,000 sqm of a-grade space is
expected to re-enter supply, predominantly the return of
buildings withdrawn for repair post the 2016 earthquake and
the completion of WAP2 projects, including the 38,000 sqm
Bowen Campus
- B-grade: almost 80,000 sqm is expected to re-enter the
market over 2020-2022
▲ Absorption - A-grade: expected to have positive net absorption from A-grade B-grade
2019 as new supply comes on-board
Buildings The Aurora Centre 44 The Terrace
- B-grade: positive net absorption is forecast from 2020-2022
Value $m 159.5 53.3
▲ Vacancy - A-grade: forecast to be 1.2% for 2019 but with supply out-
stripping absorption will increase to c. 5% by 2023 Office portfolio %
17.8 6.0
by value
- B-grade: forecast to be 2.1% for 2019 but with supply out-
stripping absorption will increase to c. 8% by 2023 Total portfolio %
4.8 1.6
by value
▲ Rents - A-grade: forecast to average $312/sqm for 2019, increasing WALE years 14.7 7.2
($/sqm/net to $338/sqm over the next two years then remaining stable
B-grade: forecast to average $246/sqm for 2019 and remain Occupancy % 100.0 100.0
effective)
stable over the forecast horizon Expectations The Aurora Centre and 44 The Terrace both
present as solid investment-grade assets.
▲ Yield - A-grade: forecast to average 7.1% at end 2019, firming to Both have been strengthened and
7.0% in 2020 and remaining stable thereafter refurbished to a high standard and benefit
from long-term government leases over all
- B-grade: forecast to average 8.2% at end 2019 and remain office space
stable over the forecast horizon
Note Sourced from CBRE Research: Wellington Property Market Outlook (Jun-19).
Kiwi Property > Type Presentation Name > Date Kiwi Property half-year 2020 result presentation 45Financial
update
Kiwi Property > Type Presentation Name > Date Kiwi Property half-year 2020 result presentation 46Financial update: index 4.01 Profit after tax 48 4.02 Interest and finance charges 49 4.03 Management expense ratio (MER) 50 4.04 Funds from operations (FFO) 51 4.05 Dividends 52 4.06 Adjusted funds from operations (AFFO) 53 4.07 Balance sheet 54 4.08 Investment properties movement 55 4.09 Net finance debt movement 56 4.10 Finance debt facilities 57 4.11 Capital management metrics 58 4.12 Fixed-rate debt profile 59 Kiwi Property > Type Presentation Name > Date Kiwi Property half-year 2020 result presentation 47
Profit after tax                                                                                                                                     4.01

                                                                        30-Sep-19          30-Sep-18            Variance          Rental income
Six months ended                                                                 $m                $m         $m            %     • Increased due to rental growth at
                                                                                                                                    the Vero Centre and lease up of
Property revenue                                              1.04            117.3             116.9       +0.4         +0.3
                                                                                                                                    ANZ Raranga
Property management income                                                      0.9                1.0       -0.1       -16.4
Interest and other income                                                        0.1               0.1           -                Interest and finance charges
Gain on disposal of investment properties                                          -              0.6        -0.6        -100
                                                                                                                                  • Increased due to capital
                                                                                                                                     expenditure on completed
Total income                                                                  118.3             118.6       -0.3         -0.3        developments (ANZ Raranga and
Direct property expenses                                                      -27.7             -27.0        -0.7         -2.6       Kmart) and the acquisition of 43
                                                                                                                                     Carbine Road
Interest and finance charges                                  1.04            -19.4              -18.4       -1.0         -5.4
Employment and administration expenses                        4.02             -11.0              -11.1      +0.1        +0.7     Tax
Net fair value loss on interest rate derivatives              4.03            -12.9               -2.9      -10.0      -340.1     • Prior period impacted by $4.5m of
                                                                                                                                    depreciation recovered following
Total expenses                                                                -71.0            -59.4        -11.6       -19.5       the sale of North City
Profit before income tax                                                       47.3              59.2       -11.9      -20.2
Current tax                                                                    -11.3             -15.6       +4.3       +27.5
Deferred tax                                                                    0.8              +4.7        -3.9       -81.9
Profit after tax1 (GAAP2 measure)                                             36.8              48.3        -11.6      -23.9

Note 1 The reported profit has been prepared in accordance with New Zealand Generally Accepted Accounting Practice
(GAAP) and complies with New Zealand Equivalents to International Financial Reporting Standards. The reported profit
information has been extracted from the half-year financial statements which have been the subject of a review by an
independent auditor pursuant to the External Reporting Board’s New Zealand Standard on Review Engagements 2410. Note                      1.04   Rental income
GAAP is a common set of accounting principles, standards and procedures that companies must follow when they compile                      4.02   Interest and finance charges
their financial statements. Kiwi Property’s financial statements comply with New Zealand Equivalents to International Financial
                                                                                                                                          4.03   Management expense ratio
Reporting Standards and other guidance as issued by the External Reporting Board, as appropriate for profit-oriented entities,
and with International Financial Reporting Standards.                                                                                     4.04   FFO

Kiwi Property > Type Presentation Name > Date                                                                                     Kiwi Property half-year 2020 result presentation 48
Interest and finance charges 4.02
30-Sep-19 30-Sep-18 Variance Interest on bank debt
Six months ended $m $m $m % • Reduced due to lower
Interest on bank debt -12.8 -13.2 +0.4 +3.0 interest rates and new bond
Interest on bonds -11.6 -9.4 -2.2 -23.4 issue
Interest expense incurred -24.4 -22.6 -1.8 +8.0
Interest capitalised to Interest on bonds
Sylvia Park 2.8 2.9 -0.1 -3.4 • Increased following the
issuance of our fourth bond
Drury land 2.0 1.1 +0.9 81.8
series in Nov-18
Other properties under development 0.2 0.2 - -
Total capitalised interest 5.0 4.2 +0.8 +19.0
Capitalised interest
Interest and finance charges 4.01 -19.4 -18.4 -1.0 -5.4
• Increased due to full-period
interest capitalisation on our
landholdings at Drury
• Interest capitalisation on
completed developments
(ANZ Raranga and Kmart)
ceased but has been offset
by increased capitalisation
of expenditure on Sylvia
Park galleria
4.01 Profit after tax
4.09 Net finance debt movement
4.10 Finance debt facilities
Kiwi Property > Type Presentation Name > Date Kiwi Property half-year 2020 result presentation 49Management expense ratio (MER) 4.03
30-Sep-19 31-Mar-19 • 30-Sep-19 costs include one-off
Twelve months ended $m $m organisational realignment
expenses
Employment and administration expenses 4.01 20.8 20.9
Less recovered through property management fees -8.3 -8.5
• Asset growth due to new
Net expenses 12.5 12.4
acquisitions and completed
Weighted average assets 3,141.5 2,900.8 developments
Management expense ratio1 (non-GAAP measure) 40 bps 43 bps
Note 1 MER is an alternative non-GAAP measure used by Kiwi Property to assist investors in assessing the Company’s
underlying operating costs. MER is a measure commonly used by real estate entities. MER does not have a standard
meaning prescribed by GAAP and therefore may not be comparable to information presented by other entities. Kiwi
Property determines MER through an annualised calculation, where employment and administration expenses, net of
expenses recovered from tenants, is divided by the weighted average value of its property assets. The reported MER
information has been extracted from the Company's half-year financial statements which have been the subject of a
review by an Independent Auditor pursuant to the External Reporting Board’s New Zealand Standard on Review
Engagements 2410.
4.01 Profit after tax
Kiwi Property > Type Presentation Name > Date Kiwi Property half-year 2020 result presentation 50Funds from operations (FFO) 4.04
30-Sep-19 30-Sep-18 Variance
Six months ended $m $m $m %
Profit after tax 4.01 36.8 48.3 -11.5 -23.8
Adjusted for
Loss/(gain) on disposal of investment properties 4.01 - -0.6 +0.6 +100.0
Net fair value loss on interest rate derivatives 4.01 12.9 2.9 +10.0 +340.1
Straight-lining of fixed rental increases -0.6 -1.4 +0.8 +60.7
Amortisation of tenant incentives and leasing fees 3.6 3.3 +0.3 +9.1
Depreciation recovered on disposal of investment property - 4.5 -4.5 -100.0
Deferred tax expense 4.01 -0.8 -4.7 +3.9 +81.9
Funds from operations (FFO)1 (non-GAAP measure) 4.05 51.9 52.3 -0.4 -0.8
Note 1 FFO is an alternative non-GAAP performance measure used by Kiwi Property to assist investors in assessing the Company’s underlying operating performance and to
determine income available for distribution. FFO is a measure commonly used by real estate entities to describe their underlying and recurring earnings from operations. FFO does
not have a standard meaning prescribed by GAAP and therefore may not be comparable to information presented by other entities. FFO is calculated by Kiwi Property in accordance
with the Voluntary Best Practice Guidelines issued by the Property Council of Australia. The reported FFO information has been extracted from the Company's half-year financial
statements which have been the subject of a review by an Independent Auditor pursuant to the External Reporting Board’s New Zealand Standard on Review Engagements 2410.
4.01 Profit after tax
4.05 Dividends
5.01 Glossary
Kiwi Property > Type Presentation Name > Date Kiwi Property half-year 2020 result presentation 51Dividends 4.05
30-Sep-19 30-Sep-18 30-Sep-19 30-Sep-18
2
Six months ended $m $m cps cps2
Funds from operations (FFO)1 4.04 51.9 52.3 3.605 3.661
Amount retained -1.0 -2.6 -0.08 -0.186
Cash dividend 50.9 49.7 3.525 3.475
Imputation credits 13.0 13.3 0.900 0.930
Gross dividend 63.9 63.0 4.425 4.405
Cash dividend payout ratio to FFO 98% 95%
Note 1 FFO is an alternative non-GAAP performance measure used by Kiwi Property to assist investors in assessing the Company’s underlying operating performance and to
determine income available for distribution. FFO is a measure commonly used by real estate entities to describe their underlying and recurring earnings from operations. FFO does
not have a standard meaning prescribed by GAAP and therefore may not be comparable to information presented by other entities. FFO is calculated by Kiwi Property in accordance
with the Voluntary Best Practice Guidelines issued by the Property Council of Australia. The reported FFO information has been extracted from the Company's half-year financial
statements which have been the subject of a review by an Independent Auditor pursuant to the External Reporting Board’s New Zealand Standard on Review Engagements 2410.
Note 2 Kiwi Property has revised the method it uses to calculate FFO and AFFO cps, and now bases its calculation on the weighted average number of shares (rather than number of
shares entitled to the relevant dividend), in line with accepted market practice (Sep-19: 1,439,278,328 shares, Sep-18: 1,425,451,313). General note Due to the timing of the equity raise,
Kiwi Property’s dividend reinvestment plan (DRP) has been suspended in respect to the FY20 half-year dividend.
4.04 FFO
5.01 Glossary
Kiwi Property > Type Presentation Name > Date Kiwi Property half-year 2020 result presentation 52Adjusted funds from operations (AFFO) 4.06
30-Sep-19 30-Sep-18 variance
Six months ended $m $m $m %
Funds from operations (FFO)1 4.04 51.9 52.3 -0.5 -0.9
Adjusted for
Maintenance capital expenditure -2.5 -2.9 +0.5 +16.9
Tenant incentives and leasing fees -3.2 -5.0 +1.8 +45.8
Adjusted funds from operations (AFFO) (non-GAAP measure)
2
46.2 44.4 +1.8 +4.0
AFFO (cents per share)3 3.21 3.11
Cash dividend payout ratio to AFFO 110% 112%
Note 1 FFO is an alternative non-GAAP performance measure used by Kiwi Property to assist investors in assessing the Company’s underlying operating performance and to
determine income available for distribution. FFO is a measure commonly used by real estate entities to describe their underlying and recurring earnings from operations. FFO does
not have a standard meaning prescribed by GAAP and therefore may not be comparable to information presented by other entities. FFO is calculated by Kiwi Property in accordance
with the Voluntary Best Practice Guidelines issued by the Property Council of Australia. The reported FFO information has been extracted from the Company's half-year financial
statements which have been the subject of a review by an Independent Auditor pursuant to the External Reporting Board’s New Zealand Standard on Review Engagements 2410. Note
2 AFFO is an alternative non-GAAP performance measure used by Kiwi Property. AFFO is a measure used by real estate entities to describe their underlying and recurring cash flows
from operations. Broadly, AFFO adjusts FFO by deducting the cost of lease incentives and leasing fees provided for sustaining and maintaining existing space and annual
maintenance capital expenditure. AFFO does not have a standardised meaning prescribed by GAAP and therefore may not be comparable to information presented by other entities.
AFFO is calculated by Kiwi Property in accordance with the Voluntary Best Practice Guidelines issued by the Property Council of Australia. Note 3 Calculated using the weighted
average number of shares for the period.
4.04 FFO
4.05 Dividends
5.01 Glossary
Kiwi Property > Type Presentation Name > Date Kiwi Property half-year 2020 result presentation 53Balance sheet 4.07
30-Sep-19 31-Mar-19 Movement • Investment properties and
As at $m $m $m % gearing increased due to:
Investment properties 4.08 3,330.0 3,207.4 +122.6 +3.8 • Acquisition of properties
Cash 4.09 11.1 9.9 +1.2 +12.1 adjacent to Sylvia Park
Other assets 15.0 19.1 -4.1 -21.5
• Capital expenditure,
predominantly on the Sylvia
Total assets 3,356.1 3,236.4 +119.7 +3.7 Park galleria level and south
Finance debt 4.09 1,100.7 1,001.7 +99.0 +9.9 carpark
Deferred tax liabilities 87.7 88.5 -0.8 -1.0
Other liabilities 112.2 95.3 +16.9 +17.7
Total liabilities 1,300.6 1,185.5 +115.1 +9.7
Total equity 2,055.5 2,050.9 +4.5 +0.2
Total equity and liabilities 3,356.1 3,236.4 +119.6 +3.7
Gearing ratio (requirement Type Presentation Name > Date Kiwi Property half-year 2020 result presentation 54Investment properties movement ($m) 4.08
3,500
3,400 +$3.4 +$6.1
+$75.8 +$5.8 +$6.0
3,300
+$25.5
3,200
3,100
3,000
2,900 =$3,330.0
+$3,207.4
2,800
2,700
2,600
2,500
Retail assets
Mixed-use assets
Mar-19
NZ IFRS 16 Right-of-use assets
Acquisition: Sylvia Park adjoining
Sylvia Park
Sep-19
Office assets
as at
as at
Capex:
Capex:
Capex:
(excl SP)
Capex:
4.07 Balance sheet
Kiwi Property > Type Presentation Name > Date Kiwi Property half-year 2020 result presentation 55Net finance debt movement ($m) 4.09
As at 30-Sep-19 31-Mar-19
Bank debt 625.5 527.0
Bonds 475.2 474.7
Cash on deposit -11.1 -9.9
Net finance debt 1,089.6 991.8
1,200
+$88.9 +$32.2 +$18.7
1,100
1,000
+$18.8 +$12.8 +$25.5
900
800 -$99.1
$1,089.6
700 $991.8
600
500
400
Tax and other
Net finance debt Sep-19
Net finance debt Mar-19
Acquisition of investment
Investment/development
Dividends
Employment/admin
Interest and finance
Net rental income
expenses
charges
expenditure
properties
4.07 Balance sheet
4.10 Finance debt facilities
Kiwi Property > Type Presentation Name > Date Kiwi Property half-year 2020 result presentation 56Finance debt facilities ($m) 4.10
Debt maturity profile Debt sources
as at 30-Sep-19 $m %
FY20 11%
FY21 $52.5 $74.0 $80.0 $33.0 $53.0 292 22
FY22 $35.0 $34.0 $125.0 194 15 37% 14%
FY23 $32.5 $25.0 $33.0 $32.5 123 10
FY24 $27.5 $20.0 $100.0 $27.5 $125.0 300 23
FY25 $31.5 $47.0 $56.0 $31.5 $125.0 291 22 13%
FY26 $100.0 100 8
9% 8%
Total facilities 1,300 100 8%
Facilities drawn 1,100.5 85
Undrawn facilities 199.5 15
Key: ANZ BNZ ` CBA CCB HSBC Westpac Bonds
4.09 Net finance debt movement
4.11 Post balance date finance debt facilities
4.12 Capital management metrics
Kiwi Property > Type Presentation Name > Date Kiwi Property half-year 2020 result presentation 57Capital management metrics 4.11 Finance debt metrics as at 30-Sep-19 31-Mar-19 Weighted average term to maturity 3.3 years 3.2 years Weighted average interest rate (Incl. of bonds, active interest rate derivatives, margins and line fees) 4.52% 4.80% Covenants – gearing as at 30-Sep-19 31-Mar-19 Gearing (must be 2.25 times) calculated as net rental income / net interest expense 3.79 3.94 Credit ratings – S&P Global Ratings1 30-Sep-19 31-Mar-19 Corporate BBB (stable) BBB (stable) Fixed-rate bonds BBB+ BBB+ Note 1 Further information about S&P Global Ratings’ credit rating scale is available at standardandpoors.com. A rating is not a recommendation by any rating organisation to buy, sell or hold Kiwi Property securities. The rating is current as at the date stated in this presentation and may be subject to suspension, revision or withdrawal at any time by S&P Global Ratings. Kiwi Property > Type Presentation Name > Date Kiwi Property half-year 2020 result presentation 58
Fixed-rate debt profile                                                                                                                    4.12

Fixed-rate profile (inclusive of bonds on issue Sep-19: $475 million, Mar-19: $475 million)   30-Sep-19     31-Mar-19

Percentage of drawn finance debt at fixed rates                                                    73%           80%
Weighted average interest rate of active fixed-rate debt (excl. fees and margins)                3.40%         3.40%
Weighted average term to maturity of active fixed-rate debt                                   3.4 years     3.9 years

 Fixed-rate debt maturity profile
   900                                                                                                                                                           8%

   800
                                                                                                                                                                 7%
   700

   600                                                                                                                                                           6%

   500
                                                                                                                                                                 5%
   400

   300                                                                                                                                                           4%

   200
                                                                                                                                                                 3%
   100

      0                                                                                                                                                          2%
                 FY20                  FY21                  FY22                  FY23              FY24                  FY25                  FY26

                                          Face value of active hedges (including bonds) ($m) (LHS)
                                          Weighted average interest rate of fixed-rate debt (excl. fees and margins) (%) (RHS)

Kiwi Property > Type Presentation Name > Date                                                                           Kiwi Property half-year 2020 result presentation 59
You can also read