The PAS Group Limited - FY2015 Results Briefing - 28 August 2015
←
→
Page content transcription
If your browser does not render page correctly, please read the page content below
The PAS Group Limited – FY2015 Results Briefing
28 August 2015
Agenda

 •   Overview – Eric Morris (CEO)

 •   FY2015 Results Analysis – Matthew Durbin (CFO & COO)

 •   Strategy and Outlook – Eric Morris (CEO)

 •   Appendices

                                            2
Overview

FY2015 Results Summary
Financial Summary (i) Operational Summary
• Sales of $253.2 million up 3.1% (H2 up 9.7%) • New store roll-out on track: 44 new stores opened, 275
Retail sales up 10.4% (H2 up 11.1%) retail sites at 30 June 2015
Wholesale sales down 5.0% (H2 up 8.1%) • Strong growth in loyalty program: membership up 82% to
Online sales up 57.1% 474,900 since 30 June 2014, an increase of 213,900
• Underlying EBITDA of $20.2 million in line with trading • Strong 2nd half performance for Black Pepper and Review
update of 15th May 2015 • Strong 2nd half growth in Wholesale driven by Designworks
• Underlying NPAT of $8.8 million (H2 $5.5m) sports division and licensed sales
• Underlying EPS of 6.4 cents per share (H2 4.0 cents per • New sports category licenses signed for Dunlop and
share) Slazenger brands
• Net cash of $12.5 million an increase of $12.0m over the • Acquisition of White Runway business completed in July
year, No debt 2015 adding a fast growing online business in the occasion
wear and bridal party segment
• Total full year dividends of 5.0 cents per share fully franked,
funded from free cash flow (payout ratio of 78%)
Underlying (i) FY2015 FY2014
• The FY2015 result was affected by the previously reported
Sales $253.2 million $245.5 million
impact of reduced Target private label and the Metalicus
performance EBITDA $20.2 million $31.7 million
• Statutory loss of $31.9 million impacted by the one-off, non
cash revaluation of the goodwill, brand name and fixed NPAT $8.8 million $17.2 million
assets in Metalicus
(i) See Underlying to Statutory Income Statement reconciliation on page 23
4
Retail Sales

• Retail sales grew 10.4% year on year to $143.1m
                                                                  FY2014 to FY2015 Retail Sales Bridge ($ million)
• Growth due to impact of 44 new stores opened in
  FY2015 and annualisation impact of 36 new stores                                           8.6
  opened in FY2014

• Online sales grew 57.1% in addition to the 60.6% growth                                               (2.4)

  achieved in FY2014                                                                                                          143.1
                                                                                 12.5
                                                                                                                     (5.2)
• Growing customer loyalty program, loyalty sales
  represent 69% of total retail sales

• LFL retail sales down 0.9% excluding Metalicus (down
  4.1% including Metalicus)
                                                                     129.6
• The LFL result was impacted by the performance of Myer
  Concessions

• June LFL in Review was affected by a lower level of
  clearance product, with margin well up for the period
                                                                  FY2014 Net New Stores Annualised     Closed    LFL Growth FY2015 Net
• Performance of Metalicus Airport stores encouraging,               Sales                Stores                               Sales
  with an additional site to open in Sydney Virgin terminal
  in September

                                                              5
Store Portfolio
Total Retail Sites by Brand • 44 new retail sites opened in FY2015
Black Pepper: 28 stores
FY2014 Opened Closed FY2015
Review: 6 stores, 5 concessions
Black Pepper 96 28 (3) 121 Metalicus: 5 stores (including 1 airport and 1 outlet store)
Review 93 11 - 104 • 40 retail sites refurbished or refreshed with 31 planned for FY2016
Metalicus 44 5 (1) 48 including investment in traffic counters in key doors
Other 2 - - 2 • Successful new Black Pepper large format store concept opened in
Woden with an up-weighted fit-out and expanded full brand
Total Retail Sites 235 44 (4) 275
portfolio including Black Pepper, Extra Pepper, Equus and Yarra Trail
• Opportunity to open or upgrade 10-15 more larger format Black
Pepper stores over time
Store Roll-Out Trajectory
• Rigorous approach to store portfolio management
Potential
Forecast FY2015 To Open FY2016f
275
Closures*
235 Black Pepper 121 24 (3) 142
206
185
171 Review 104 6 (6) 104
128
111
80
Metalicus 48 2 (6) 44
48
11
Other 2 - (2) 0
8
FY05A FY06A FY07A FY08A FY09A FY10A FY11A FY12A FY13A FY14A FY15A
Total Retail Sites 275 32 (17) 290
Black Pepper Review Metalicus Other
* Stores which may close at lease expiry subject to rent negotiations with Landlords
6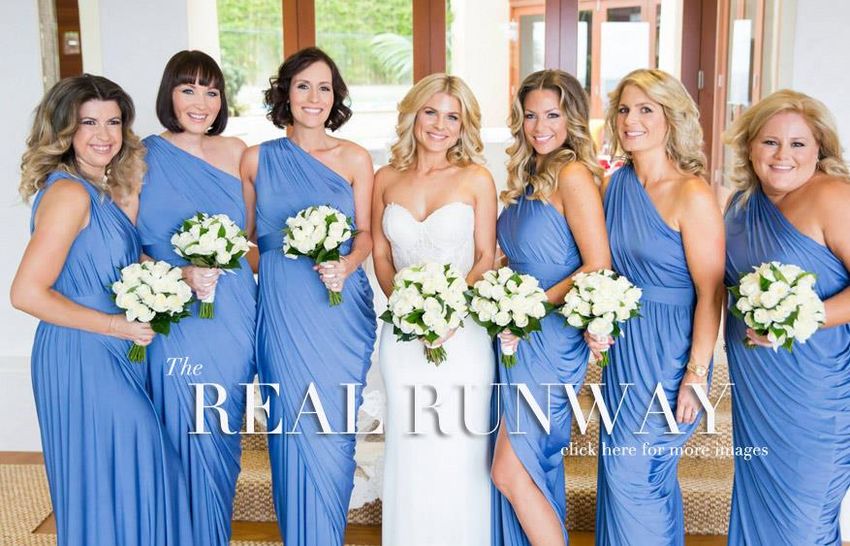
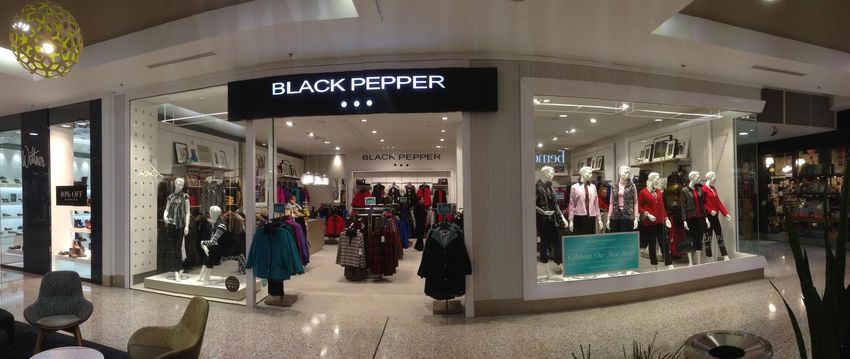
Black Pepper - Woden

                       7
Online

• Online sales up 57.1% in addition to the 60.6% growth                 Online Growth Rates (FY2015 vs. FY2014)
  achieved in FY2014 and represents 7.3% of retail sales in
  Review and Metalicus in FY2015 up from 4.9% in FY2014
                                                                                                                            67%
• Black Pepper online store continues to be one of the top
                                                                                            40%                     36%
  performing Black Pepper stores since its successful launch                      29%

• Online and digital continues driving sales growth, consumer
  insights, consumer communication and traffic to retail stores                     Site Visits                    Revenue Growth
                                                                                                  Metalicus       Review
• “Click and Collect” successfully rolled out to all Review and
  Metalicus stores in H2 FY2015
                                                                        Metalicus and Review Online Stores
• Dedicated online Review store in Singapore launched in Q4
  FY2015

• “Store-to-Door” trial successfully launched in 17 stores across
  Review and Metalicus with planned roll out to all stores in H1
  FY2016, including selected Black Pepper stores

• New initiatives planned for FY2016 include: “Floor-to-Door”,
  front end update to online stores including enhanced mobile
  capability, enhanced search, checkout optimisation and
  improved site navigation, key partner “Drop-Ship”
                                                                    8
Online – White Runway
• In July 2015 acquired White Runway, an online led business in
the growing occasion-wear sector
• White Runway offers ready to wear and made to measure
bridal party, mother of the bride and occasion wear dresses
• In FY2015 revenue grew 100% on the prior year to $2.5 million
High margin business
• Currently operates showrooms in Sydney, Melbourne and a
New York pop-up store offering customers personalised styling
and fitting services for the made to measure business
• Complimentary with existing business
• Significant opportunities for growth in White Runway through
geographic expansion in Australia and internationally and
synergies with our existing business
• The acquisition comprises three tranches, the first of which
was funded from available cash. The subsequent two
payments are linked to the performance of White Runway and
are payable in FY2017 and FY2019 respectively
9
Customer Loyalty & Communication
Overview Loyalty Program Members (‘000)
• Strong growth in loyalty programs continues, providing 250.0
valuable data for targeted customer communications:
Review up c. 1,900 members per week to 208,600 209
Metalicus up c. 675 members per week to 156,700 200.0
Launched the Black Pepper loyalty program in October 2014,
membership up by c. 2,000 members per week to 109,500 (i)
157
• Strong driver of sales: 80% of Metalicus, 64% of Review, 150.0
55% of Black Pepper retail sales are associated with the 122
loyalty program 108 110
100.0
• Strong customer engagement: 27% open rates on email
marketing
50.0
• Utilising loyalty data provides a single view of customers 32
which in turn drives frequency and cross shop behaviour
across all channels
0.0
• New initiatives planned in FY2016 include a new mobile
June 2014 June 2015
loyalty app and access to emailed receipts in store
(i) Black Pepper converted from the previous VIP program to the current loyalty program at the end
of September 2014 with c. 32,000 members
10Wholesale, Design & Distribution
• Wholesale sales of $110.1m down 5.0%
Designworks % Product Mix – H1 v H2 FY2015
DESIGNWORKS
H1 FY2015 H2 FY2015
• FY2015 sales down 0.7% ($0.5 million) Licensed -
Licensed -
Owned Sports, 1%
Brand, 4% Sports, 11%
Owned Private Label,
• H1 impacted by the sales decline in Target private label Brand, 2% 15%
Private Label,
• H2 sales up 17.4% driven by the new sports category sales,
24%
growth from new character licenses, new Toys“R”Us Japan
sales and sales from the new supermarket program
Licensed - All
Licensed - All
Other, 71%
Other, 72%
• New growth opportunities in FY2016 from:
Expanded product ranges and distribution in the sports division Designworks Migration from Private Label to Owned / Licensed
Additional sports category licenses signed for Dunlop and Brands Largely Complete
Slazenger brands 2% 4% 3%
New character licenses signed including: Hello Kitty, Star Wars,
Disney Teenage Mutant Ninja Turtles, Fireman Sam and Angelina 47% 51%
79%
Ballerina
51%
• Strong pipeline of new license opportunities attracted by 45%
18% *
design capability, quality and supply chain speed to market FY2013 FY2014 FY2015
Private Label Licenced & Sport Brand Owned Brands
• Business well positioned for growth in FY2016, driven by the
annualisation of the new H2 FY2015 programs * Private Label is now branded product owned by retailer
11Wholesale, Design & Distribution continued…
OTHER WHOLESALE Other Wholesale
• Sales down 12.4% primarily driven by: 41.8
Intentional cannibalisation of wholesale sales due to rollout 36.6
16.2
of new Black Pepper retail stores 14.7
4.5
Reduction in Yarra Trail and Marco Polo independent 3.3
wholesale sales 21.1 18.6
Performance of Metalicus wholesale
FY2014 FY2015
• Decline in Black Pepper wholesale has been lower than Black Pepper Metalicus Other (i)
expected (i) Includes Yarra Trail and Marco Polo
• Strong performance of Yarra Trail in H2 FY2015 continuing Black Pepper Wholesale vs. Retail
into Q1 FY2016
• Myer and David Jones brand rationalization has had a
negligible impact 64% 71%
36% 29%
FY2014 FY2015
Wholesale Retail
12Exchange Rate Overview
• H1 FY2015 average US dollar purchases at c. $0.90
• H2 FY2015 average US dollar purchases at c. $0.86
• H1 FY2016 average US Dollar purchases at c. $0.78 (Review, Breakaway, Metalicus above $0.80)
• Forward US dollar currency requirements for Review, Metalicus and Breakaway for the majority of Q3 FY2016 covered at
levels above c. $0.74
• Designworks currency commitments in place based on firm orders through to end of January 2016. Future currency
requirements and wholesale pricing are determined when firm orders are received
• The 5% tariff reduction From 1st January 2015 on imports continues to bridge the margin gap in H1 FY2016
• A further benefit not forecast is the potential 5% reduction in clothing imports from the proposed China-Australia Free
Trade Agreement
• Negotiations with vendors underway for cost reductions on Autumn/Winter 16 ranges supported by the devaluation of
the RMB. Selective price increases also under review
13FY2015 Results Analysis
Income Statement
Actual Underlying ($ millions) (i) FY2014 FY2015 • Revenue increase of 3.1% driven primarily by the rollout
Revenue from Sales 245.5 253.2 of retail stores and the annualisation of stores opened in
Gross Profit 141.8 143.7 FY2014
Gross Profit Margin (%) 57.8% 56.8% • Ongoing shift from wholesale to retail sales
Cost of Doing Business (CODB) (110.6) (124.3)
• Gross profit margin slightly behind last year, impacted by
CODB (%) 45.1% 49.1% the reduction in the Target private label business and
Other Revenue & Other Gains/Losses 0.5 0.8 Metalicus performance
EBITDA 31.7 20.2 • CODB increase on prior year predominantly due to:
Depreciation & Amortisation (6.1) (6.6) variable property and employment costs associated
EBIT 25.6 13.6 with new stores in FY2015 and full year impact of stores
rolled out in the FY2014
Net Finance Costs (0.2) (0.9)
new infrastructure to support store roll out program
PBT 25.4 12.7 increase in Designworks costs due to the shift to brand
Tax Expense (8.2) (3.9) licenses and new sports infrastructure
listed entity costs not incurred in the prior year
NPAT 17.2 8.8
• Depreciation increase largely due to new store roll out
(i) See Underlying to Statutory Income Statement reconciliation on page 23
15Balance Sheet
Statutory ($ millions) 30 June 2014 30 June 2015 • Zero debt
Cash and Cash Equivalents 0.5 12.5
• Net cash of $12.5 million
Trade and Other Receivables 24.8 20.7
• Trade and other receivables reduction due to
Inventory 22.8 26.6 the reduction of Black Pepper wholesale sales
Property, Plant and Equipment 12.0 11.0 and the performance of Metalicus
Deferred Tax Assets 13.3 9.1 • Inventory increase due to the acquisition of new
sports equipment category
Goodwill & Other Intangible Assets 103.5 65.3
Other Assets 6.6 8.6
• Property, plant and equipment reduction due to
the impairment of the Metalicus assets, partially
Total Assets 183.5 153.8
offset by the retail store rollout and the refresh
Trade and Other Payables 11.9 16.3 and refurbishment of some existing stores
Other Liabilities 14.0 12.2 • Goodwill and other intangible assets include
impairment of Metalicus goodwill and brand
Total Liabilities 25.9 28.5
name
Net Assets 157.6 125.3
• Trade and other payables up, due to the timing
of supplier payments
16Cash Flow Statement
Statutory ($ millions) FY2014 FY2015
EBITDA 28.6 20.2
• Positive net cash flow and high cash conversion
Movement in Working Capital (4.2) 4.2 resulting from:
Movement in Trade & Other Receivables 2.1 4.1 lower trade receivables due to wholesale sales
Movement in Inventories (2.7) (3.9) reduction and timing of payments
Movement in Trade & Other Payables (3.6) 4.0 change in other operating cash flows due to timing
Other Operating Cash Flows 1.6 (0.3) of prepayments and a reduction of supplier
deposits
Cash Flow Conversion (%) (i) 90.9% 119.3%
effective cash flow management
Net cash flow before financing activities and tax 26.0 24.1
• Capital expenditure increased due to:
Capital Expenditure (5.9) (6.3)
increased number of new stores rolled out
Net cash flow before financing activities and tax 20.1 17.8
increased investment in targeted refurbishments
Income Tax Payments (2.8) (2.4)
implementation of a new merchandise planning
Net Interest (12.7) (0.8) system
Proceeds from Issue of Shares 120.5 -
Repayment of Borrowings (96.0) -
Offer Costs (7.2) -
Funding of Minority Roll Up Transaction (10.0) -
Corporate Reorganisation (9.4) -
Dividends Paid (FY2014 Pre-IPO dividend) (22.0) (2.6)
Net Cash Flow (19.5) 12.0 (i) Cash flow conversion defined as Net cash flow from operating activities
before financing activities and tax, divided by EBITDA
17Sales by Brand and Segment
Actual Underlying ($ millions) FY2014 FY2015
• Challenging trading conditions and low consumer
Retail
sentiment adversely affected sales in retail
Black Pepper 36.9 46.5
Review 64.4 70.4 • Retail revenue increased in Black Pepper and
Metalicus 27.6 25.3 Review due to the roll out of new stores and the
Other 0.7 0.9 annualisation impact of stores opened in the 2nd
Total Retail Sales 129.6 143.1 half of the prior year
Wholesale
• Concessions performance in Myer impacted Review
Black Pepper 21.1 18.5
and Metalicus
Metalicus 4.5 3.4
Designworks 74.1 73.5 • Metalicus recovery slower than expected
Other 16.2 14.7
• Wholesale revenue impacted by the accelerated
Wholesale Sales 115.9 110.1
reduction in sales of Target private label in
Total Sales 245.5 253.2
Designworks and some cannibalisation of Black
Retail Sales % of Total Sales 53% 57%
Pepper due to new store openings
Wholesale Sales % of Total Sales 47% 43%
Retail Sales Growth (%) 13.0% 10.4% • Strong margin in Review in July due to limited sale
LFL Sales Growth (%) (i) 3.1% (3.9%) inventory. Margin strength has continued into Q1
Wholesale Sales Growth (%) (1.5%) (5.0%)
(i) LFL Sales Growth excludes the performance of outlet stores
18Earnings by Segment
Actual Underlying ($ millions) FY2014 FY2015
• Retail underlying EBITDA below prior year due
EBITDA
to difficult trading conditions in the first half
Retail 18.5 17.6
Margin (%) 14.3% 12.3% • Whilst conditions remained challenging with
Growth (%) 12.8% (4.9%) continued promotional activity, there was a
Wholesale 18.3 9.9 marked improvement in second half trading
Margin (%) 15.8% 9.0% performance
Growth (%) (2.7%) (45.9%)
Unallocated / Corporate (5.1) (7.3) • Wholesale underlying EBITDA below prior year
Total EBITDA 31.7 20.2 due to the accelerated reduction in sales of
Margin (%) 12.9% 8.0% Target private label in Designworks and some
EBIT cannibalisation of Black Pepper due to new
Retail 14.1 12.8 store openings
Margin (%) 10.9% 8.9%
• Unallocated / Corporate underlying EBITDA
Growth (%) 10.2% (9.2%)
increase primarily due to listed entity costs not
Wholesale 18.0 9.8
incurred in the prior year, IT staff previously
Margin (%) 15.4% 8.9%
Growth (%) (3.8%) (45.6%)
capitalised now expensed and the
Unallocated / Corporate (6.5) (9.0) centralisation of the Group’s payroll function
Total EBIT 25.6 13.6
Margin (%) 10.4% 5.4%
19Strategy and Conclusion
Growth Strategy

                           • Expected to grow from current 275 retail sites to 290 by end of FY2016
  1   New Store Roll Out
                           • New store roll out progressing in line with plan

                           • Targeted refurbishments planned for 33 Retail sites in FY2016
 2    Store Enhancement    • Opportunity to create larger format Black Pepper stores with expanded brand portfolio
                           • Continued refresh of concession concepts through FY2016

                           • Annualisation of H2 FY2015 sales and organic growth in Designworks sports division
      Product and Brand
 3                         • New sports categories signed with Slazenger and Dunlop brands
      Extension
                           • Growing licensed business in Designworks with new customer channels

                           • Continue to leverage alliance with UK based global brand owner IBML
                           • Continued growth in licensed product sales with Coles and Woolworths
      Licensing
 4
      Opportunities        • Successful Toys”R”Us Japan relationship for infant and toddlerwear continues
                           • Strong portfolio of licences including Hello Kitty, Star Wars, Marvel, Teenage Mutant Ninja Turtles, Fireman Sam and Angelina
                             Ballerina

                           • “Store-to-Door” and “Floor-to-Door” roll out to all brands planned for FY2016
                           • “Drop-Ship” model being developed to access key retail partners online customer base
 5    Online Growth
                           • Major update of the retail brands website user experience including enhanced mobile compatibility
                           • Growth of White Runway

      Loyalty and          • Continued focus on growing loyalty program to support targeted communication
 6
      Communication        • Mobile loyalty app and in-store emailed receipts for loyalty customers

                           • White Runway online-led occasion-wear business acquired in July 2015
 7    Acquisitions
                           • Continuing to evaluate a number of opportunities

                                                                           21
Conclusion and Outlook
• Retail environment remains challenging but showing improvement, sales for the first 8 weeks of FY2016 in line with
expectations and positive LFL growth
• Growth strategy execution according to plan:
Store roll-out and refurbishment continues
Online and Loyalty strategy driving revenue online and in-store
Designworks continues to win new brand licenses
• Well positioned for FY2016 performance
Positive LFL sales driven by Online growth initiatives, store refurbishments, investment in retail infrastructure, strong product
ranges in Black Pepper, Review and Yarra Trail
Sales from new store rollout program and stores opened in FY2015
New Sports Division growth
Growth from White Runway
Continued focus on operational efficiency
Strong discipline of cost control
• Underlying EBITDA is expected to increase broadly in line with sales growth
• Board maintains dividend policy of 70 – 80% of underlying NPAT
• Strong cash generation with no debt
• A number of acquisition opportunities under review
22Appendices
Appendix A: Statutory to Underlying Reconciliation

Underlying results are reported to give information to shareholders that provides a greater understanding of the performance of The PAS Group Limited and its controlled
entities’ (‘PAS’) operations.
The underlying results represent the statutory profit adjusted for items that are material items of revenue or expense that are unrelated to the underlying performance of
the business (‘significant items’). PAS believes that presenting underlying profit provides a better understanding of its financial performance by facilitating a more
representative comparison of financial performance between financial periods.
                                                              FY2015             FY2015              FY2015              FY2015              FY2014              FY2014               FY2014              FY2014
     ($’millions)
                                                             Revenue             EBITDA               EBIT                NPAT              Revenue              EBITDA                EBIT                NPAT

 Statutory                                                     253.2               20.2               (27.1)              (31.9)              245.5                28.6                 22.5                13.0

 Add back / (deduct) significant items:

     IPO costs (i)                                                -                  -                   -                   -                   -                  2.6                 2.6                  1.8
     Bonus payments relating to IPO (ii)                          -                  -                   -                   -                   -                  0.5                 0.5                  0.3
     Impairment of Metalicus goodwill,
     brand name, property, plant and                              -                  -                 40.7                40.7                  -                   -                    -                   -
     equipment and website (iii)
     Tax consolidation benefit (iv)                               -                  -                   -                   -                   -                   -                    -                 (7.6)

     Financing costs of pre-IPO debt
                                                                  -                  -                   -                   -                   -                   -                    -                  9.6
     structure (v)

 Underlying                                                    253.2               20.2                13.6                8.8                245.5                31.7                 25.6                17.2

(i) $2.6 million of IPO costs recognised as an expense. Total IPO costs were $7.2 million, with $4.6 million (net of tax) recognised in equity and $2.6 million ($1.8 million after tax) expensed in the profit or loss.
(ii) Payment of $0.5 million ($0.3 million after tax) under the Group’s previous long term incentive plan triggered upon the IPO
(iii) Included in the statutory results is a one-off non-cash impairment charge in respect of the carrying value of Metalicus goodwill ($32.0 million), Metalicus brand name ($6.1 million) and Metalicus
property, plant and equipment and website ($2.6 million) following a review of the recoverable amount of these assets during the current period.
(iv) $5.9 million tax benefit recognised on formation of an Australian tax consolidation group upon IPO and $1.7 million in respect of tax losses not previously brought to account.
(v) Add back of interest on shareholder loans $6.2 million, interest on senior debt $4.6 million and amortisation of borrowing costs $1.6 million and write off of unamortised borrowing costs $1.3 million
($9.6 million after tax) in connection with the repayment of shareholder loans and other borrowings at IPO. This provides a comparable post-IPO debt structure.

                                                                                                             24
Appendix B: Underlying Earnings per Share Reconciliation
FY2015 ($’millions) Footnote Underlying
Underlying NPAT (i) 8.8
Number of shares issued at IPO (ii) 136.7 million
Underlying EPS (iii) 6.4 cents per share
(i) Refer to reconciliation in Appendix A
(ii) The number of shares issued at IPO was 136,690,860
(iii) The Underlying EPS (earnings per share) reflects the Underlying NPAT / The number of shares on issue
25Appendix C: Overview of The PAS Group
Key Brands and Operations
Review Metalicus Black Pepper Designworks Other
Gender Female Female Both Both Female
Age 24 – 40 25 – 50 50+ All 40+
Indicative
$60 – $300 $40 – $300 $50 – $150 Various $40 – $300
Price Point
Products Dresses, tops, skirts, knitwear, Dresses, tops, cardigans, jackets, Shirts, tees, polo’s, pants, shorts, Men’s, women’s kids, all apparel Tops, shirts, knitwear, vests,
pants, jackets, coats, accessories skirts, pants, legwear, tops, skirts, jeans, jackets, categories, accessories, license jackets, pants, skirts, dresses
accessories knitwear, dresses product
Daywear, occasion wear,
Daywear, occasion wear,
Range Collections, basics Various Various weekend wear, casual and city
bridesmaid, career
dressing
# of Stores 104 48 121 N/A 2
Brands Various
Black Other
Metalicus Designworks 6%
Review Pepper
12% 29%
% of Group 28% 26%
FY2015
Net Sales
Wholesale Retail
12% Wholesale 6%
29%
Wholesale
Retail
FY2015 Net 100%
Retail
88%
Retail
71%
100%
Wholesale
Sales: Retail vs 94%
Wholesale
Established 1985 1992 1976 1993 Various
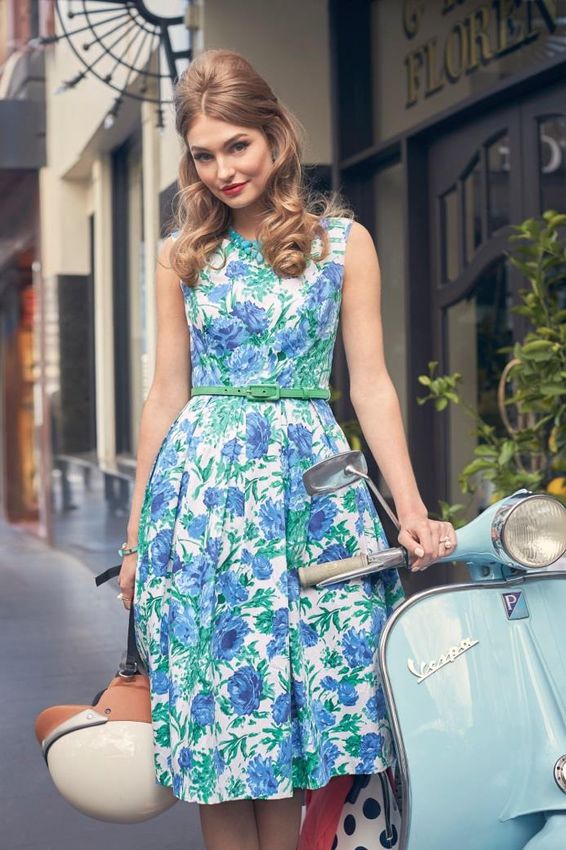
27Brand Overview – Review
• Established in 1985, Review has built a strong and loyal
customer base
• Unique brand positioning offering feminine products inspired
by vintage designs with a modern twist
• Target market is women aged between 24 and 40 years
• Review captures a large share of the value chain through
operating a vertically integrated retailer model
Operates 41 stand alone stores nationally and 63 concessions
within Myer
• Consistently in the top three performing concessions in Myer
• Rapidly growing online channel more around 8% of sales driven
through
• Speed to market and regular store inputs of up to 15 new styles
provided weekly
28Review at a Glance
29Brand Overview – Black Pepper
• Established in 1976 with a distinctive and sustainable position within Sales by Distribution Channel Sales by Brand FY2015
the older demographic FY2015
• Black Pepper brands target a market segment which includes women’s
and men’s leisurewear to a loyal over 50’s customer base Wholesale Other
29%
• Key brands include Black Pepper, Breakaway, Yvonne Black, Equus and 25%
Extra Pepper. All brands have strong brand equity
• Significant intellectual property in designing products targeted to the
older demographic body shape Retail Black
• No major customer reliance with the products delivered through a 71% Pepper
75%
broad distribution network including owned retail stores and
outlet stores
• Currently have 116 retail stores and 5 concessions with significant
growth opportunities based on a proven model. Retail sites target
“strips” and neighbourhood centres with a strong focus on regional
Sales by brand FY14F
areas
Black Pepper is a key focus of the Group’s medium term store rollout
strategy
• High earnings predictability with majority of wholesale sales on indent
basis (ie. committed orders received in advance of production)
• Strong profitability and high earnings to cashflow conversion
• Diversified distribution network with over 650 retail accounts in
Australia and NZ
• Limited competition in an under-served and growing demographic
30Black Pepper at a glance
31Operation Overview – Designworks
Overview Brand Portfolio
• Designworks is a designer, marketer and wholesale supplier of Owned Brands IBML Brands 3rd Party Private Label
owned brands, licensed brands and private label to customers
including K Mart, Big W, Target and Myer
• Talented design team with over 40 designers
• Efficient supply chain enables speed to market
• Deliberate strategy to migrate from private label to licensed
brands
• Australian representative of IBML provides access to new brand
licenses Other Brands Character Licenses
• Growing footwear and accessories business
Sales Demographic FY2015 Sales Mix FY2015
Sport Owned Brand
7% 3%
Private Label
18%
Children
33%
Mens
Ladies
55%
5% License
79%
32Designworks at a glance
33Brand Overview – Metalicus
• Established in 1992, Metalicus has a loyal customer base built
on its distinctive and innovative collection which uses two way
stretch fabrications
• The easy care nature of the fabrication enables the product to
be perfect for travel
Also suitable for maternity wear
• Broad distribution network of 35 owned retail stores, 13 Myer
concessions, a rapidly growing online channel and 250
wholesale accounts
• Minor distribution currently in South Africa and Canada
• Small store footprints and efficient layout drive higher returns Sales by Distribution Channel FY2015
per square metre
• Strong performance for Airport stores with additional locations Wholesale
12%
planned
Retail
88%
34Metalicus at a Glance
35Brand Overview – other Brands
• Established in 1984, Yarra Trail produces high-quality mid-range • Owner and licensor of the Fiorelli and Annapelle brands
fashion products for women aged over 40, mostly via the Yarra
• Fiorelli and Annapelle are licensors only and employ no staff
Trail brand which has strong brand equity
• Established in the 1986 (Fiorelli) and 1994 (Annapelle)
• Yarra Trail distributes its product through 320 retailers including
Myer and David Jones and operates 2 stand-alone stores • Fiorelli is a licensing business which licenses the Fiorelli brand
for bags, accessories and sunglasses
• Disciplined and focussed approach to the targeted consumer
• Annapelle licenses handbags and accessories to 3rd parties
• Product is sold through department stores and independents
• Established in 1972, Marco Polo has an emphasis on knitwear and
co-ordinates focused on the female 45+ consumer
• A wholesale customer base of 200 accounts with long standing
relationships
36Yarra Trail at a Glance
37Disclaimer
Forward looking statements: This presentation contains certain forward looking statements, including with respect to the financial condition, results of operations
and businesses of The PAS Group Limited (‘PGR’) and certain plans and objectives of the management of PGR. Forward looking statements can generally be
identified by the use of words including but not limited to “project”, “foresee”, “objectives”, “plan”, “aim”, “intend”, “anticipate”, “believe”, “estimate”, “may”,
“should”, “will”, “forecast” or similar expressions. Indications of plans, strategies and objectives of management, sales and financial performance are also forward
looking statements.
All such forward looking statements involve known and unknown risks, significant uncertainties, assumptions, contingencies and other factors, many of which are
outside the control of PGR, which may cause the actual results or performance of PGR to be materially different from any future results or performance expressed
or implied by such forward looking statements. Such forward looking statements apply only as of the date of this presentation.
Factors that cause actual results or performance to differ materially include without limitation the following: risks and uncertainties with the Australian, New
Zealand and global economic environment and capital market conditions, the cyclical nature of the retail industry, the level of activity in Australian and New
Zealand retail industries, fluctuation in foreign currency exchange and interest rates, competition, PGR’s relationships with, and the financial condition of, its
suppliers and customers, legislative changes or other changes in the laws which affect PGR’s business, including consumer law, and operational risks. The foregoing
list of important factors and risks is not exhaustive.
No representation or warranty (express or implied) is given or made by any person (including PGR) in relation to the accuracy, likelihood or achievement or
reasonableness of any forward looking statements or the assumptions on which the forward looking statements are based. PGR does not accept responsibility or
liability arising in any way for errors in, omissions from, or information contained in this presentation.
PGR disclaims any obligation or undertaking to release any updates or revisions to the information to reflect any new information or change in expectations or
assumptions after the date of this presentation, except as may be required under securities law.
Disclaimer and third party information: To the fullest extent permitted by law, no representation or warranty (express or implied) is or will be made by any legal or
natural person in relation to the accuracy or completeness of all or part of this document, or any constituent or associated presentation, information or material
(collectively, the Information). The Information may include information derived from public or third party sources that has not been independently verified.
Investment decisions: Nothing contained in the Information constitutes investment, legal, tax or other advice. The Information does not take into account the
investment objectives, financial situation or particular needs of any investor, potential investor or any other person. You should take independent professional
advice before making any investment decision.
All statutory numbers referred to in this presentation have been audited.
Any adjustments made between statutory and pro forma results are made in accordance with ASIC Guidance Statement RG230.
38You can also read