Raglan Housing Study WHAINGAROA-RAGLAN HOUSING AFFORDABILITY PROJECT - Prepared for
←
→
Page content transcription
If your browser does not render page correctly, please read the page content below
Raglan Housing Study

        Prepared for

WHAINGAROA-RAGLAN HOUSING
   AFFORDABILITY PROJECT

         August 2018
Version control: Final Report September 21, 2018

Kelvin Norgrove
Strateg.Ease Ltd

Level 6 AIG Building
41 Shortland St.
Auckland Central 1010

Disclaimer
This report has been prepared for the Whaingaroa-Raglan Housing Affordability Project and Waikato District Council.
Although every effort has been made to ensure the accuracy and integrity of information presented in this report, the
author accepts no liability for any actions taken on the basis of the information or recommendations contained in this
report.

                                                                                                                         2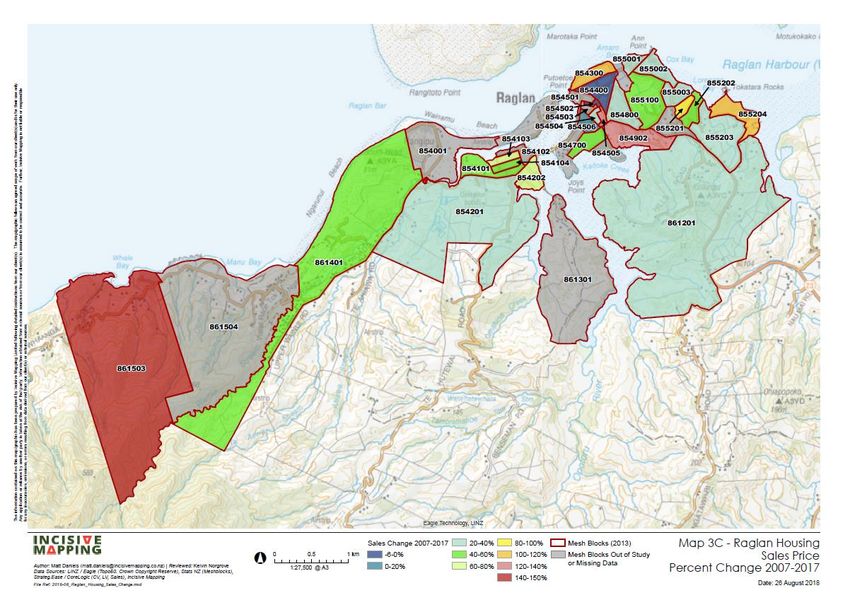
Contents

 Executive summary ....................................................................................................................... 4
1.0    Introduction .......................................................................................................................... 8
 1.1      Purpose .............................................................................................................................. 8
 1.2      Scope ............................................................................................................................... 10
2.0    Raglan’s population and housing ..................................................................................... 11
 2.1      Resident population .......................................................................................................... 11
 2.2      Dwellings and sections ..................................................................................................... 12
 2.3      Holiday homes .................................................................................................................. 13
 2.4      Rental accommodation ..................................................................................................... 14
 2.5      Conclusions ...................................................................................................................... 16
3.0    Values and sales prices of housing and land .................................................................. 18
 3.1      Capital values ................................................................................................................... 18
 3.2      House and section sales prices ........................................................................................ 20
 3.3      Sales as a share of total stock .......................................................................................... 24
 3.4      Conclusions ...................................................................................................................... 25
4.0    Future demand and supply................................................................................................ 26
 4.1      Demand ............................................................................................................................ 26
 4.2      Supply .............................................................................................................................. 27
 4.3      Sufficiency of supply and demand .................................................................................... 28
 4.4      Conclusions ...................................................................................................................... 31
5.0    Overall conclusions and recommendations..................................................................... 32
Attachment A: House and section capital values 2007-18 ....................................................... 35
Attachment B: House and section sales prices 2007-18 .......................................................... 37
Attachment C: Spatial distribution of Raglan Residential Capital Values. .............................. 38
Attachment D: Spatial distribution of Raglan House and section sales prices ...................... 44

                                                                                                                                                3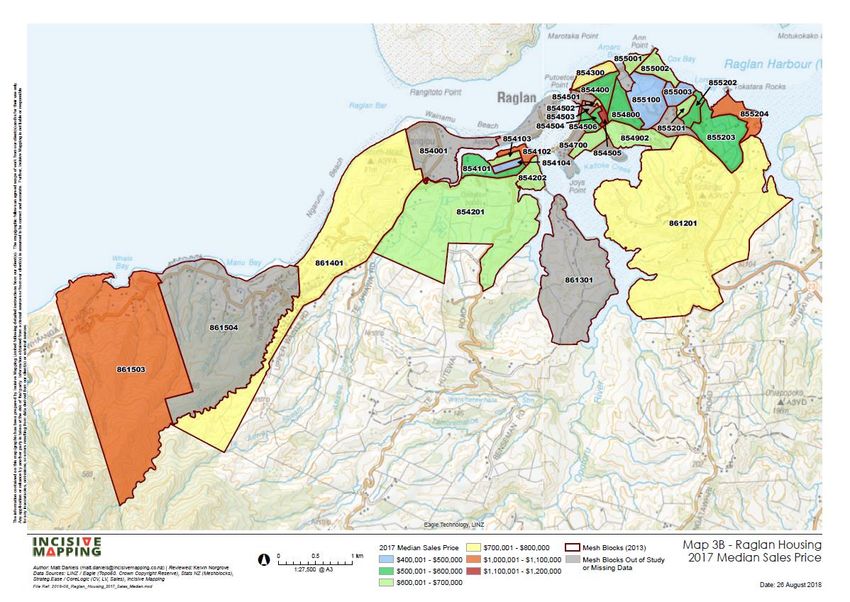
Executive summary
This Raglan Housing Study has been commissioned by the Whaingaroa-Raglan Housing Affordability Project
(WRAP) and Waikato District Council, to provide analysis of housing cost pressures in Raglan. The report is
intended to complement a householder survey being conducted by Waikato University for WRAP in
September 2018, which will provide additional insights on current housing pressures.

Raglan’s resident population is estimated to have increased by 21% over the past decade (2007-17) from
2,670 to 3,240. Corelogic 2018 data for the Raglan study area defined for this report shows there are 1,834
‘residential properties with dwellings’ and 201 ‘vacant residential properties’ in 2018.

Much of the population growth over the past five years has been accommodated without a corresponding
increase in the supply of dwellings. The number of houses increased by 5% while households increased by
more than twice as much (12.6%). The nature of occupancy of houses in Raglan is estimated to comprise
28% holiday homes (of which more than a quarter are listed on Airbnb), up to 22% long-term rentals, and at
least 50% ‘owner-occupied’ dwellings (refer Figure 1).

Figure 1: Estimates of Raglan dwellings 2018

   Total dwellings 1,834
                 Locally owned 1,120

      Owner-
     occupiers            Non-locally owned 715
        > 920

                                          Holiday homes 515
                          Long-term
      Long-term           rental 200
     rental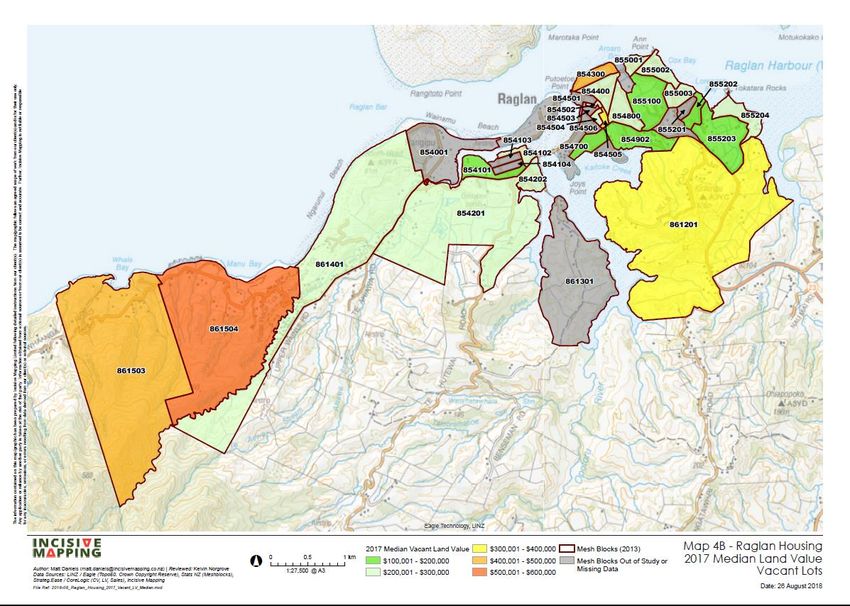
House and section capital values (CVs) and sales prices in Raglan have reached record high levels over the
past three years such that the lower value/entry price stock of houses for first home buyers is now around
$470,000-$500,000 and vacant sections start at $250,000. The 2018 median house value is now $580,000
and the median section value is $355,000.

The number of rental properties listed on TradeMe has declined markedly in recent years and the median
rent has risen by 30% (from $340 to $440 per week) since 2016, exceeding the average rent for the Waikato
District as a whole ($354 per week). The median rent in Raglan is estimated to be around 40% of the median
household income ($55,6001).

Over the medium term (2026) Raglan is projected to face demand for 419 new dwellings, a growth rate of
21%. To meet this demand the annual average volume of 22 new dwellings built in Raglan during 2007-18
would need to at least double over the next eight years. Over the longer term (2046) demand is projected
for an additional 1,284 dwellings, a 63% increase from 2017.

The projected supply of new dwellings able to be built in Raglan over the next 8 years will likely fall short by
over 300 dwellings, as a maximum of only 107 additional dwellings are estimated as feasible to develop over
the period to 2026, from a combination of subdivision, infill and greenfields development. The supply deficit
is due to much of the ‘plan-enabled’ zoned land in greenfield areas not having infrastructure ‘in place’ and
also to commercial feasibility constraints reducing the ability to provide dwellings at prices that demand can
afford. Most greenfields capacity is expected to become available after 2026 and even then will only meet
half of the long-term demand for 1,284 dwellings.

Future Proof projections suggest that the majority of demand from population growth will be for dwellings
that are priced below $440,000, and certainly below $580,000. Assuming a basic house cost of around
$300,000, to buy a new ‘house and site’ at around $500,000 would rely on sections being no more than
$200,000 in at least some parts of the greenfield areas at Rangitahi, Greenslade Rd., Hills Rd. and Te Hutewai
Rd. In 2018 the lowest sales price of sites within these areas was $205,000 in Greenslade Rd. while sites at
Rangitahi are reported to start at $275,000.

Even at $500,000 households would need to have an income of at least $80,500 to afford them (assuming a
20% deposit of $100,000), which is a lot higher than the estimated median household income in Raglan. If a

1
 Based on adjusting the 2013 Census median household income in Raglan of $47,500, by the average growth rate in
household incomes in NZ as a whole over 2013-17.

                                                                                                                   5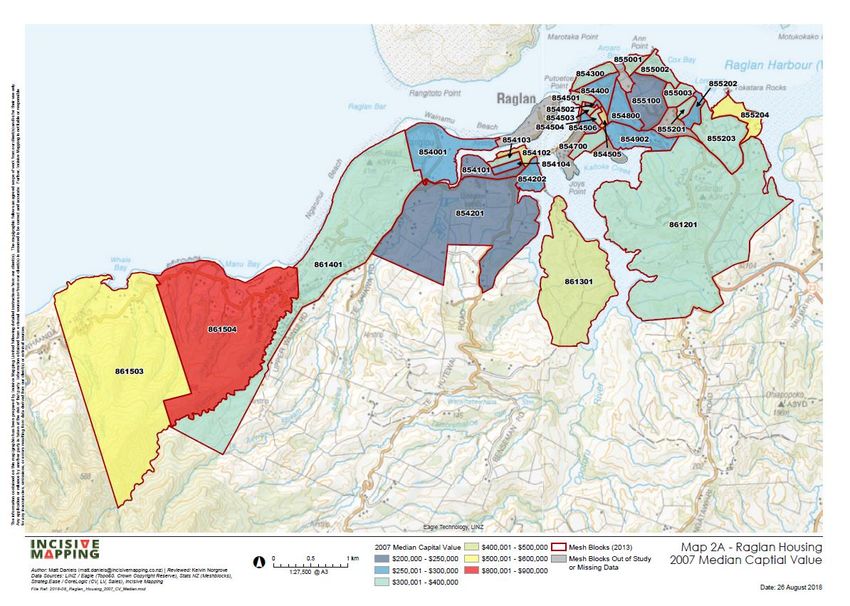
significant number of new sections cannot be created and sold at prices around $200,000 then a large share
of projected medium term demand cannot be met from supply in Raglan’s greenfield areas.

At the heart of the issue for the town is that without adequate new supply, the anticipated strong demand
for lower priced dwellings will be directed to existing stock in the lower quartile and median price bands, and
exert upward pressure on those prices which will effectively thwart demand. The feedback effects on the
Raglan community will include increased demand for rental dwellings, higher rental prices and inability to
accommodate low-income workers and residents within close proximity to the town. In turn, the local
economy would be expected to face labour shortages, particularly in retail and service activities (e.g. shops,
restaurants, accommodation, schools). It will also add pressure to ‘open up’ more rural land for residential
development as a solution to the affordability dilemma.

In the current situation with high house prices and the likelihood of houses in greenfields developments
being priced well above $500,000, the best hope for lower-income groups appears to be if new ‘higher end’
dwellings were purchased by existing or new residents who can use existing equity to upgrade to a new
house. That at least could free up some relatively more affordable existing stock (at prices less than $470-
500,000) for first home buyers or renters (assuming those prices do not continue to also rise as they have
been in recent years).

Even then, it is unlikely that many houses would become available at the low end of the price range, and nor
would market rents for those houses likely be within the affordability threshold of 25-30% of household
income.

The WRAP has highlighted the need for the Raglan community to generate and explore all possible options
to provide affordable houses (based on the Future Proof projections 69% of demand will be for houses in a
range below $300,000 and up to $440,000), and to provide accommodation for those who cannot afford to
buy a stand-alone house. This report is part of the mix and suggests consideration be given to the following
actions:

           1. Investigating the commercial potential for alternative forms of housing that depart from the
               traditional single site/detached dwelling (e.g. multi-units/townhouses which achieve a higher
               density of dwellings per site)
           2. Seeking ways for construction delivery to occur at a faster pace and lower cost (e.g. use of pre-
               fabricated structures)

                                                                                                                  6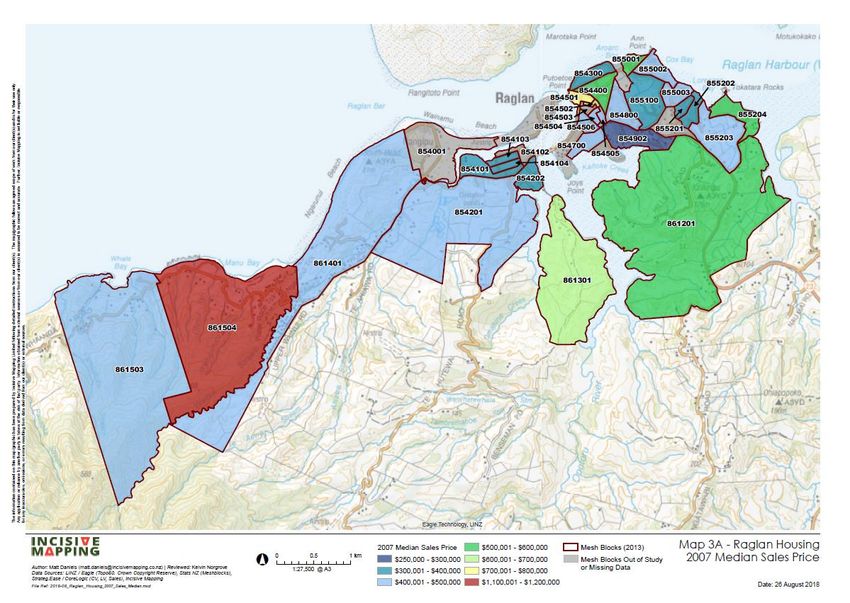
3. Engaging with Waikato District Council to encourage the Proposed Waikato District Plan to
   provide additional capacity for houses in the existing urban area or in greenfields locations
   beyond that identified in the Future Proof 2018 report (which is based on the Operative District
   Plan)
4. Promoting awareness of the expected growth in housing demand to landowners and
   encouraging them to provide low cost forms of residential accommodation on ‘spare land’(e.g.
   through infill or subdivision) and on existing vacant sites
5. Advocacy to the council and large landowners in the greenfields locations to accelerate land
   development and infrastructure provision (which will likely require landowners to enter into
   development agreements with the council on the funding and timing of infrastructure
   provision).

                                                                                                      7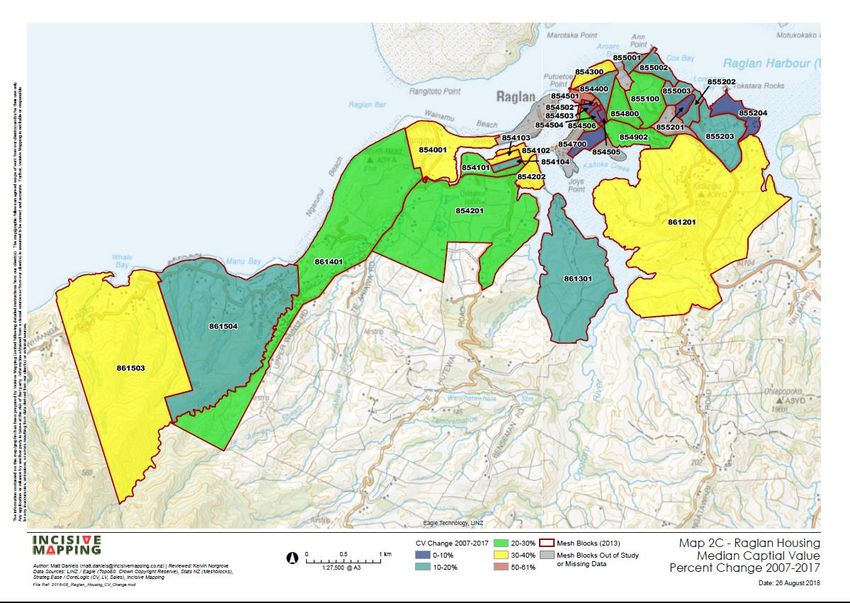
1.0 Introduction
1.1      Purpose

This Raglan Housing Study has been commissioned by the Whaingaroa-Raglan Housing Affordability Project
(WRAP) and Waikato District Council, to provide information and insights on the extent of housing related
pressures in Raglan. The report is intended to complement a householder survey being conducted by
Waikato University for WRAP in September 2018, which will provide additional insights on residents housing
situation and concerns.

For the purposes of this report a Raglan study area is defined as shown in Map 1. The study area comprises
Stetsons 2013 Census mesh blocks as referenced on the map2.

2
  Note the map refers to a small number of meshblocks being “out of study/missing data” (this is for various reasons e.g.
due to the absence or small numbers of houses or sections in some areas) but the summary tables and figures elsewhere
in this report include all dwellings and sections in the study area.

                                                                                                                        8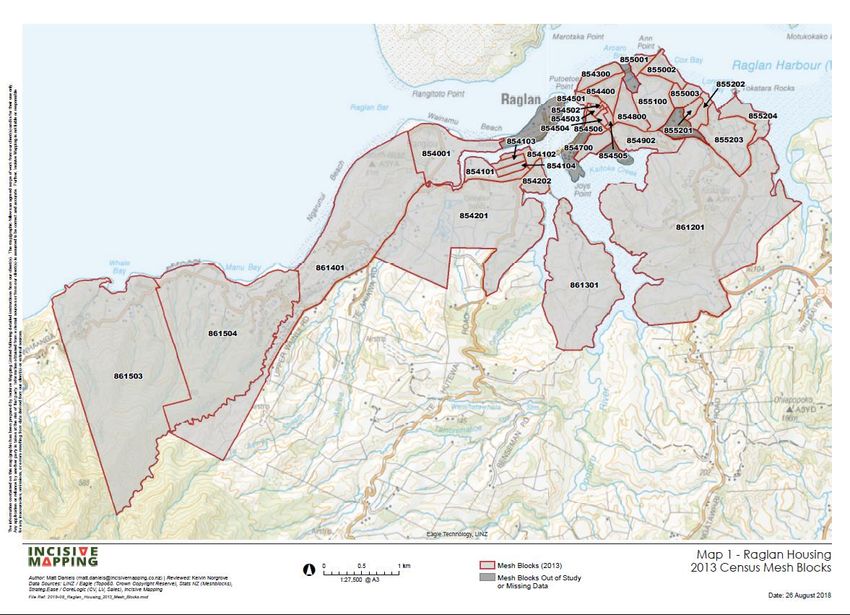
Map 1: Raglan housing ‘study area’

                                     9
1.2       Scope
      This report describes Raglan’s housing situation based on:

      1. Estimates of the number of the supply of residential dwellings and vacant sections, and demand by
          the resident population (owner-occupiers and renters), and holiday home owners
      2. Analysis of trends in house/section capital values and sales prices based on Corelogic data sourced
          for this report
      3. Analysis of rental levels over the past 5-10 years based on TradeMe data sourced for this report
      4. Review of other information available from Waikato District Council (rates addresses; Infometrics
          report on AirBnB)
      5. Projections of future demand for houses and the commercially feasible supply based on Future Proof
          2018 (Housing Development Capacity Assessment for Waikato District).

As the 2013 Census is now well out of date, this report does not provide a profile of Raglan’s population in
terms of the current occupancy of housing by family type, income, ethnicity or age groups. The 2018 NZ
Census results are not due to be released until after March 2019 and local area data may not be available
until September 2019. Whilst the Census results would usually be expected to provide an uptodate official
record of demographic and housing changes since 2013, issues with the 2018 Census’s response rate add
doubt as to how accurate it will be, particularly in relation to small communities3.

3
 E.g. The 2018 Census had a 90% response rate overall (5% less response rate than in 2013) and has generated
concerns about some smaller areas achieving an 80% response rate: http://healthcentral.nz/failed-census-a-preventable-
public-health-policy-disaster/

                                                                                                                     10
2.0 Raglan’s population and housing
2.1 Resident population
The supply of housing in Raglan is subject to competing demand from five different sources or market-types:
permanent residents (owner-occupiers), long-term renters, seasonal workers, holiday home visitors and
short-stay visitors, as depicted below.
Owner-
occupiers
Long-
Holiday
term
homes
Raglan renters
dwellings
demand
Short-stay Seasonal
visitors workers
Raglan’s resident population is estimated to have increased by 21% over the past decade (2007-17) from
2,670 to 3,2404. The population of Waikato District as a whole increased by the same rate, suggesting that
Raglan’s growth has not been particularly exceptional. However, the 2013 NZ Census recorded a resident
population in Raglan of 2,736, indicating that a high rate of increase (18%) in residents has occurred in the
past four years (2013-17). Population projections currently available from Stats NZ are likely to
underestimate growth as they are based on the 2013 Census, but using the ‘high scenario’ as a guide,
Raglan’s population could reach 3,600 by 2028 and close to 4,000 by 2043 (refer Figure 1).
4
StatsNZ estimate.
11Figure 1: Raglan population projections
4500
4000
3500
3000
Population
2500
SNZ Medium
2000
SNZ High
1500
1000
500
0
2007 2013 2018 2023 2028 2033 2038 2043
Source: Stats NZ estimates (to 2017) and projections to 2043
2.2 Dwellings and sections
The 2013 NZ Census put the number of houses in Raglan as 1,173 ‘occupied dwellings’ and 477 ‘unoccupied’
dwellings (total 1,650). Unoccupied dwellings accounted for close to 30% of total dwellings and provides an
indication of the number of baches or holiday homes at that time5.
Corelogic 2018 data for the Raglan study area defined for this report accounts for 1,834 ‘residential
properties with dwellings’ and 201 ‘vacant residential properties’ in 2018 (refer Attachment A for data). The
number of properties with dwellings has increased by an average of 22 properties per annum since 2007,
resulting in a total 240 additional properties (from 1,594) between 2007 and 2018. Over the past two years,
a higher number of additional dwellings has been achieved (26 over 2016-17 and 28 over 2017-18).
The total number of vacant sections has remained between 200-300 each year (going from a total 221 in
2007 to 201 in 2018). Thus, while around a total of up to 240 vacant sections were likely ‘lost’ to new
dwellings being built over the 2007-18 period, a similar number of vacant sections has actually been
sustained throughout the period (i.e. new sections have essentially replaced those taken up throughout the
eleven year period).
The increase in population over 2013-17 appears to have been accommodated without a corresponding
increase in the supply of dwellings. Comparing the Corelogic data on dwellings growth over 2013-2017 with
5
Refer Stats NZ 2013 Census data: Unoccupied dwellings increased by 20% over 2001-13, compared to ‘occupied
dwellings’ at 8%.
12StatsNZ estimate of population growth for the same period suggests that the total number of residential
properties with dwellings increased by 87 or 5% while households increased by more than twice as much
(216 or 12.6%) over this period6.
2.3 Holiday homes
Holiday homes are used by domestic and international visitors for overnight stays during the year, with peak
occupancy during school and public holiday periods (e.g. Christmas/New Year, Easter, Labour weekend).
Non-owners may rent houses or rooms booked through sites such as Airbnb or Bookabach and some will be
using houses otherwise occupied by permanent residents who vacate over peak holiday periods.
Information from WDC’s database of rateable properties has been accessed for the Raglan Ward as a whole,
to estimate the number of holiday homes in 2018. Whilst this data relates to a larger area than the Raglan
study area7, analysis indicates that rates notices for 61% of all residential properties (which will include some
vacant sections) are sent to addresses within Raglan Ward, and 39% are sent to other addresses (e.g. in
Hamilton, Auckland, Bay of Plenty, South Island and overseas).
Applying this ratio to the Corelogic data for the study area, and just focussing on the dwellings component
(i.e. excluding vacant sections) suggests that out of 1,834 houses, around 1,120 would be owned by resident
households within the study area, while 715 houses are owned by residents elsewhere. Some of the locally
owned houses will be investment properties available for rental whereas the 715 non-locally owned
properties will include a mix of holiday homes and investment properties many of which could be available
for long-term or short-term rental.
An Infometrics report8 prepared for the council states that Raglan was the most popular area unit in terms of
the number of Airbnb listings and guest nights in the summer of 2017/2018. Raglan and Te Uku have the
largest number of Airbnb listings in the Waikato District, accounting for 45% of total listings in February
2018. The number of listings and stay nights also increased markedly between the summer months in
2016/17 and the summer in 2017/19. As at Feb. 2018 Raglan had 186 listings (up from 119 in 2017) and Te
6
Households estimated by applying the 2013 average household size of 2.33 to the 2017 population estimate .
7
The Raglan study area defined in this report accounts for the core Raglan settlement within the wider Raglan Ward.
Analysis of Council rating base data for the Ward indicates there are 2,522 rated as Residential, of which 2,091 have a
‘Raglan’ or ‘Whale Bay’ address. That is close enough to the total 2,035 total residential properties (dwellings and vacant
sections) in the Corelogic dataset to suggest the rates address data can be relied on to estimate holiday homes in the
study area.
8
Refer Infometrics ‘Measuring the scale and scope of Airbnb in Waikato District’ April 2018.
13Uku had 108 (up from 79 in 2017)9. Summer was clearly busier than winter, with four times as many nights
booked in January than in July.
Raglan’s spilt between whole houses vs. private rooms (within a house) is higher than for the district as a
whole (at 53% and 46% respectively) with 75% whole houses and 25% rooms within a house. That is 140
whole houses (and 46 other ‘rooms’) were available for Airbnb rental. If it is assumed that the private rooms
are mainly in permanent residents houses, the 140 whole houses is equivalent to one-fifth of the 715 houses
owned by non-residents (and less than 10% of the total stock of houses in Raglan). That still suggests that
the majority of holiday homes are not currently being made available for rent through the summer months
(or at least not via Airbnb). Potentially some of these dwellings (the ‘family-sized’ ones) might otherwise be
available for long-term rental, but that would rely on holiday home owners not wanting access themselves
outside of the summer period.
The Infometrics report suggests the situation should be monitored to see whether continued growth in
Airbnb listings, or a high proportion of whole houses being made available throughout the year, is starting to
encroach on the private rental market.
2.4 Rental accommodation
In 2013 there were 411 households in rental tenure according to the NZ Census, which had increased by 20%
from 342 in 2006. Based on a total number of occupied dwellings of close to 1,180 in 2013, rental
households accounted for over a third of total dwellings.
The total number of rented dwellings in 2018 is difficult to estimate due to the latest Census results not yet
being available (and even then the data may not be reliable). Feedback from property management
agencies in Raglan suggests around 200 houses are under tenancy management (by agencies in Raglan or
Hamilton10). Other rental houses will be self-managed by local owners, which could be in the vicinity of 200
houses if the total hasn’t changed since the 2013 Census.
9
Raglan was by far the most popular area unit, with 14,884 stay unit nights in the 12 months to February 2018. Te Uku
had 6,955 stay unit nights over the same period.
10
Based on personal communication with managers at Ray White and LJ Hooker August 10, 2018 .
14TradeMe data indicates there were 121 listings for rental properties in Raglan in 2013. Whilst annual listings
of places for rent will usually be a sub-set of the total pool of rental supply, this suggests listings accounted
for equivalent to 30% of total ‘renting households’ in 2013. Whilst relatively high levels of listings occurred
up to 2015, it is apparent that the number of rental properties ‘turning over’ to be listed on TradeMe has
declined to be almost negligible (refer Table 1).
Table 1: Raglan houses for rent and rental levels 2013-
18
No. of listings LQ Median UQ
2013 121 270 295 350
2014 171 280 300 350
2015 144 285 320 380
2016 78 290 340 378
2017 14 372 400 450
2018 6 420 440 460
Source: TradeMe data
The TradeMe data also shows that 95% of rental listings over the period as a whole were for stand-alone
houses (rather than units in a block) and of those 80% were for 2-3 bedroom houses, 12% for four or more
rooms, and 8% had one bedroom.
Unsurprisingly weekly rent levels being asked for have increased markedly since 2016 when listings started
to drop off. The very small number of listings in 2018 means there is negligible difference between the
lower and upper quartile rents, but the data suggests that the median rent has risen by 30% (from $340 to
$440) in the past two years (refer Figure 2).
15Figure 2: Raglan house rental levels 2013-18
500
450
400
350
Rent per week $
300
LQ
250
Median
200
UQ
150
100
50
0
2013 2014 2015 2016 2017 2018
Source: TradeMe data
While the asking rents in the table do not provide a guide to the total spread of rents being paid in Raglan,
the median listed rent of $400 in 2017 exceeded the average weekly rent reported for Waikato District as a
whole ($354) in that year11.
2.5 Conclusions
Whilst the 2018 Census results (due to be released from March 2019) will provide an official view on housing
occupancy and relative changes in population and dwellings growth, the Corelogic data suggests that Raglan
has experienced significant demand for housing in the past five years (based on population growth) without
a corresponding increase in the total supply of dwellings.
On the face of it demand for additional dwellings in the high population growth period 2013-17 has
exceeded supply of new dwellings by a factor of 2.5 to 1. To cater for the increased demand a significant
share of new residents have likely acquired or are renting former holiday homes. If all of the 87 new
properties with dwellings recorded over 2013-17 were occupied by residents, it would imply 129 households
are occupying former holiday homes (i.e. equivalent to taking out 27% of the 477 unoccupied dwellings that
existed in 2013). But the estimated 715 non-locally owned houses in the study area suggests there’s still a
11
Refer Future Proof Housing and Business Market Indicators Quarterly Monitoring Report Q3 Sept. 2017.
16lot of holiday homes. Even if all of the 200 rental properties under professional management are attributed
to non-local owners, that would still leave 515 holiday homes (of which 140 are listed on Airbnb). Implying
the total volume of holiday homes is still close to what it was in 2013.
Alternatively some share of new residents could have extended the size of, or replaced pre-existing
dwellings with larger ones, and some of the additional population could also be accounted for by an increase
in average household size (e.g. extended family households occupying spare rooms, or the addition of
‘informal’ accommodation such as cabins or units within existing properties).
Local real estate agents consulted for this report, have advised that house sales in the past few years have
tended to be dominated by owner-occupiers shifting from out of town (around 50% of sales) and from
existing places within Raglan (around 35% of sales), implying low levels of sales to investors or holiday home
buyers. Furthermore, first-home buyers have not been significant and there is a shortage of houses
available for rent.
It is therefore reasonable to expect that the share of permanent homes versus holiday homes will have
increased in Raglan compared to five years ago. The number of rental households in the study area may
have remained steady at around 400 but has likely decreased as a proportion of resident households. The
marked decline in TradeMe listings suggests that rental stock is not turning over much at all12, or being
added to with new listings. Given the lack of supply of long-term rental stock and increases in listed rental
levels since 2016, unmet demand for rental housing in Raglan may also be spilling-over into locations outside
the study area (e.g. Te Uku, Okete, Whaingaroa, Te Mata or Kawhia). A more accurate estimate of the total
number of long-term rental houses may be provided from WRAP’s householder survey in September 2018.
The nature of occupancy of dwellings in Raglan based on the above estimates is summarised in Figure 2.
Whilst the figures are subject to uncertainty, they indicate a composition of the total 1,834 dwellings
including 28% holiday homes, up to 22% long-term rentals, and at least 50% being ‘owner-occupied’.
12
That is, existing tenants appear to be ‘holding onto’ their houses and not moving out at the same frequency as a few
years ago. Alternatively, rental houses may be ‘passed on’ by word of mouth or through other forms of advertising.
17Figure 2: Estimates of Raglan dwellings 2018
Total dwellings 1,834
Locally owned 1,120
Owner-
occupiers Non-locally owned 715
> 920
Holiday homes 515
Long-term
Long-term rental 200
rentalFigure 3: Raglan Capital values dwellings 2007-18
800
700
600
500
Value $000
LQ
400
Median
300
UQ
200
100
0
2007 2008 2009 2010 2011 2012 2013 2014 2015 2016 2017 2018
Figure 4: Raglan Capital values sections 2007-18
600
500
400
Value $000
LQ
300
Median
200 UQ
100
0
2007 2008 2009 2010 2011 2012 2013 2014 2015 2016 2017 2018
Source: Corelogic data
The 2018 median house value is now $580,000 and median section’s $355,000 (refer Attachment A for data).
The median for the more affordable ‘lower quartile’ (LQ) houses is now $470,000 and for LQ vacant sections,
$250,000.
The spatial pattern of median CVs for houses is shown by meshblock in Attachment C. The maps show how
median CVs have changed over the decade 2007-2017 in different locations (refer Maps 2A-2C)13. Changes in
13
Note some meshblocks in each map do not have data for various reasons (e.g. no residential or vacant properties in the
area or not available from Corelogic).
19an individual meshblock’s median CV over time reflects whether land has been improved, subdivided into
smaller parcels, or built on etc. The spatial distribution of CVs also provides a guide to which areas are low or
high value and therefore relatively more or less affordable.
Key points to note are:
In 2007, most locations (meshblocks) were in the lower value bands (below $400,000) including a
mix of both coastal and inland areas. The main exceptions where values were in the $500,000 -
$900,000 range being Whale Bay and Manu Bay
In 2017 several inland areas remained below $400,000 but several coastal areas went over the
$400,000 mark (e.g. Ngarunui Beach; and areas along the coastal Raglan Harbour edge). However in
terms of relative rates of increase on the base 2007 median CVs, the lower value areas generally
experienced higher rates of increase (in the 20-30% or 30-40% bands) compared to those areas
starting from a higher base (probably reflecting in part a greater volume of new house
building/improvements in lower value areas compared to others).
In 2017, inland ‘greenfield’ areas to the south (e.g. Rangitahi; Hills Rd.) entered the $500,000 -
$600,000 median CV range while Whale Bay was in the $700,000 - $800,000 band and Manu Bay in
the $900,000-$1m band. Since 2007 the median CV rose by 30-40% in Whale Bay, and 0-10% in
Manu Bay.
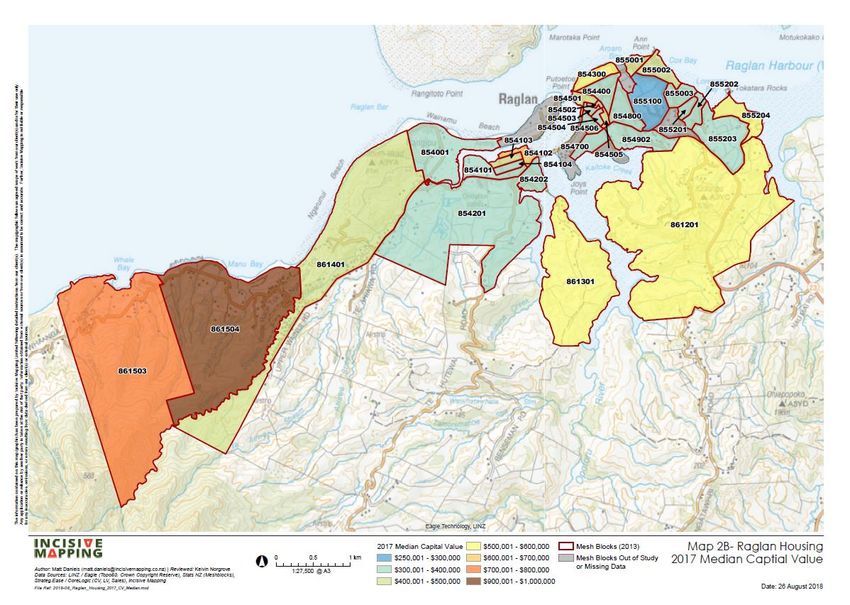
The spatial pattern of median CVs for vacant sections is also shown by meshblock in Attachment C for 2007
and 2017 (refer Maps 4A and 4B). Key points to note are:
In 2007, most meshblock areas were in the lower value bands ($100,000 - $300,000) including a mix
of both coastal areas and inland areas. The main exceptions where values were in the $300,000 -
$650,000 range being Whale Bay and Manu Bay.
In 2017 several inland and coastal areas remained below $300,000 but the inland ‘greenfield’ area to
the south around Hills Rd. went above $300,000 median CV while Whale Bay and Manu Bay entered
the $400,000 -$600,000 range.
3.2 House and section sales prices
The volume of sales of houses or sections in any one year is typically a small percentage of total stock and
prices may diverge from the overall pattern of capital values. The Corelogic data on house and section sales
20prices shows that higher sales prices in houses and sections have coincided with the high rate of population
growth over the past five years. Median dwelling and sections sales prices both increased by 61% over 2013-
18, with a lift-off in prices commencing in 2016 (refer Table 2 and Figures 5 and 6, and Attachment B for the
annual data).
Table 2: Five year changes in Raglan
sales prices
Dwellings LQ Median UQ
2008-13 -10.4% -9.9% -15.8%
2013-18 65.5% 61.0% 57.4%
Sections LQ Median UQ
2008-13 -19.7% -6.1% -26.5%
2013-18 109.8% 61.3% 78.5%
In contrast, the previous five years (2008-13) showed a decline in sales prices and flattening out following
the Global Financial Crisis (when median house prices fell by around 10% and sections prices fell by 6%; refer
Table 2). These five year trends in the direction of price changes were common in many other parts of the
country.
The upper quartile (UQ) of property sales for both sections and dwellings experienced higher rates of price
decrease in the first five-year period and lower rates of uptick in prices in the second period, compared to
lower quartile (LQ) properties. This likely reflects the strength of demand for more affordable housing in
Raglan compared to that at the higher end.
21Figure 5: Raglan dwelling sales prices 2007-18
800
700
600
500
Price $000
LQ
400
Median
300 UQ
200
100
0
2007 2008 2009 2010 2011 2012 2013 2014 2015 2016 2017 2018
Figure 6: Raglan Section sales prices 2007-18
450
400
350
300
Prices $000
250 LQ
Median
200
UQ
150
100
50
0
2007 2008 2009 2010 2011 2012 2013 2014 2015 2016 2017 2018
Source: Corelogic data
Key points to note:
Over the entire 2007-18 period (with 2007 generally being a peak-price period in New Zealand),
Raglan’s median house sales prices have increased by 40%, from $420,000 to $588,000, and median
22vacant section prices increased by 41% from $187,500 to $265,000 (refer Figures 3 and 4 and
Attachment B).
The median sale price of dwellings remained in a fairly tight range of $350-410k, and vacant sections
in a range of $120-175k throughout most of the period (i.e. 2008-15).
The median house sale price in Raglan in July 2018 ($588,000) has fallen compared to 2017 but is
above the medians for Waikato District ($540,000) and Hamilton City ($525,000)14.
The cheapest houses (LQ) being sold recently (in 2017 and 2018) went for not much under $500k
($486,000).
The median vacant section sales price in July 2018 shows prices have fallen compared to 2017 but
the cheapest sections (LQ) are still around $250k.
The significant movement in LQ prices over 2013-18 (65% for dwellings and 110% for sections)
indicates that pressure on the affordability of lower-cost houses and sections has intensified in the
past few years.
The spatial pattern of median sales prices for houses is shown by meshblock in Attachment D for 2007 and
2017 (refer Maps 3A-3C). Key points to note are:
In 2007, most meshblock areas had a sale(s) in the lower to middle median price bands (below
$500,000), whether they were coastal or inland areas. The main exceptions where prices were
higher were in the coastal area of Greenslade Rd. and around Hills Rd. ($500,000 - $600,000) and
Manu Bay (over $1.1m).
In 2017 very few areas had a median sales price below $500,000 and several coastal areas had sales
in the $600,000 - $800,000 price bands (e.g. Ngarunui Beach; and areas along the coastal Raglan
Harbour edge)
In 2017, the inland ‘greenfield’ area to the south at Hills Rd. houses also sold above $700,000 while
the coastal areas of Greenslade Rd., Marine Parade and Whale Bay had sales prices over $1m (NB.
there were no sales in Manu Bay that year).
NB. The spatial pattern of median sales prices for vacant sections is not shown by meshblock in the attached
maps due to several areas having no sales of sections in 2007 or 2017.
14
Refer REINZ August 2018
https://www.reinz.co.nz/Media/Default/Statistic%20Documents/2018/Residential/July/REINZ%20Monthly%20Property%20Report%
20-%20July%202018.pdf
233.3 Sales as a share of total stock
Over 2007-18 yearly house/section sales volumes across Raglan have generally been within a range of 5-8%
of total stock, which is within the normal range for other places in New Zealand. The only exceptions to this
pattern are:
1. In 2015, dwellings sales were 11.3% of total stock (199 sales out of a stock of 1,766 dwellings)
2. Higher rates of sections sales have been occurring over the past three years (2015-18) with rates of
10-14% of total stock (equating to an average 29 sections sold per annum). If demand continues at
similar rates the current stock of 201 vacant sections would be exhausted in seven years (by 2025).
It is important to note that the house sales volumes in each meshblock area tend to be very low in any given
year (e.g. 1-4, and some do not have a sale at all), so the maps in Attachment D should be used as indicative
of the spread or variation in price bands between locations rather than an accurate guide to the sales price
of a ‘typical’ house in each location15.
In order to consider the affordability of housing in Raglan it is appropriate to check whether there is any
significant divergence between capital values (CVs) for the stock of housing as a whole and sales prices for
the relatively much smaller number of properties sold in the same year – as a major difference between CVs
and sales prices may reflect (besides whether the market is taking off or softening) that the properties being
sold are not representative of the range of stock potentially available to future purchasers. For example, if
sales prices in the low quartile are well above the low quartile capital values, it may not necessarily imply
that first home buyers cannot afford entry level housing if such houses were to enter the market).
In fact the data shows that apart from 2007 and in the two years 2015-17, there has not been a major
divergence between the median CV and median sales prices overall (refer Figure 7). During 2008-15 sales
prices were close to CVs, but in the peak years of 2007 and more recently (2016-17), prices have raced ahead
of CVs. In 2017 the gap between the median sales price and CV was more than $200,000 above CV (56%),
but the increase in CVs for 2018 has now brought the median CV across all dwellings in line with the median
sale price in 2017.
15
Whereas the previous section on capital values reflects the relative median values of all of the existing stock of houses
and vacant sections in each year.
24Figure 7: Raglan median dwelling CVs/sales
prices
700,000
600,000
500,000
400,000
CVs
$
300,000
Sales price
200,000
100,000
0
2007
2008
2009
2010
2011
2012
2013
2014
2015
2016
2017
2018
Source: Corelogic data
The equivalent data for the LQ and UQ bands is not shown in Figure 5 but they follow a similar pattern with
the their sales prices tracking close to CVs over 2008-15, but for both quartiles in 2016 and 2017 sales prices
raced ahead of CVs. Now the 2018 LQ houses CV of $470,000 is close to the LQ houses sales price of
$496,400 and the UQ CV of $750,000 is close to the UQ sales price of $709,000.
3.4 Conclusions
The lack of significant divergence between CVs and sale prices over most of the 2007-18 period suggests that
properties being sold are representative of the range of values of the total housing stock in Raglan. A large
gap opened between CVs and sales prices over 2016-17 but CVs have now been adjusted upwards across the
total stock of houses.
House and section values and prices in Raglan have reached record high levels over the past three years such
that the lower value/price entry stock of houses for first home buyers is now around $470,000. It cannot be
said that there is a latent supply of lower value houses which could potentially become available at lower
sales prices than the properties being sold in recent years.
While it remains to be seen whether house prices might continue to adjust downwards over the rest of 2018
or over the next couple of years (compared to 2017), that is likely to depend on the strength of demand and
the adequacy of supply to meet demand in the short to medium term. These factors are assessed in the
next section.
254.0 Future demand and supply
4.1 Demand
Projections of future demand for dwellings in the wider Future Proof sub-region have been relied on here for
assessing future demand and supply of dwellings in Raglan16. The geographic areas defined for the
projections apply to main settlement areas and in Raglan’s case include the Raglan study area in this report,
but also include additional land outside of the area in the Country Living Zone (which consists of properties
with larger sections around the edges of the main urban settlements)17. As the projections cover a larger
area than the study area they allow consideration of the extent to which future demand for dwellings might
be catered for by supply from land on the fringe of the study area.
The Future Proof report suggests the town will face moderate growth in population and dwelling demand
over the next 25+ years, with an estimated demand for a total 2,034 dwellings in 2017 rising to 3,318
dwellings in 2046 (refer Table 3).
Table 3: Projected demand for dwellings in Raglan
2017-26
additional
Demand 2017 2021 2026 2046 dwellings
Raglan 1,316 1,423 1,553 1,971 237
Ngarunui
Beach 718 788 900 1,347 182
Total 2,034 2,211 2,453 3,318 419
Source: Future Proof July 2018.
Over the medium term (2026) this translates to an extra demand for 419 dwellings, a growth rate of 21%.
Over the longer term (2046) demand is projected for an additional 1,284 dwellings, a 63% increase from
2017.
16
Refer Market Economics17 July 2018 Housing Development Capacity Assessment 2017 Future Proof Area –Waikato
District, Hamilton City and Waipa District.
http://www.futureproof.org.nz/file/market-economics-housing-development-capacity-assessment-2017_17-july-2018-
final.pdf
17
Note the total demand of 2,034 dwellings in Table 3 is close to the council’s rating base total of 2,091 residential
properties in the wider Raglan area, but greater than the Corelogic 1,834 ‘properties with dwellings’ in the study area in
2018.
264.2 Supply
The Future Proof Assessment identifies plan enabled capacity18 for a total of 754 further dwellings in the two
defined areas in Raglan, from a combination of subdivision (of existing large sites), infill (using existing vacant
sites), redevelopment (increasing the density of existing sites) and greenfields development (of large blocks
currently zoned for housing). The majority source lies in the greenfields areas, and assumes there are no
infrastructure servicing constraints (refer Table 4). Although the report does not provide details on the
location of greenfield areas, it is presumed to account for capacity at Rangitahi Peninsula and ‘New
Residential Living’ zoned land at Greenslade Rd., Hills Rd. and Te Hutewai Rd., which are also within the
Raglan study area defined for this report.
Table 4: Raglan ‘Plan enabled’ capacity for additional dwellings
Subdivision Infill/Redevelopment Greenfields# Total*
Raglan 97 105 488 497 694.5
Ngarunui Beach 20 21 14 24 60
Total 117 126 502 521 754.5
# The low and high range for Greenfields capacity reflects alternative scenarios of average lot sizes
* The total applies a mid-point to the estimates of Greenfields capacity
Source: Future Proof 2018
In simple volumetric terms the potential supply would be more than enough to cater for projected demand
to 2026, but not in the long-term 2046. However, the report adds that if allowance is made for the
availability of infrastructure (given current planned timing of water/wastewater provision), only a maximum
of 84 additional dwellings could be achieved in the greenfield areas within the next ten years, implying the
combination of subdivision, redevelopment and constrained greenfields capacity is a maximum of 331 by
2026, which is 27% less than the projected demand for 419 additional dwellings. Most greenfields capacity
is available in the outer years 2027-46.
The report further estimates the commercially feasible supply (taking account of land prices, capital values
of existing dwellings and construction costs and sales prices) and concludes a maximum of only 107
additional dwellings would likely be able to be developed by 2026 through a combination of subdivision, infill
and greenfields development (refer Table 5).
18
Plan enabled capacity within Waikato District is based on the Operative District Plan. It does not include allowance for
any increase in capacity which may be enabled under the Proposed District Plan. In any case it is understood that the
Proposed Plan does not include any additional ‘live’ zoned greenfields land in Raglan.
27Table 5 : Commercially feasible dwellings (given infrastructure constraints) -
maximum scenario
2017 2021 2026 2046
Raglan 20 67 69 574
Ngarunui Beach 13 29 38 44
Total 33 96 107 618
Source: Future Proof 2018
The implication is that the commercially achievable supply of dwellings is likely to only meet around a
quarter of demand in Raglan in the next eight years, resulting in a deficit of over 300 dwellings. Additional
supply is dependent on greenfields development and while there is commercially feasible capacity to meet
some future demand most of that capacity is currently constrained by the lack of infrastructure, being timed
to occur after 2026. The long-term commercially feasible 618 dwellings would also only satisfy half of the
projected long-term demand for 1,284 dwellings.
4.3 Sufficiency of supply and demand
The Future Proof report also considers demand for dwellings in different value bands in the district as a
whole, and identifies the shortfall/surplus in each property value band, since that is the soundest indicator
of potential supply shortfall relative to the purchasing power of the community.
Throughout the 2017-46 planning period, demand growth in the district is projected to most heavily occur in
the lower and lower-middle positions in the housing market, with 31% in the lowest band (under $300,000),
and some 38% in the lower middle value band ($300,000 to $440,000). Overall, over four-fifths of the net
increase would be for dwellings in the bands below $580,000. For the district as a whole net sufficiency of
supply (based on yield from different scenarios of commercial feasibility), within these price brackets is
projected to be between 75 per cent to 90 per cent in the medium-term (2026) while there would be a
surplus of properties in the higher value band (above $580,000). The net deficits are largest within the lower
price brackets. The report notes that “it is unlikely that surpluses within the higher price bracket will be able
to play any significant role in meeting demand elsewhere in the price spectrum” (p110).
Applying the Future Proof projections of demand by price band for the district as a whole to Raglan’s
demand for 419 extra dwellings by 2026, implies a need for 69% (290 dwellings) to be priced below $440,000
or a total 335 to be below $580,000.
28The Corelogic data on recent section values and sales prices in the meshblocks which include several of the
greenfield areas shows few sales of sections have taken place in recent years, so the sales prices may not be
a reliable guide to what additional sections would cost. Using the existing land values as an alternative, the
median land value (LV) for vacant sites in 2017 ranged from $180,000 – $360,000 (refer Table 6).
Table 6: Vacant section land values and sales prices 2017 in Raglan 'Greenfield'
areas
Median
Vacant sites
Relevant Land Value Sales price
Greenfield location Meshblock No. ($) ($)
Rangitahi* 861301 na na
Greenslade Rd. (3 sales) 855203 180,000 205,000
Hills Rd.(2 sales) 861201 360,000 617,500
Te Hutewai Rd.(no sales) 854201 279,500 na
Source: Corelogic data
*Corelogic data does not capture sites under development at Rangitahi but recent information suggests sales prices
19
start at $275,000 and average $350,000 .
While the higher median values in Hills Rd. and Te Hutewai Rd. might reflect existing section sizes are
relatively large, the lower end of the range ($180,000) at Greenslade Rd. suggests there are sites there
below the 2017 median vacant section value for all meshblocks in Raglan of $220,000.
If new sections could be created and sold at prices of $200,000 in some parts of the greenfield areas, and
allowing say $300,000 for a basic house to be built20, it would imply final house prices of around $500,000,
which is essentially the same as the current 2018 LQ house sales price ($496,400). That would still require
buyers in Raglan to be willing and able to pay higher prices than the projected demand for290 dwellings to
be priced below $440,000.
Based on estimates from Auckland Council21 and assuming a deposit of 20% and no significant changes in
current interest rates, for a household to afford a $500,000 house they would need to have an income of at
19
https://idealog.co.nz/urban/2018/07/how-rangitahi-planting-new-seed-urban-development-raglan
20
QV Costbuilder indicates that in June 2018 the cost for a standard 150m², three or four bed, one or two bath home, in
the Waikato region is $289,690.
21
Refer Auckland Council 2018 https://www.aucklandcouncil.govt.nz/about-auckland-council/business-in-
auckland/docsoccasionalpapers/who-can-buy-Aucklands-houses-june-2018.pdf . Note the household income and house
price percentiles in Table 6 are Auckland specific and do not apply to Raglan.
29least $80,500 (refer Table 6). To afford a house at the 2018 median sales price in Raglan of $588,000 they
would need an income of close to $97,000.
Table 7: Indicative household income required to afford to buy a house
Whilst uptodate data on household incomes is not available, the median household income in Raglan in the
NZ Census 2013 was reported as $47,500. If that has increased at the same rate as the median income for
New Zealand as a whole over 2013-17 (i.e. 17%) it would now be $55,600. That would imply that the median
household in Raglan could afford houses in the range of $323,000 -$387,000 assuming a 20% deposit. Given
current prices, that also implies that the median household cannot afford a median priced house or even a
lower quartile priced house in Raglan22.
Of course, if a significant number of new sections cannot be created and sold at prices around $500,000 (and
assuming infrastructure provision could be accelerated to allow the land to be developed) then a large share
of medium term demand cannot be met from supply in the greenfield areas.
22
Given that new owner-occupier residents appear to have moved into Raglan and managed to buy houses over
$500,000 in recent years, the median income in Raglan has likely increased to over $55,600. The 2018 Census will
provide more uptodate information on the range of household incomes (e.g. by quartiles), which can be used as a basis
for analysing housing affordability constraints in 2019.
304.4 Conclusions
Based on a direct comparison of projected demand and potential supply, there will be a significant level of
excess demand in Raglan for the foreseeable future. The Future Proof report suggests there would be a
deficit of 312 dwellings in the combined Raglan and Ngarunui Beach areas by 2026 due to commercial
feasibility and infrastructure constraints.
Even if the capacity of land development and construction suppliers in Raglan could generate 419 dwellings
over the next eight years, the projections of feasible supply indicate two other major issues:
1. Lack of infrastructure availability to allow major areas of greenfield land (where most currently plan
enabled capacity lies) to be developed until after 2026
2. Deficits in the commercially feasible supply of dwellings at prices which the majority of demand is
likely to be for (i.e. below $440,000 in 2017 prices).
The Future Proof analysis implies that even if the first point could be resolved, for example by accelerating
development of land already zoned in greenfield areas at Rangitahi, Greenslade Rd., Hills Rd. and Te Hutewai
Rd., the commercially feasible dwellings will tend to be at prices above what most households can afford.
There is also a practical question as to the capability of land development and construction suppliers to
achieve the required volume of sections and houses in short time. The estimate of medium-term demand for
419 extra dwellings by 2026 equates to an average of 52 dwellings per annum. The long-term projected
demand for 1,284 extra dwellings by 2046 implies an average of 44 dwellings per annum. Although the
Future Proof demand projections relate to a larger area than the core Raglan study area they are equivalent
to 2-2.5 times the annual average volume of 22 new dwellings that has been achieved in Raglan during 2007-
18. In other words, the rate of house building in Raglan would need to at least double over the next 8 years
to substantially meet projected demand.
315.0 Overall conclusions and recommendations
An affordability challenge for first home buyers and lower income households has arisen in Raglan,
particularly since 2016, and is likely to get worse on the back of expected growth in demand for at least the
next eight years. At the heart of the issue for the town is that without adequate new supply, the anticipated
strong demand for lower priced dwellings will be directed to existing stock in the lower quartile and median
price bands, and those prices will tend to rise and effectively thwart demand.
The feedback effects on the Raglan community will include increased demand for rental dwellings, higher
rental prices and inability to accommodate low-income workers and residents within close proximity to the
town. It will also add pressure to ‘open up’ more rural land for residential development as a solution to the
affordability dilemma. While some future demand for houses could spillover to existing nearby settlements
(e.g. Te Uku, Te Mata) this could not be significant without increasing the zoned and serviced land supply in
those areas. Without such additional supply, spillover demand will simply shift upward pressure on prices
into those areas.
In the current situation with high house prices and the likelihood of houses in greenfields areas being priced
well above $500,000, the best hope for lower-income groups would be if new ‘higher end’ dwellings were
purchased by existing or new residents who can use their equity to upgrade to a new house. At least if the
zoned greenfields supply in Raglan is able to be developed sooner rather than later, some demand for lower
priced dwellings may be met from existing residents vacating existing stock in those price bands. That could
also help to provide stock for long-term rental, whereas a situation of constrained supply of lower priced
dwellings will restrict the anticipated demand for both owner-occupier housing and rental accommodation.
Growth in Raglan’s visitor population on the back of growth in main metropolitan centres of Auckland and
Hamilton and international visitors will also increase demand for visitor accommodation (both commercial
accommodation and use of ‘holiday homes’) and while there are around 375 holiday homes not currently on
Airbnb, increased demand for short-stay accommodation will also reduce the potential for such houses to be
used for long-term rental.
The WRAP has highlighted the need for the Raglan community to generate and explore all possible options
to provide affordable houses (based on the Future Proof projections they would need to be below $300,000
and up to a maximum of $440,000), and to provide accommodation for those who cannot afford to buy a
32stand-alone house. This report is part of the mix and suggests consideration be given to the following
actions:
1. Investigating the commercial potential for alternative forms of housing that depart from the
traditional single site/detached dwelling (e.g. multi-units/townhouses which achieve a higher
density of dwellings per site)
2. Seeking ways for construction delivery to occur at a faster pace and lower cost (e.g. use of pre-
fabricated structures)
3. Engaging with Waikato District Council to encourage the Proposed Waikato District Plan to
provide additional capacity for houses in the existing urban area or in greenfields locations
beyond that identified in the Future Proof 2018 report (which is based on the Operative District
Plan)
4. Promoting awareness of the expected growth in housing demand to landowners and
encouraging them to provide low cost forms of residential accommodation on ‘spare land’(e.g.
through infill or subdivision) and on existing vacant sites
5. Advocacy to the council and large landowners in the greenfields locations to accelerate land
development and infrastructure provision (which will likely require landowners to enter into
development agreements with the council on the funding and timing of infrastructure
provision).
33ATTACHMENTS
34Attachment A: House and section capital values
2007-18
Table 1: Raglan Dwellings capital values 2007-18 ($)
Dwellings LQ Median UQ
2007 245,000 320,000 430,000
2008 285,000 360,000 500,000
2009 294,000 385,000 535,000
2010 295,000 384,000 535,000
2011 295,000 385,000 540,000
2012 300,000 380,000 520,000
2013 300,000 384,000 520,000
2014 300,000 385,000 520,000
2015 310,000 380,000 510,000
2016 310,000 380,000 510,000
2017 310,000 385,000 510,000
2018 470,000 580,000 750,000
Table 2: Raglan Vacant section capital values 2007-
18 ($)
Sections LQ Median UQ
2007 128,000 201,000 296,000
2008 170,000 220,000 380,000
2009 155,000 205,000 350,000
2010 160,000 211,500 361,250
2011 163,750 215,000 355,000
2012 140,000 185,000 288,750
2013 145,000 191,500 297,000
2014 155,000 190,000 295,250
2015 160,000 200,000 292,500
2016 165,000 215,000 303,750
2017 165,000 220,000 316,250
2018 250,000 355,000 500,000
35You can also read