Studies in Applied Finance - INVESTMENT THESIS FOR INTEL CORPORATION (NYSE: INTC) - Johns Hopkins ...
←
→
Page content transcription
If your browser does not render page correctly, please read the page content below
SAF/No.4/June 2016

          Studies in Applied Finance

            INVESTMENT THESIS FOR
              INTEL CORPORATION
                  (NYSE: INTC)

                                   Vinitha Kumar

Johns Hopkins Institute for Applied Economics,
Global Health, and Study of Business Enterprise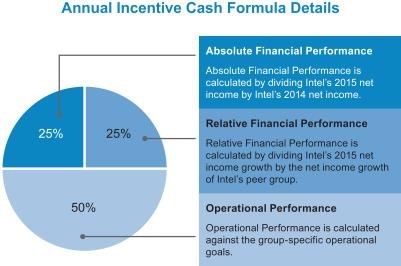
Investment Thesis for Intel Corporation (NYSE: INTC) by Vinitha Kumar

              Investment Thesis for Intel Corporation (NYSE: INTC)
                                             By Vinitha Kumar

Disclaimer: These research reports are primarily student reports for academic purposes and are not
specific recommendations to buy or sell a stock. Potential investors should consult a qualified
investment advisor before making any investment. This study was completed in May 2016.

                                             About the Series
The Studies in Applied Finance series is under the general direction of Prof. Steve H. Hanke, Co-Director
of the Johns Hopkins Institute for Applied Economics, Global Health, and Study of Business Enterprise
(hanke@jhu.edu) and Dr. Hesam Motlagh (hnekoor1@jhu.edu), a Fellow at the Johns Hopkins Institute
for Applied Economics, Global Health, and Study of Business Enterprise. This working paper is one in a
series on applied financial economics, which focuses on company valuations. The authors are mainly
students at the Johns Hopkins University in Baltimore who have conducted their work at the Institute as
undergraduate researchers.

                                            About the Author
Vinitha Kumar is a rising senior at Johns Hopkins University double majoring in Economics and Public
Health Studies. She wrote this paper during her time as an undergraduate researcher for the Institute of
Applied Economics, Global Health, and Study of Business Enterprise in the Spring of 2016. Vinitha will
graduate in May 2017.

                                                  Abstract
This working paper is an in-depth analysis of Intel Corporation. Our analysis examines on the factors that
impact Intel’s underlying business. This economic analysis is then combined with our proprietary, Hanke-
Guttridge Discounted Cash Flow (HG-DCF) model to determine Intel’s financial position. The HG-DCF
model will be presented along-side Monte-Carlo simulations to reveal the distribution of probable free
cash flows and the likelihood of future earnings. In addition to these quantitative factors, we also examine
the compensation plans of Intel’s executives to assess alignment with shareholders. At the conclusion of
this analysis, it is our intention for readers to understand Intel’s business plan and the company’s financial
standing to arrive at a sound investment decision.

                                            Acknowledgments
I thank Professor Steve Hanke, Dr. Hesam Motlagh, Ryan Guttridge, James Shin, whose original model was
adapted for this thesis, and Abigail Biesman for guidance and draft comments.

Keywords: Financial Modelling, Intel Corporation, Discounted Cash Flow, Free Cash Flow, Monte-Carlo
Simulation, Investment Thesis, Management Compensation
JEL codes: C63, G11

                                                      1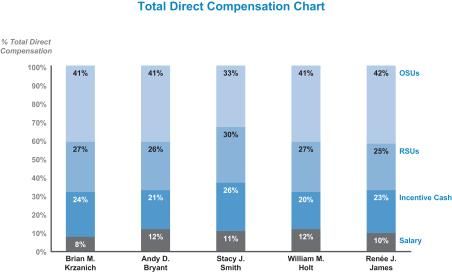
Investment Thesis for Intel Corporation (NYSE: INTC) by Vinitha Kumar

      Rating – Buy – Projected Free Cash Flow per Share: $37.07

           Company Name:                                             Intel Corporation
           Date:                                                     5/11/2016
           Current Price:                                            $30.06
           Fiscal Year End (Current Quarter):                        Dec. 26 (Q2)
           Diluted shares outstanding:                               4.875B1
           Market Cap:                                               143.56B
           Dividend Yield:                                           4.1458%
           Enterprise Value                                          145,844.3M
           Beta:                                                     0.962
           52-week range:                                            24.87-35.59
           2012 EPS                                                  2.13
           2013 EPS                                                  1.89
           2014 EPS                                                  2.31
           2015 EPS (ttm):                                           2.33
           2015 P/E (ttm):                                           12.79
           2016 EPS (P/E)                                            2.4 (12.53x)3
           2017 EPS (P/E)                                            2.58 (11.66x)
           2018 EPS (P/E)                                            2.68 (11.23x)
           Price to Book                                             2.28
           Price to Sales                                            2.50

1
  "Intel Corporation 10-K." SEC. SEC, 2 Feb. 2016. Web. 15 May 2016.
2
  "Intel Corporation": NASDAQ:INTC Quotes & News. Google Finance, n.d. Web. 15 May 2016.
.
3
  Bloomberg Terminal, search  for INTC US Equity, 5/11/2016

                                                    2
Investment Thesis for Intel Corporation (NYSE: INTC) by Vinitha Kumar

Contents
Executive Summary: ................................................................................................................................... 4
Risks and Firm Specific Issues: ................................................................................................................. 4
Company Overview: ................................................................................................................................... 5
   2016 Overview: ......................................................................................................................................... 6
   2015 Overview: ......................................................................................................................................... 6
   2014 Overview: ......................................................................................................................................... 6
   Goodwill: .................................................................................................................................................. 6
   Long-term Asset Turnover and Useful Life: ........................................................................................... 7
   Facilities: .................................................................................................................................................. 8
   Credit: ....................................................................................................................................................... 8
Model of Company: .................................................................................................................................... 9
Results and Discussion of Model: ............................................................................................................ 10
   Execution Risk: ...................................................................................................................................... 12
   Analysts’ Recommendations:................................................................................................................. 12
Proxy Report: ............................................................................................................................................ 13
   Management Compensation: ................................................................................................................. 13
       Base Salary and Cash Bonuses:.......................................................................................................... 13
       Long-term Incentive Compensation: ................................................................................................... 14
       Total Compensation: ........................................................................................................................... 14
   Current Executive Committee: .............................................................................................................. 16
   Current Board of Directors and Relative Compensation: .................................................................... 16
   Compensation Committee: ..................................................................................................................... 16
   Companies in Technology Peer Group: ................................................................................................ 16
   Companies in S&P 100 Peer Group:..................................................................................................... 17
   Dividend and Share History: ................................................................................................................. 17
   Multiples:................................................................................................................................................ 19
   Insider Transaction Information: ......................................................................................................... 19
Conclusion: ................................................................................................................................................ 20

*Information in thesis is in tandem with accompanying spreadsheet and data

                                                                                3
Investment Thesis for Intel Corporation (NYSE: INTC) by Vinitha Kumar
Executive Summary:
Intel Corporation (NYSE: INTC) specializes in designing and manufacturing advanced integrated
digital technology platforms. These platforms consist of a microprocessor and a chipset, as well
as optional additional technology and services that could enhance the platform. INTC sells
platforms to various manufacturers and industries, including original equipment manufacturers,
original design manufacturers, and communications industries. INTC’s platforms are used in
notebooks, 2 in 1 systems, desktops, phones, servers, tablets, and retail devices4. The market
currently prices INTC at $30.06, which lies in the middle of its 52-week range ($24.87-$35.59).
This price is lower than the probable free cash flow per share ($37.07) determined through the
Hanke-Guttridge Discounted Cash Flow (HG-DCF) model. Analyst’s 12-month target price is
$35.52, which is also higher than the current market price.5 My recommendation for INTC is to
buy.
During 2015, INTC saw decreased earnings and compressed margins. The Company is now
restructuring to closer match the needs of customers by shifting its concentration on personal
computers (PC) to connected computing devices6. As such, we anticipate that INTC will see a
mean reversion in their margins, asset turnover ratios, and revenues, which will free up cash flow
to shareholders. As INTC restructures, the Company still believes the PC supply chain is healthy.
When completing the HG-DCF, it is important to think of how the financial statements are
connected. The HG-DCF incorporates both the balance sheet and income statement of a company,
and our investment thesis centers on the expanding the balance sheet translating into growth that
the market has not discounted. Their restructuring will be fueled by their recent acquisition of
Altera, a semiconductor company, in Q1 of 2016. This acquisition is expected to help INTC drive
Moore’s Law and the growth in data centers and internet of things (IOT), which will also allow
INTC to provide new classes of products to these market segments.
Risks and Firm Specific Issues:
Change in demand and macroeconomic environment
High competition environment
Defective products, errors in manufacturing
IP risks
Legal, regulatory, and litigation issues
Cybersecurity issues7
4
"Intel Corporation 10-K." SEC. SEC, 2 Feb. 2016. Web. 15 May 2016.
5
Bloomberg Terminal search for INTC US Equity, 5/15/2016
6
Press release on Q1 2016 restructuring, http://www.intc.com/investornews.cfm.
7
"Intel Corporation 10-K." SEC. SEC, 2 Feb. 2016. Web. 15 May 2016.
4Investment Thesis for Intel Corporation (NYSE: INTC) by Vinitha Kumar
Company Overview:
INTC was founded in 1968 in Santa Clara, California and went public in 1971.8 INTC strives to
offer complete and connected platforms, and to drive “Moore’s Law.” Moore’s Law is the idea
that processor speeds and power will double every two years9. INTC is focused on the,
“personalization of compute,” which refers to the phenomenon that computing is increasingly
becoming personal and incorporated into most aspects of life. In order to develop the
personalization of compute, INTC adheres to three assumptions: sensification of compute, smart
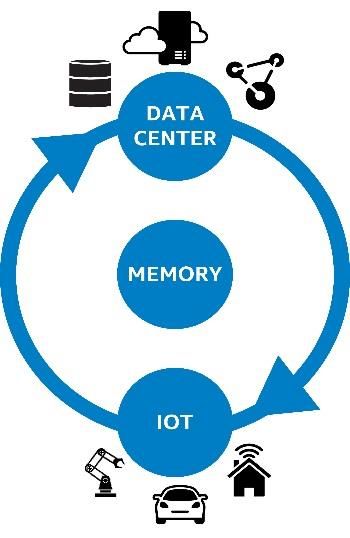
and connected, and extension of you. INTC’s growth strategy is summarized by the virtuous cycle
of growth, which is comprised of data centers, IOT, and memory. IOT and data centers go hand
in hand: as the world grows more connected and “smart,” there will be increased demand for data
and connectivity to devices. Memory will complement data centers and IOT, enabling systems to
be faster and more efficient. Below is a visual representation of INTC’s growth strategy10 (Figure
1). Furthermore, as mentioned previously, INTC recently announced plans to restructure their
initiative to move away from a PC company to a company that focuses on clouds and smart,
connected computing devices. 11
Virtuous Cycle of Growth
Figure 1: Virtuous Cycle of Growth for INTC
Source: "Intel Corporation 10-K." SEC. SEC, 2 Feb. 2016. Web. 15 May 2016.
INTC splits its revenues into operating segments and geography. The operating segments consist
of Client Computing Group (CCG), formerly PC Client Group and Mobile & Communications
Group, Data Center Group (DCG), Internet of Things Group (IOTG), Software and Services, and
other. CCG includes platforms for notebooks, 2 in 1 systems, desktops, tablets, phones, wireless
8
"Intel Timeline: A History of Innovation." Intel. N.p., n.d. Web. 15 May 2016.
.
9
"Moore's Law." Moore’s Law. N.p., n.d. Web. 15 May 2016. .
10
"Intel Corporation 10-K." SEC. SEC, 2 Feb. 2016. Web. 15 May 2016.
11
Press release on Q1 2016 restructuring, http://www.intc.com/investornews.cfm.
5Investment Thesis for Intel Corporation (NYSE: INTC) by Vinitha Kumar
and wired connectively products, and mobile communication components. DCG includes
platforms for enterprise, cloud, communications infrastructure, and technical computing segments.
IOTG includes platforms for the IOT, such as retail, transportation, and home use. Software and
Services includes products that supply solutions, such as security. The other category for both
revenues and expenses include the following: Non-Volatile Memory Solutions Groups (NSG),
New Devices Group, restructuring and asset impairment charges, employee compensation,
divested businesses, and acquisition-related costs12. The geographical segments consist of China
(including Hong Kong), Singapore, United States, Taiwan, and other countries.
Given INTC’s acquisitive behavior, we have outlined recent major transactions below to highlight
their investments into future earnings.
2016 Overview:
In Q1 of 2016, INTC completed the acquisition of Altera. As mentioned, Altera is a semiconductor
company specializing in programmable semiconductors and logic devices, such as field-
programmable gate arrays (FPGAs), as well as System-on-Chip (SoC) devices. In 2016, from Q1
results, net income for the year is annualized to be around $55 billion. Q1 earnings were $13,702
million, which is higher than 2015 Q1 earnings of $12,781 million. The business appears to be
cyclical, as earnings for 2015 were more than four times Q1 earnings. For consistency with the
model, 2016 Q1 numbers were annualized by multiplying the amount by four. Using this metric,
however, may not accurately represent INTC’s future sales, and therefore the model’s estimate for
2016 annualized revenue could be an underestimate.
2015 Overview:
During 2015, INTC completed eight acquisitions, which aggregated to a cost of $1.0 billion. Most
of these acquisitions were financed with cash and accounted for in goodwill or other intangible
assets. A significant acquisition in 2015 was the acquisition of Lantiq Semiconductor, which will
complement INTC’s cable home gateways into digital subscriber line (DSL) and fiber markets.
The revenue generated from these business services fall under their client computing group. INTC
also completed three divestitures transactions in 2015, generating $153 million.
2014 Overview:
During 2014, INTC completed eight acquisitions, for a total cost of $963 million. The
acquisition of Axxia Networking Business of Avago Technologies Limited, will complement
INTC’s mobile wireless base station business. The revenue generated from these business
services fall under their data center group. INTC divested the assets of Intel Media to Verizon
Communications Inc. in 2014 as well13.
Goodwill:
As a result of years of acquisitions, INTC has steadily grown its Goodwill. Below is a chart of
their Goodwill since 2011 (Figure 2). Goodwill represents the excess in fair value of a business’s
assets that accounts for its intangible value and brand name value. It is important to monitor a
company’s impairment of Goodwill to assess whether or not it is pricing its acquisitions correctly.
12
"Intel Corporation 10-K." SEC. SEC, 2 Feb. 2016. Web. 15 May 2016.
13
"Intel Corporation 10-K." SEC. SEC, 2 Feb. 2016. Web. 15 May 2016.
6Investment Thesis for Intel Corporation (NYSE: INTC) by Vinitha Kumar
INTC combines its asset impairment with its restructuring charges. This amount has increased
from 2013 to 2015, but this could be a result from their 2013 and 2015 restructuring programs.
Figure 2: INTC’s Goodwill
Source: "Intel Corporation 10-K." SEC. SEC, 2 Feb. 2016. Web. 15 May 2016.
Graph made by Vinitha Kumar
Long-term Asset Turnover and Useful Life:
As previously explained, INTC’s long-term asset turnover (LTAT) makes them a unique case to
assess. LTAT shows how efficiently a company is utilizing their asset base to generate revenues.
The following chart shows both their LTAT and useful life historically, and projected through the
HG-DCF. Recently, INCT’s LTAT has been decreasing. This is a result of their acquisitions and
higher amounts of assets, while having similar revenues each year. However, the HG-DCF
demonstrates that if there is a mean reversion of LTAT to historic levels (i.e. INTC is effective in
integrating these assets), these acquisitions will increase future revenues over time (see past red
line on figure below).
7Investment Thesis for Intel Corporation (NYSE: INTC) by Vinitha Kumar
INTC LTAT and Useful Life
10.00
9.00
8.00
7.00
6.00
Value
5.00
4.00
3.00
2.00
1.00
0.00
2011 2012 2013 2014 2015 2016 2017 2018 2019 2020 2021 2022 2023 2024 2025 2026
Years
LAT Useful Life
Figure 3: INTC’s LTAT and Useful Life
Source: "Intel Corporation 10-K." SEC. SEC, 2 Feb. 2016. Web. 15 May 2016.
Graph made by Vinitha Kumar, projections after 2016 determined through HG-DCF
Facilities:
While INTC leases a few of their facilities, it owns the majority of them, giving the Company
significant intrinsic value. Table 1 highlights the facilities INTC owns versus what it leases and
where.
(Square Ft in Millions) United States Other Total
Countries
Owned facilities 30.7 17.2 47.9
Lease facilities 2.1 6 8.1
Total facilities 32.8 23.2 56
Table 1: INTC’s Facilities
Source: "Intel Corporation 10-K." SEC. SEC, 2 Feb. 2016. Web. 15 May 2016.
Credit:
Table 2 below shows various companies’ credit rating for INTC, demonstrating that INTC’s debt
is not distressed.
Company Credit Rating
Morningstar AA-
Moody’s Stable, A1 (for long term and
senior unsecured debt)
8Investment Thesis for Intel Corporation (NYSE: INTC) by Vinitha Kumar
Standard & Poor’s Stable, A+ (for long term
debt)
Fitch Stable, A+
Egan-Jones Rating Company A+
Table 2: INTC’s Credit
Sources:
"Intel Corp." INTC Debt, Bond, Rates, Credit. Morningstar, n.d. Web. 15 May 2016.
.
Bloomberg Terminal, search for INTC US Equity, 5/15/2016
Model of Company:
The primary difficulty in modeling INTC was estimating its future growth revenue, as INTC’s
separate business segment revenues fluctuate significanty year to year and change often. Thus, it
is difficult to estimate what the segment will generate in the future given the growth in certain
segments and the secular headwinds faced in the PC markets. Historical averages and compounded
annual growth rates were used to project future revenues. The final growth estimate used for the
HG-DCF was the 10-year compounded annual growth rate from projecting segment data. Below
is the table of historical averages and numbers used to project revenue by segment.
The final growth rate used for the HG-DCF was 4.95%. This growth rate relies on the assumption
that there will be a mean reversion in revenues from all of INTC’s recent acquisitions which we
believe is realistic. For example, the acquisiton of Altera is expected to drive growth in the Data
Center Group and the IOT Group. As seen below, the growth rates used to project revenue in these
segments are much higher than other segments.
Note: this growth rate may overestimate the revenue growth rate in the near future, and thus the
future projected free cash flow per share. The model is very sensitive to assumed growth rates
which we address with our Monte Carlo simulation in subsequent sections.
2016
2011 2012 2013 2014 2015
Segments Q1A Average Assumed CAGR St Dev.
Client Computing Group
32,219 30,196
(CCG)
% growth (6.28%) -6.28% -3.19% -3.19% 0.00%
PC Client Group 35,624 34,688 33,270 34,669
% growth (2.63%) (4.09%) 4.20% -0.84% 0.00% -0.68% 3.61%
Data Center Group 9,911 11,219 12,161 14,387 15,977 15,996
% growth 13.20% 8.40% 18.30% 11.05% 0.12% 10.21% 10.21% 8.31% 6.00%
Internet of Things Group - 1,600 1,801 2,142 2,298 2,604
% growth 12.56% 18.93% 7.28% 13.32% 13.02% 13.02% 10.23% 4.13%
Mobile &
Communications - 1,791 1,375 202
Group
-
(23.23%) (85.31%)
% growth -54.27% 0.00% 51.68% 31.04%
Software and services 1,870 2,072 2,190 2,216 2,167 5,812
% growth 10.80% 5.69% 1.19% (2.21%) 168.20% 3.87% 12.34% 20.80% 65.88%
All other 6,594 1,971 1,911 2,254 2,694 200
9Investment Thesis for Intel Corporation (NYSE: INTC) by Vinitha Kumar
-
(70.11%) (3.04%) 17.95% 19.52% (92.58%)
% growth -25.65% -25.65% 44.16% 46.71%
Total net revenue 53,999 53,341 52,708 55,870 55,355 54,808
% growth (1.22%) (1.19%) 6.00% (.92%) (.99%) 0.34% 0.34% 0.25% 2.83%
Table 3: INTC Revenue Growth
Original calculated by James Shin, adapted and updated by Vinitha Kumar
Further, capital expenditures (CAPEX) was set to depreciation and amoritization (D&A) levels.
This assumes that INTC will replace its capital at the rate of its D&A levels. Although historically
INTC has made strategic acquisitions, this assumption relies on INTC focusing on translating
previous acquisitions into revenues, and reducing the rate at which it acquires companies. In 2015,
INTC saw high levels of CAPEX (42.73%). However, keeping up this rate with acquisitions is
unrealistic. The assumed rate used in the HG-DCF was 14.39%. This assumption is validated from
its restructuring efforts to transform its company and its focus on the recent acquisiton of Altera
to help its movement.
Results and Discussion of Model:
The probable free cash flow per share determined through the HG-DCF was $37.07, compared to
a market price of $30.06. In order to estimate this price, margins and revenue were projected using
historical data. These projections and assumptions can be found in both the revenue growth tab
and the Hanke-Guttridge Free Cash Flow (HG-FCF) page. Below is a summary of the HG-FCF,
which shows the Company’s various value drivers (Table 4).
The HG-FCF shows that INTC has stable margins, as all the standard deviations are low, with the
exception of CAPEX. Stable margins indicate good management and consistency in management
decisions.
Although historical LTAT has been decreasing, it is expected, through the HG-DCF, to begin
increasing as more revenue is generated with the asset base reflecting management’s ability to
integrate these assets into the business. Although useful life is historically increasing, it is expected
to decrease through the HG-DCF beacuse the model assumes that D&A and CAPEX grow at the
same rate so the asset base will stay the same.
A Monte-Carlo Simulation was performed to assess the projected free cash flow per share and its
probable distribution. The current price falls between the 20th and 30th percentile of the simulation
(see Figure 4 below). This indicates that we anticipate INTC’s shares to be underpriced. With the
probable free cash flow being $37.07, 23.33% higher than its current price, and the current price
falling to the left of the distribution, there appears to be an upside: this distribution supports the
hypothesis that the market is not pricing INTC correctly to account for its future mean reversion
and increased value.
10
Table 4: INTC HG FCF and Value DriversInvestment Thesis for Intel Corporation (NYSE: INTC) by Vinitha Kumar
Std.
Year 2011 2012 2013 2014 2015 2016
Average Dev.
Net revenue 53,999 53,341 52,708 55,870 55,355 54,808
54,347 1,214
% growth (1.22%) (1.19%) 6.00% (.92%) (.99%) 0.34% 2.83%
Cost Structure (as % of net revenue)
Cost of goods sold, net D&A 26.26% 23.75% 24.96% 20.96% 21.62% 25.96% 23.92% 2.03%
R&D 15.46% 19.02% 20.13% 20.65% 21.91% 23.69% 20.14% 2.55%
Marketing, general & administrative 14.20% 15.10% 15.34% 14.56% 14.33% 16.25% 14.96% 0.70%
Restructuring & asset impairment
0.00% 0.00% 0.46% 0.53% 0.64% 0.00%
charges 0.27% 0.28%
EBITDA (as % of net revenue) 44.08% 42.12% 39.11% 43.30% 41.51% 34.10% 40.70% 3.34%
Gains (losses) on equity investments,
net 0.21% 0.26% 0.89% 0.74% 0.57% 0.16%
(as % of net revenue) 0.47% 0.28%
Interest and other, net (as % of net
0.36% 0.18% (0.29%) 0.08% (0.19%) (0.60%)
revenue) -0.08% 0.32%
Income tax provision (as % of
20.33% 17.22% 14.51% 16.94% 12.15% 9.89%
EBITDA) 15.17% 3.45%
Cash flow drivers (as % of net
revenue)
Change in working capital 2.26% 5.43% (6.59%) 0.40% (4.69%) -0.64% 4.43%
Capital expenditures 28.62% 29.05% 22.27% 13.10% 42.73% 27.16% 9.69%
D&A (as % of net revenue) 11.23% 14.10% 15.24% 15.30% 15.74% 14.71% 14.39% 1.50%
11Investment Thesis for Intel Corporation (NYSE: INTC) by Vinitha Kumar
Execution Risk:
The Monte-Carlo distribution helps to assess the execution risk of investing in INTC. From the
figure, there appears to be more upside than downside. There is, however, the risk that the
assumptions in the HG-DCF are wrong. For example, INTC could acquire companies, as it did in
2015, and cash flow would not be freed for shareholders. Alternatively, the macroeconomic
environment could worsen and revenue growth could either decline or plateau in addition to
management failing to properly integrate these assets to generate meaningful revenue.
Analysts’ Recommendations:
As stated before, Bloomberg reports that analysts have a target price of $35.53 for INTC, giving a
return potential of 18.8%. The following graphic reviews various analysts’ recommendations on
INTC (Figure 5). 56.8% of firms recommend a buy, 36.4% recommend a hold, and 6.8%
recommend a sell. Therefore, there is not a general consensus on INTC being a buy, but most
analysts predict INTC will either keep up with the market or outperform it.
Figure 5: Analysts’ Recommendations
Source: Bloomberg Terminal. Search for INTC US Equity, 5/15/2016
Given that our investment thesis is predicated on the mean-reversion of future asset turns, we
opted to investigate management compensation and determine if executive incentives are aligned
with our projections.
12Investment Thesis for Intel Corporation (NYSE: INTC) by Vinitha Kumar
Proxy Report:
Management Compensation:
Base Salary and Cash Bonuses:
The total base salary of all 5 executives in 2015 was $4,165,000. The main portion of cash
payments are annual incentive payouts based on various measures of company performance. Due
to lower financial earnings in 2015, incentive cash payouts were lower in 2015 than in 2014.
Whereas in 2014 the payout was 122% of the target, the payout in 2015 was 94.3% of the target.
Figure 6, below, details how annual cash incentive payments are calculated. The calculation
includes inspecting changes in net income, net income growth, and group-specific goals. Also
below are the amounts paid out in cash and the change from 2014 (Table 5). Most amounts
declined from 2014 to 2015, which reflects that management was not paid when the Company
underperformed.
Figure 6: Annual Incentive Cash Formula Details
Source: "Intel Corporation Schedule 14A." SEC. SEC, 4 Apr. 2016. Web.
15 May 2016.
.
Name 2015 Annual Cash 2014 Annual Cash % Change 2015 vs.
Incentive ($) Incentive ($) 2014
Brian M. Krzanich 3,301,700 3,221,400 2%
Andy D. Bryant 1,369,700 1,776,300 (23)%
Stacy J. Smith 1,698,000 1,581,800 7%
William M. Holt 1,013,000 1,179,500 (14)%
Renee J. James 1,918,100 2,487,200 (23)%
Table 5: Annual Cash Incentives 2014 and 2015
Source: "Intel Corporation Schedule 14A." SEC. SEC, 4 Apr. 2016. Web. 15 May 2016.
.
13Investment Thesis for Intel Corporation (NYSE: INTC) by Vinitha Kumar
Long-term Incentive Compensation:
Equity awards consisting of restricuted stock units and outperformance restricted stock units are
given based on company performance, notably absolute and relative total shareholder return
(TSR). In 2015, TSR was 9.3%, which was above INTC’s peer group. Total payout in equity
awards was 158% of target. TSR is used as the financial criteria so that the executive committee
can align their interests with that of shareholders. Further, every executive must hold stock in
INTC. The table below details the specific equity ownership requirements.
Title Minimum Number of Shares
CEO 250,000
Executive Chairman & President 150,000
CFO 125,000
Executive Vice President 100,000
Senior Vice President 65,000
Corporate Vice President 35,000
Other VPs, Intel Fellows, and Senior Leaders 5,000 to 10,000
Table 6: Minimum Equity
Source: "Intel Corporation Schedule 14A." SEC. SEC, 4 Apr. 2016. Web. 15 May 2016.
Total Compensation:
.
Figure 7, below, demonstates how annual compensation was allocated for 2015, and a summary
comepsnation table floows.
Figure 7: Compensation Chart
Source: "Intel Corporation Schedule 14A." SEC. SEC, 4 Apr. 2016. Web. 15 May 2016.
.
14Investment Thesis for Intel Corporation (NYSE: INTC) by Vinitha Kumar
Table 7: Compensation Summary
Source: "Intel Corporation Schedule 14A." SEC. SEC, 4 Apr. 2016. Web. 15 May 2016.
.
15Investment Thesis for Intel Corporation (NYSE: INTC) by Vinitha Kumar
Current Executive Committee:
Name Age Position
Brian M. Krzanich 56 Chief Executive Officer
Andy D. Bryant 64 Chairman of the Board
Stacy J. Smith 52 Executive Vice President and Chief Financial
Officer
William M. Holt 62 Executive Vice President, General, Manager,
Technology, &Manufacturing Group
Renee J. James 51 Former President
Table 8: Current Executive Committee
Source: "Intel Corporation Schedule 14A." SEC. SEC, 4 Apr. 2016. Web. 15 May 2016.
.
Current Board of Directors and Relative Compensation:
Charlene Barshefsky $313,700
Aneel Bhursi $213,700
Susan L. Decker $378,700
John J. Donahue $261,000
Reed E. Hundt $316,200
James D. Plummer $326,200
David S. Pottruck $333,700
Frank D. Yeary $331,200
David B. Yoffie $343,400
Table 9: Current Board of Directors and Compensation
Source: "Intel Corporation Schedule 14A." SEC. SEC, 4 Apr. 2016. Web.
15 May 2016.
Compensation Committee:
.
John J. Donahue
David S. Pottruck (Chair)
David B. Yoffie
Table 10: Compensation Committee
Source: "Intel Corporation Schedule 14A." SEC. SEC, 4 Apr. 2016. Web.
15 May 2016.
.
*Note: there is no overlap between the compensation committee and the executive committee.
Companies in Technology Peer Group14: Applied Materials, Inc.
Amazon.com Cisco Systems, Inc.
Apple Inc. eBay Inc.
EMC Corporation
14
“Intel Corporation Schedule 14A." SEC. SEC, 4 Apr. 2016. Web. 15 May 2016.
.
16Investment Thesis for Intel Corporation (NYSE: INTC) by Vinitha Kumar
Google Inc. General Electric Company
HP Inc. Johnson & Johnson
International Business Machines Merck & Co., Inc.
Corporation Pfizer Inc.
Microsoft Corporation Schlumberger Limited
Oracle Corporation United Parcel Service, Inc.
Qualcomm Inc. United Technologies Corporation
Texas Instruments Inc Verizon Communications Inc.
TSMC Ltd
Western Digital Corporation
Companies in S&P 100 Peer Group:
AT&T Inc.
The Dow Chemical Company
INTC lies within the 53rd percentile with revenues, 73rd percentiled with net income, and the 57th
percentile with market capitalization.
Dividend and Share History:
INTC currently has 4,875 million diluted shares outstanding. This amount has steadily decreased
since 2011, as the Company has an ongoing share repurchase plan in place. In 2005, the Board of
Directors authorized repurchase of shares up to $65 billion. At the end of 2015, $9.4 billion
remained in the program for repurchase of shares15. The total number of shares repurchased during
2015 was $95.7 million, which was a total of 16 million shares. Below is a chart depicting the
decrease in number of shares outstanding over the past five years. The share repurchase explains
why EPS increased, as net income decreased, from 2014 to 2015.
15
"Intel Corporation 10-K." SEC. SEC, 2 Feb. 2016.
Web. 15 May 2016.
17
Figure 8: INTC Current Shares Outstanding
Source: Bloomberg Terminal, search , define Current Shares Outstanding as field, for INTC US Equity, 5/15/2016Investment Thesis for Intel Corporation (NYSE: INTC) by Vinitha Kumar
INTC has historically paid dividends, and the dividends have been increasing in value. The
following shows the dividend yield of INTC over the past five years. The dividend yield is
currently 4.1458%. The amount paid in cash has also increased over time. In 2016, INTC
declared that it would pay a quarterly dividend of $0.26.
18Investment Thesis for Intel Corporation (NYSE: INTC) by Vinitha Kumar
Cash Dividends per Share
1.10 1.04
1.00 0.96
0.90 0.90
0.90 0.87
0.78
0.80
0.70
0.60
0.50
2011 2012 2013 2014 2015 2016 Q1A
Figure 10: INTC Cash Dividends per Share
Created by Vinitha Kumar
Multiples:
INTC’s current P/E is 12.79. Multilpying this by its EPS of 2.33 yields a stock price of $29.8,
which is near the current stock price. This P/E implies that an investor would be willing to pay
$12.79 per $1 of earnings from INTC. INTC’s current price to book ratio is 2.2726, which is on
the lower end of its historical values.
Insider Transaction Information:
The top two holders of INTC are Vanguard Group and BlackRock. The top ten holders of INTC
hold 30.64% of shares oustanding. Investment advisors hold 88.76% of shares, pension funds hold
3.17%, and banks hold 2.18%. Insiders only hold .04% of shares. The screenshot below from
Bloomberg reviews these statistics.
19Investment Thesis for Intel Corporation (NYSE: INTC) by Vinitha Kumar
Figure 10: INTC Ownership
Source: Bloomberg Terminal, search , for INTC US Equity, 5/15/2016
Conclusion:
Although 2015’s results were not as strong as 2014’s, INTC continues to make sound management
decisions and adapt to customers’ needs. The market currently prices INTC at $30.06, which is
lower than the probable free cash flow per share of $37.07 determined through our HG-DCF. The
HG-DCF relies on the assumption that there will be a mean reversion in revenues, asset turnover
ratios, and margins. This assumption makes sense as INTC has historically made strategic
acquisitions, but is now focusing on restricting their company and utilizing their recent acquisitions
to complement their various business segments. In order for this to happen, CAPEX must be
sustained at lower levels, and revenue growth rates must increase as the acquired assets begin to
generate revenue. The Monte-Carlo simulation shows that the current stock price is between the
20th and 30th percentile, indicating that there is more upside than downside with investing in INTC
based on our model. There are certain risks with relying on the HG-DCF for investment decisions,
notably the assumptions used to predict the future free cash flow to shareholders. After analyzing
INTC’s management compensation, it is evident that executives are aligned with shareholders
interest as they are required to hold equity and are compensated based on total shareholder return.
There were no clear red flags when reading through INTC’s management compensation and
nothing stood out as inconsistent with our investment thesis. Assuming the revenue growth rates
and CAPEX rates hold and management decisions stay sound, I recommend INTC as a buy.
20You can also read