MID-YEAR 2021 OUTLOOK - COVID-19 ADAPTATIONS
←
→
Page content transcription
If your browser does not render page correctly, please read the page content below

AEW RESEARCH 2021 EUROPEAN RESEARCH OUTLOOK                                                                                                        EUROPE | NOVEMBER 2020

MID-YEAR 2021 OUTLOOK
COVID-19 ADAPTATIONS

  BOSTON DÜSSELDORF FRANKFURT HONG KONG LONDON LOS ANGELES LUXEMBOURG MADRID MILAN PARIS PRAGUE SEOUL SINGAPORE SYDNEY WARSAW TOKYO   |   AEW.COM
AEW RESEARCH MID-YEAR 2021 OUTLOOK EUROPE | APRIL 2021
EXECUTIVE SUMMARY: ADAPTING TO LONG TERM IMPACTS
Covid-19 negatively impacted 2020 European growth to various degrees. Regardless of its precise speed,
the 2021-22 recovery is expected to be solid. But, this strength is also raising concerns on inflation.
Despite a recent uptick in inflation, the swap market still prices central banks to keep rates low and
government bond yields lower for longer as the output gap remains high.
Compared to our 2021 outlook, we have downgraded our rental growth for offices and retail as working-
from-home and e-commerce penetration are trends projected to outlast the immediate Covid-19 crisis.
Despite this negative impact on income growth, our overall return outlook remains positive. This is driven
by our expectation that prime property yields should stay low and capital values stable for the next five
years.
Our updated 2021-25 risk-adjusted return approach shows that 80 of our 106 covered markets are
attractive or neutral under our base case scenario, as illustrated in the scatter chart below. This is a slight
improvement from our previous analyses from Sep-20 when we had 77 of 103 markets classified as such .
Our 2021-25 upside scenario show that 75 of 106 covered markets are attractive or neutral. This is slightly
worse than the base case and downside scenarios. This is triggered by the economic upside scenario’s
increased bond and property yields which are not sufficiently offset by rental growth.
As the immediate Covid-19 concerns fade, the market will adapt further to the long term changes in
demand and supply as it will also deal with further climate change adaptation and mitigation.
BASE CASE 2021-25 – EXPECTED VS REQUIRED PRIME MARKET RETURNS
Sources: CBRE, RCA, INREV, Oxford Economics, OECD, AEW Research & Strategy
BOSTON DÜSSELDORF FRANKFURT HONG KONG LONDON LOS ANGELES LUXEMBOURG MADRID MILAN PARIS PRAGUE SEOUL SINGAPORE SYDNEY WARSAW TOKYO | AEW.COM
2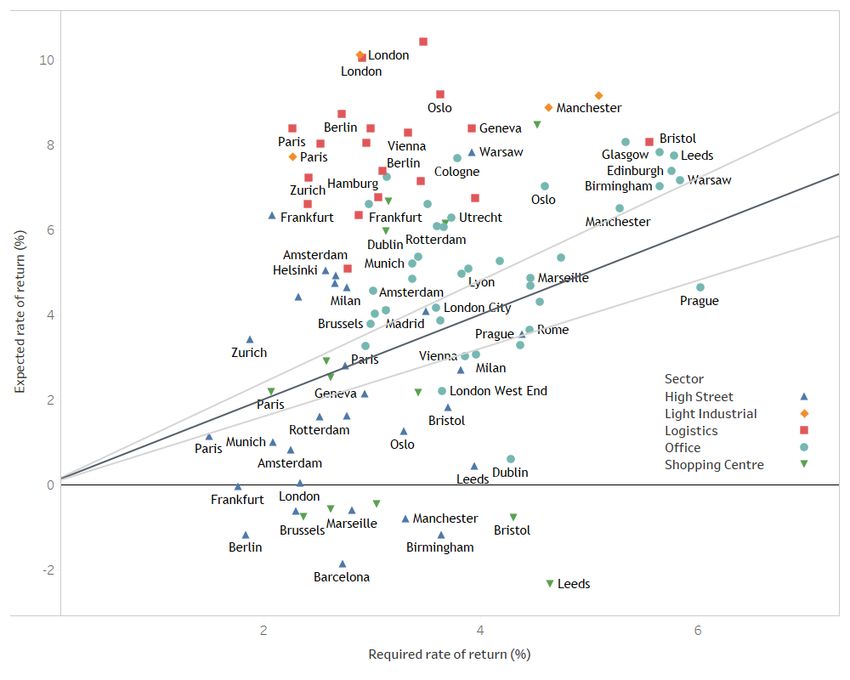
AEW RESEARCH MID-YEAR 2021 OUTLOOK EUROPE | APRIL 2021
SECTION 1: ECONOMIC BACKDROP
STRONG RECOVERY, BUT DOWNSIDE RISK REMAINS European GDP index (% per annum)
Given the non-traditional, medical nature of the current crisis, we base our
150
market forecasts on three different GDP scenarios to reflect the higher
degree of uncertainty surrounding the precise strength of the recovery – 140
providing our Sep-20 base case for comparison.
In our base case, due to extended lockdowns modest 2.7% GDP growth for 130
2021 is followed by 3.5% in 2022 across our European 20 countries. Over the
full 2021-2025 period, GDP growth is expected to normalize at 2.4% pa. 120
The downside scenario assumes additional lockdowns and extended
110
measures resulting in a weaker recovery of 2.0% and 2.8% in 2021 and 2022
respectively.
100
Finally, the upside scenario accounts for a stronger recovery due to a 2000 2003 2006 2009 2012 2015 2018 2021 2024 2027 2030
successful vaccine rollout and lifting of restrictions showing 3.5% GDP growth
Sep '20 Base Case April '21 Base Case
in 2021 and 4.5% in 2022 over our 20 European countries universe. April '21 Downside April '21 Upside
Sources: Oxford Economics, OECD and AEW Research & Strategy 2020 (September
– simple growth average across 20 countries)
SOLID REBOUNDS FOR FRANCE, SPAIN & UK Real GDP growth – Base case (2020-25 vs 2021-25)
Countries hit hardest in 2020 by the Covid-19 lockdowns, like France, Spain
and the UK are expected to record the strongest growth rebounds in the France
wake of the Covid-19 pandemic under our base case scenario.
The United Kingdom does well as it was able to roll out an early and efficient Spain
vaccination program and has started already lifting many restrictions.
In contrast, Germany recorded a much weaker recession in 2020 and as a UK
consequence is also expected to record a weaker recovery than its European
neighbours. Germany’s 2020 GDP contracted only by about half of the -8% to Europe (20)
-11% contractions for the other big European economies.
National recoveries are likely to be correlated to country-specific factors such Italy
as exposure to tourism, tech and healthcare.
Germany
0.0 0.5 1.0 1.5 2.0 2.5 3.0 3.5
2020-2025 2021-2025
Sources: Oxford Economics, OECD and AEW Research & Strategy 2020 (September)
Eurozone actual inflation vs us inflation expectation –
AS ECONOMIC GROWTH PICKS UP, INFLATION CONCERNS RE-SURFACE 2004-2020
Eurozone inflation remains very low, but US inflation expectations have
4.00%
ticked up on the back of significant fiscal spending programs announced by
3.50%
the new US president as well as the lifting of restrictions and a strong
3.00%
rebound of economic activity in the US and China.
Our graph illustrates the historical relationship between actual Eurozone 2.50%
inflation and US forward expected inflation, given that no Eurozone specific 2.00%
inflation expectation data is available to us. 1.50%
There are a number of reasons to assume that the historical positive 1.00%
correlation between US inflation expectations and Eurozone inflation might 0.50%
not hold in the coming 12-18 months. 0.00%
First, the slower vaccination rates in Europe compared to the US are
Q3 2008
Q3 2005
Q3 2011
Q3 2014
Q3 2017
Q2 2012
Q4 2004
Q2 2006
Q2 2009
Q1 2010
Q4 2010
Q1 2007
Q4 2007
Q1 2013
Q4 2013
Q2 2015
Q1 2016
Q4 2016
Q2 2018
Q1 2019
Q4 2019
Q3 2020
expected to lead to a delay in the economic recovery and actual inflation
across the Euro area.
Secondly, the fiscal policy response in Europe has been much less US 5Y Forward Inflation Expectations (%) [RHS]
meaningful and has not yet been validated by all relevant parties across the Euro Area HCPI [LHS]
EU. Sources: FRED St Louis, AEW Research & Strategy
BOSTON DÜSSELDORF FRANKFURT HONG KONG LONDON LOS ANGELES LUXEMBOURG MADRID MILAN PARIS PRAGUE SEOUL SINGAPORE SYDNEY WARSAW TOKYO | AEW.COM
3
AEW RESEARCH MID-YEAR 2021 OUTLOOK EUROPE | APRIL 2021
MONEY SUPPLY AND INFLATION REMAIN DECOUPLED Eurozone m3 growth and inflation (Y-O-Y %)
As highlighted before, money supply increased due to continued
5.0% 14.0%
quantitative easing by central banks in 2020.
12.0%
Theoretically, an increase in money supply in combination with a limited 4.0%
ability to expand production in the short term should lead to inflation. 10.0%
Slow circulation of money supply in the economy has led to a de-coupling of 3.0% 8.0%
the money supply and inflation. 6.0%
2.0%
Underlying reasons might be related to commercial banks increasing their 4.0%
reserves in anticipation of future loan losses as well as households increasing 1.0% 2.0%
savings as returns on pension assets are lower than anticipated.. 0.0%
0.0%
If we assume this de-coupling continues, central banks are given extra -2.0%
flexibility for further growth in money supply without increasing inflation. -1.0% -4.0%
Finally the ECB and BoE could implement a similar new approach like the
Jul-06
Dec-11
Jan-00
Feb-01
Apr-03
Feb-14
Jul-19
Aug-20
May-04
Mar-02
Aug-07
Sep-08
Oct-09
Jan-13
Mar-15
Apr-16
May-17
Jun-05
Nov-10
Jun-18
Federal Reserve increasing its policy rates only after inflation consistently
remains above its target for some time.
Inflation (% y-o-y, LHS) Money Supply growth (M3 - y-o-y %, RHS)
This means that a short term increase in inflation is unlikely to immediately
trigger an increase in interest rates.
Sources: Fred St Louis, Oxford Economics and AEW Research & Strategy
SIGNIFICANT OUTPUT GAP TO CUSHION EUROZONE INFLATION Output gap (% of gdp)
Due to the Covid-19 crisis, we have seen a big increase in the negative output 2000-2019 average 2020 2021 2022 2023
gap across most European countries to levels well ahead of their 20-year 2
historical averages. 1
This negative output gap can be interpreted as the unutilised spare capacity
0
in the economy and provides a cushion against inflation.
-1
As workers are furloughed, put on less hours or non-active or even laid off
there is spare capacity that can be mobilised when an economic recovery -2
emerges without increasing wages or costs.
-3
This means that the anticipated increase in real economic growth post
-4
Covid-19 or money growth from continued monetary easing can be
absorbed first by the available spare capacity before it will result in increased -5
inflation. -6
-7
Eurozone France Germany Italy Spain United
Kingdom
Sources: Oxford Economics and AEW Research & Strategy
10yr government bond yields (%, european average across
SWAP-IMPLIED BOND YIELDS SIGNAL LOWER FOR LONGER 20 countries)
Regardless of our own view on inflation or monetary policies, we have found it 7
useful to look at the swap-implied bond yields in the past.
6
Sophisticated investors price these swaps incorporating all available data on
possible macro economic and policy scenarios. The implied government 5
bond yields from this market can be used as an indication of future yields.
4
Given that macro economic forecasts have consistently mistimed their
normalisation of bond yields over the last 10-12 years, we prefer actual prices.
3
Compared to our Sep-20 base case, we note the swap market has priced in
slight reduction in its speed of future bond yield widening. 2
In our property market modelling, this assumption of lower for longer
1
government bond yields plays a central role in stable income yields and
capital values regardless of changes in the income return. 0
2000 2002 2004 2006 2008 2010 2012 2014 2016 2018 2020 2022 2024 2026 2028 2030
Sep '20 Base Case April '21 Base Case
April '21 Downside April '21 Upside
Sources: Oxford Economics, OECD, Bloomberg, AEW Research & Strategy
BOSTON DÜSSELDORF FRANKFURT HONG KONG LONDON LOS ANGELES LUXEMBOURG MADRID MILAN PARIS PRAGUE SEOUL SINGAPORE SYDNEY WARSAW TOKYO | AEW.COM
4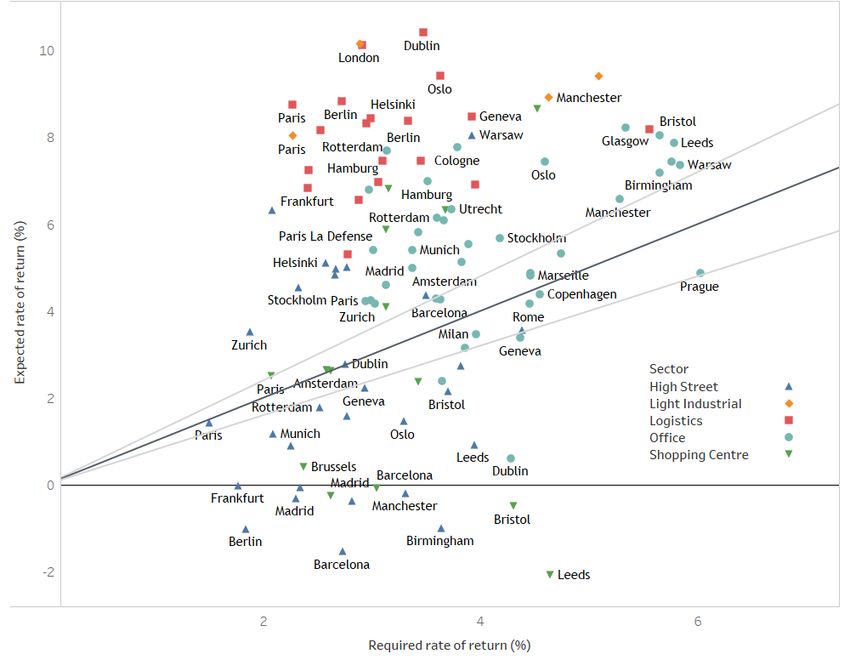
AEW RESEARCH MID-YEAR 2021 OUTLOOK EUROPE | APRIL 2021
SECTION 2: OCCUPIER & INVESTMENT MARKET
WFH-implied reduction in office-based employees from
WFH SHAVES OFF 1% PA FROM EUROPEAN OFFICE DEMAND TILL 2024 2018 to 2024 by City (as % pa )
Post Covid-19 work practices are projected to trigger a near 10% increase in
25 City Average
Copenhagen
London City
Amsterdam
the working from home (WFH) share of office workers from 2018 to 2024.
Rotterdam
The Hague
Stockholm
Dusseldorf
Barcelona
Hamburg
Budapest
Frankfurt
Marseille
Brussels
Warsaw
But we assume that workers who sometimes or usually work from home will
Utrecht
Munich
Prague
Madrid
Vienna
Dublin
Rome
Berlin
Milan
Paris
Lyon
Lille
still be attending the office half the time. This means that the need for space
compared to current levels will only reduce by 5% over the period. 0.0%
As a result, this means that over the six year period there will be reduction in -0.2%
office space requirement from WFH of 1% pa to offset the normal growth in -0.4%
office employment across our 25 European office markets.
-0.6%
Based on their high levels of traffic congestion on a city level basis, Dublin
-0.8%
and London are among the office markets impacted most from WFH as high
traffic congestion incentivises both employers and employees to allow for -1.0%
more WFH in the future. -1.2%
The most WFH resilient office markets are expected to be Copenhagen, -1.4%
Berlin, Amsterdam and Warsaw due to low local traffic congestion
Sources: Eurofound, Eurostat & IRIX, AEW Research & Strategy
E-COMMERCE PENETRATION EXPECTED TO SLOW POST-COVID Online sales as % of total retail sales - Post-Covid Forecasts
E-commerce has steadily increased its share of retail sales since the GFC. 30%
After doubling between 2012-2019 in most European countries, online sales
penetration rates surged in 2020 amid Covid-19 lockdowns. 25%
As the vaccines allow for consumers to return to in-store shopping, e-
20%
commerce penetration rates are projected to come down in 2021. From 2022
onwards, ecommerce penetrations rates should resume their increase, albeit
15%
at a slower pace.
Since most European governments will be more heavily indebted post- 10%
Covid, they are increasingly likely to finally become serious about properly
taxing e-commerce platforms and levelling the playing field for in-store retail. 5%
Returned goods have hurt pure e-commerce platforms’ profitability while
0%
omni-channel retailers will be better positioned to deal with these. UK Germany France Netherlands Spain Italy
Consequently, traditional retailers should see a boost to in-store sales in 2021-
2012 2019 2020 2021
22 allowing them time to optimise their store networks and implement their
omni-channel strategies. Sources: eMarketer, AEW Research & Strategy
RETAIL AND OFFICES ADAPT TO LONG TERM COVID-19 IMPACTS Annualised prime rental growth forecast (5 yr., % 2021-2025)
Based on the macro economic scenarios and the latest market data, our
revised rental growth forecasts highlight logistics as the most resilient sector. 2.5%
With the boom of e-commerce sales since the initial lockdowns expected to 2.0%
last, our April-21 forecasts remain in line with last year and reach above 1.5%
1.5%
for the three scenarios.
1.0%
Despite the immediate Covid-19 impact, rental growth remained positive in
2020 for offices. Due to the delayed economic recovery and our long term 0.5%
WFH outlook, office rental growth is projected to be negative in 2021 with a 0.0%
weaker 2022 rebound. This explains the lower rental growth expectations
-0.5%
over the 5-year period compared to our Sep-20 base case results.
With the retail sector hit worse than expected in 2020 and the slow lifting of -1.0%
social distancing measures, our 5-year rental growth forecasts now take into -1.5%
Logistics (34) Office (59) Average (161) High Street Shopping
account negative rental growth in 2021/2022 for both high street retail and (35) Centre (33)
shopping centres. Sep '20 Base Case April '21 Base Case April '21 Downside April '21 Upside
However, widespread lease re-negotiations should lead to more sustainable
rent agreements and facilitate the sector’s structural adaptation. Sources: CBRE, OECD, Oxford Economics, Bloomberg, AEW Research & Strategy
BOSTON DÜSSELDORF FRANKFURT HONG KONG LONDON LOS ANGELES LUXEMBOURG MADRID MILAN PARIS PRAGUE SEOUL SINGAPORE SYDNEY WARSAW TOKYO | AEW.COM
5AEW RESEARCH MID-YEAR 2021 OUTLOOK EUROPE | APRIL 2021
LOWER FOR LONGER TO PREVENT PROPERTY YIELDS WIDENING Average prime yields (%) – April-21 Base Case
Yields moved apart for different property types in 2020 as the occupier and
9%
investment segments were impacted to various degrees by the pandemic.
Due to strong investors’ appetite and occupiers’ demand, logistics prime 8%
yields tightened further by 30 bps on average in 2020 despite the recession. 7%
Offices prime yields remained stable in 2020 at 3.9% on average.
6%
For the coming years, we expect yields to stabilize for these two resilient
sectors, after logistics yields converge towards prime offices. 5%
On the other hand, the Covid-19 pandemic amplified the already on-going
4%
yield widening for retail, by 50 and 75 bps on average for high street retail
and shopping centres respectively. As significant repricing was already to be 3%
seen before Covid-19, we expect retail yields to go down after a peak in 2021.
2%
All property types should benefit from the lower for longer government bond 2000 2004 2008 2012 2016 2020 2024 2028
yields environment that limited the impact of Covid-19 in 2020, unlike in High Street (35) Logistics (34)
Offices (59) Shopping centre (33)
2008, and should keep property yields at low levels for the coming years.
Sources: CBRE, OECD, Oxford economics, Bloomberg, AEW Research & Strategy
STRONG BOUNCE MELTS AWAY WITH LOWER RENTS & STABLE YIELDS Average prime capital returns (%)
Similar to previous periods, our capital returns are taking into account the 20%
new market rents as they filter into the income over time as leases roll over.
As previously projected, 2020 prime capital returns were much less affected 15%
than during the GFC and remained positive across prime sectors.
However, due to the slow start of the year and the delays in the vaccine 10%
rollouts in Europe, our 2021 forecasts have been revised downwards from 9%
5%
in Sep-20 to 5% across all sectors in our current base case.
In the downside scenario, our projections show a less strong rebound in 2021
0%
at 4.4% before following the base case trend.
As expected, our upside economic scenario shows higher capital returns in
-5%
2021. However, it still produces an unexpected result over the full 5-year
period due to the impact of long term bond yield normalization (widening). -10%
This means our upside economic scenario generates lower capital returns 2000 2003 2006 2009 2012 2015 2018 2021 2024 2027 2030
over the full 5 year projection period.
Sep '20 Base Case April '21 Base Case
April '21 Downside April '21 Upside
Sources: CBRE, OECD, Bloomberg, AEW Research & Strategy
UPSIDE ECONOMIC SCENARIO UNFAVOURABLE FOR RETURNS Prime Total return forecast (5 yr., % 2021-2025)
As before, 8-9% pa prime logistics returns for the 2021-25 period prove
10%
resilient to the impact of Covid-19 for all three scenarios consistent with its
rental growth and tightening yield projections.
8%
Office returns were revised downward as the long term impact from WFH
hits rental growth. Even with relative stability in yields, this has hit expected
6%
returns to decline to 4-5% from 7% pa in our Sep-20 base case.
Retail returns range between 2-3% pa, with prime shopping centres doing 4%
slightly better than high street retail in all scenarios.
Again, this revision is consistent with our more negative rental growth 2%
forecasts as e-commerce penetration stepped up significantly during the
Covid-19 crisis and is not expected to reverse over the long term. 0%
We note that our upside economic scenario produces unfavorable returns Logistics (34) Office (59) Average (161) Shopping High Street (35)
Centre (33)
compared to the other two scenarios, due the associated widening of yields.
Sep '20 Base Case April '21 Base Case April '21 Downside April '21 Upside
Sources: CBRE, OECD, Bloomberg, AEW Research & Strategy
BOSTON DÜSSELDORF FRANKFURT HONG KONG LONDON LOS ANGELES LUXEMBOURG MADRID MILAN PARIS PRAGUE SEOUL SINGAPORE SYDNEY WARSAW TOKYO | AEW.COM
6AEW RESEARCH MID-YEAR 2021 OUTLOOK EUROPE | APRIL 2021
SECTION 3: RELATIVE VALUE VIEWS
Required rate of return (RRR) vs expected rate of return
RISK-ADJUSTED RETURN METHODOLOGY (ERR)
Our risk-adjusted return approach is based on a comparison between the
required rate of return (RRR) and the expected rate of return (ERR) over the
next five years for each market.
The graph shows that the RRR, based on our 106 European markets’ average
stands at 350 bps while the ERR is 484 bps. This indicates that, on average,
the ERR has a positive excess spread of 134 bps over the RRR.
Furthermore, we notice that the liquidity premium is the largest component
of the RRR while the risk-free rate (capped at zero for negative rates) and
volatility premia have the lowest share.
By comparing the expected rate of return (ERR) with the required rate of
return (RRR), we classify markets as attractive, neutral or less attractive.
Therefore, if the ERR is higher than the RRR and not in the neutral zone, we
classify it as an attractive market and vice versa.
Sources: CBRE, RCA, INREV, Oxford Economics, OECD, AEW Research & Strategy
WFH IMPACTS OFFICE RELATIVE VALUE % Sector markets by attractiveness (Old vs New Base Case)
If we consider the sector-level results across Europe in our base case, we
100%
firstly notice that all logistic markets remain attractive in both our previous
2021 Annual outlook (old) and our current mid-year 2021 update (new).
80%
Secondly, the office sector is impacted as more markets are classified as
neutral (from seven during the annual outlook to eleven in our mid-year
update). This is due to the impact of WFH on rental growth expectation on 60%
several markets. Regardless, the majority of office markets remain attractive
despite this negative WFH impact. 40%
Finally, the picture in the retail sector is mixed with the majority of markets
being less attractive as the e-commerce trends hampers income growth.
20%
However, the number of attractive markets has increased driven by re-
pricing in previous quarters offering renewed opportunities in some retail
0%
markets. OLD NEW OLD NEW OLD NEW
Logistics Offices Retail
Attractive Neutral Less Attractive
Sources: CBRE, RCA, INREV, Oxford Economics, OECD, AEW Research & Strategy
% Sector markets by attractiveness (Down, Base and Up
UPSIDE SCENARIO UNFAVORABLE AMID YIELD NORMALISATION Case)
If we then consider the difference between our base case scenario with our 100%
downside and upside scenario, we notice that the impacts are unevenly
distributed across the sectors. 80%
First of all, and in line with our previous results, logistics seems to be
unaffected by scenarios as ERR’s are robust in all three scenarios. 60%
However, for the office sector the impact is more clear as the upside scenario
is less favorable. This might be counter-intuitive, but our upside economic 40%
scenario assumes higher bond and property yields which are not sufficiently
offset by higher economic growth and inflation. 20%
For the retail sector, we notice a similar trend in that our base case has the
most attractive markets followed by the downside and upside scenario. 0%
Again, this makes sense as yield movements, especially in the current low Down Base Up Down Base Up Down Base Up
interest rate environment, have more substantial impacts on capital values Logistics Offices Retail
and total returns. Attractive Neutral Less Attractive
Sources: CBRE, RCA, INREV, Oxford Economics, OECD, AEW Research & Strategy
BOSTON DÜSSELDORF FRANKFURT HONG KONG LONDON LOS ANGELES LUXEMBOURG MADRID MILAN PARIS PRAGUE SEOUL SINGAPORE SYDNEY WARSAW TOKYO | AEW.COM
7AEW RESEARCH MID-YEAR 2021 OUTLOOK EUROPE | APRIL 2021
CLEAR BIFURCATION EXPECTED ACROSS PROPERTY TYPES IN AFTERMATH OF THE COVID-PANDEMIC
When considering our base case results for our expanded universe of 106 markets (in our 2021 Annual outlook the universe was 103 markets),
we highlight a small improvement compared to our 2021 Annual Outlook risk adjusted returns.
The scatter graph works as follow: on the horizontal axis, we have the required rate of return (RRR) and on the vertical axis we have the
expected rate of return (ERR) for the next five years. The grey lines indicate a range of 20% of the difference between the two, which we think
is a good range where markets are not clearly over- or underpriced. In other words, markets within this middle range are labelled as neutral.
The results indicate, as before, the strength of the logistics sector amplified by the strong growth in e-commerce and its further integration
in our econometric modelling. Large urban agglomerations such as London, Paris and Berlin are expected to be among the top performers
in terms of risk-adjusted returns while Dublin remains a potential benefiter of Brexit.
Next, we see a mixed picture in the office market as WFH affects markets differently whereby regional markets seem to be more resilient
than the gateway cities, a result inline with our WFH March special report.
Finally, not unsurprisingly, we notice that the majority of high street retail and shopping centre markets are being labelled as less attractive
markets driven by e-commerce. However, there are pockets of strength within the retail sector that are benefitting like Milan.
Base case 2021-25 – Expected vs Required Rate of Returns
Sources: CBRE, RCA, INREV, Oxford Economics, OECD, AEW Research & Strategy
BOSTON DÜSSELDORF FRANKFURT HONG KONG LONDON LOS ANGELES LUXEMBOURG MADRID MILAN PARIS PRAGUE SEOUL SINGAPORE SYDNEY WARSAW TOKYO | AEW.COM
8AEW RESEARCH MID-YEAR 2021 OUTLOOK EUROPE | APRIL 2021
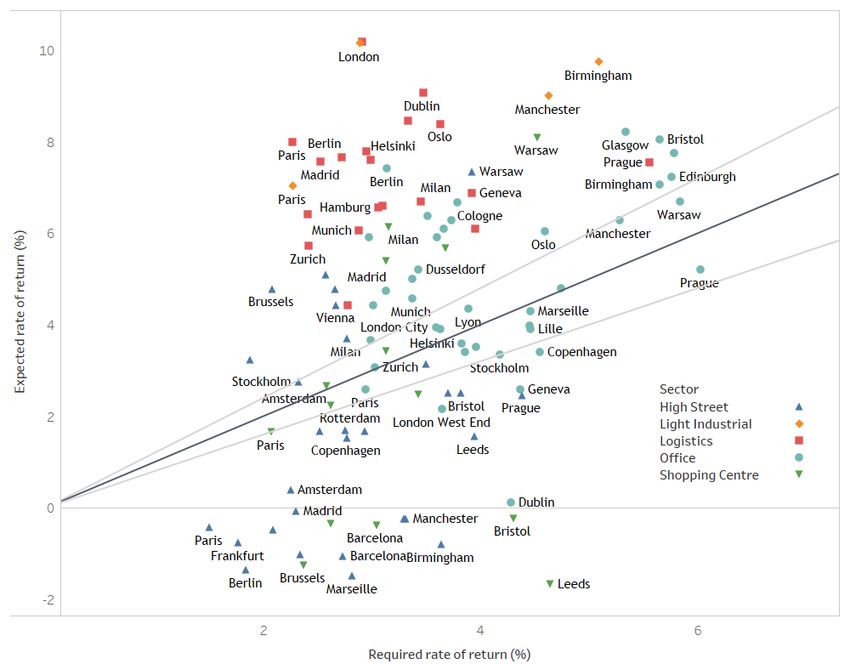
DOWNSIDE SCENARIO CONFIRMS BIFURCATION ACROSS PROPERTY TYPES
When considering our downside scenario results, we highlight that our expected rate of returns show only a small downward adjustment
compared to our base case scenario.
As before, the scatter graph works as follow: on the horizontal axis, we have the required rate of return (RRR) and on the vertical axis we have
the expected rate of return (ERR) for the next five years. The grey lines indicate a range of 20% of the difference between the two, which we
think is a good range where markets are not clearly over- or underpriced. Markets within this middle range are labelled as neutral.
First of all, the downside scenario confirms the bifurcation across property types as logistics keeps outperforming the other sectors. This
makes sense, as the logistics sectors remains less prudent to changes in economic activity compared to the office and retail sector.
Secondly, the Paris office market and Rome retail markets are among markets that have became neutral in the downside scenario from
attractive in the base case scenario. This of course, is driven by the lower rental growth that is achieved as the economic recovery is expected
to be lower in the downside scenario.
Downside 2021-25 – Expected vs Required Rate of Returns
Sources: CBRE, RCA, INREV, Oxford Economics, OECD & AEW
BOSTON DÜSSELDORF FRANKFURT HONG KONG LONDON LOS ANGELES LUXEMBOURG MADRID MILAN PARIS PRAGUE SEOUL SINGAPORE SYDNEY WARSAW TOKYO | AEW.COM
9AEW RESEARCH MID-YEAR 2021 OUTLOOK EUROPE | APRIL 2021
UPSIDE SCENARIO HIGHLIGHTS IMPACT OF BOND YIELD NORMALISATION WITH LOWER EXPECTED RETURNS
When considering our upside scenario results, we highlight that our expected returns show a downward adjustment compared to our base
case scenario, especially for markets that will be more sensitive . However, this downward adjustment results in some downgrades towards
less attractive markets.
Again, the scatter graph works as follow: on the horizontal axis, we have the required rate of return (RRR) and on the vertical axis we have the
expected rate of return (ERR) for the next five years. The grey lines indicate a range of 20% of the difference between the two, which we think
is a good range where markets are not clearly over- or underpriced. In other words, markets within this middle range are labelled as neutral.
First of all, the upside scenario highlights this impact of bond yield normalization as capital values will be negatively impacted and not fully
offset by rental growth expectations. This means, that more markets will be less attractive compared to the base or downside scenario.
Secondly, the Copenhagen/Stockholm and Zurich office markets are among markets that have been downgraded amid bond yield
normalization. This is partially driven by the fact that these markets are low yielding markets with less favorable economic growth
expectations.
Upside 2021-25 – Expected vs Required Rate of Returns
Sources: CBRE, RCA, INREV, Oxford Economics, OECD & AEW
BOSTON DÜSSELDORF FRANKFURT HONG KONG LONDON LOS ANGELES LUXEMBOURG MADRID MILAN PARIS PRAGUE SEOUL SINGAPORE SYDNEY WARSAW TOKYO | AEW.COM
10AEW RESEARCH MID-YEAR 2021 OUTLOOK EUROPE | APRIL 2021
ABOUT AEW
AEW is one of the world’s largest real estate asset managers, with €69.8bn of assets under management as at 31 December 2020. AEW
has over 700 employees, with its main offices located in Boston, London, Paris and Hong Kong and offers a wide range of real estate
investment products including comingled funds, separate accounts and securities mandates across the full spectrum of investment
strategies. AEW represents the real estate asset management platform of Natixis Investment Managers, one of the largest asset
managers in the world.
As at 31 December 2020, AEW managed €34.6bn of real estate assets in Europe on behalf of a number of funds and separate accounts.
AEW has over 400 employees based in 9 offices across Europe and has a long track record of successfully implementing core, value-add
and opportunistic investment strategies on behalf of its clients. In the last five years, AEW has invested and divested a total volume of
over €21bn of real estate across European markets.
RESEARCH & STRATEGY CONTACTS
Hans Vrensen CFA, CRE Irène Fossé MSc
HEAD OF RESEARCH & STRATEGY DIRECTOR
Tel +44 (0)20 7016 4753 Tel +33 (0)1 78 40 95 07
hans.vrensen@eu.aew.com irene.fosse@eu.aew.com
Dr. Dennis Schoenmaker Ken Baccam MSc
DIRECTOR DIRECTOR
Tel +44 (0)20 7016 4860 Tel +33 (0)1 78 40 92 66
dennis.schoenmaker@eu.aew.com ken.baccam@eu.aew.com
Ismail Mejri
DATA ANALYST
Tel +33 (0) 1 78 40 39 81
Ismail.mejri@eu.aew.com
INVESTOR RELATIONS CONTACT
Alex Griffiths MSc
HEAD OF INVESTOR RELATIONS EUROPE
Tel +44 (0)20 7016 4840
alex.griffiths@eu.aew.com
LONDON
AEW | 33 Jermyn Street | London, SW1Y 6DN | UK
PARIS
AEW | 22 rue du Docteur Lancereaux | 75008 Paris | FRANCE
DÜSSELDORF
AEW | Steinstraße. 1-3 | D-40212 Düsseldorf | GERMANY
This publication is intended to provide information to assist investors in making their own investment decisions, not to provide investment advice to any specific investor.
Investments discussed and recommendations herein may not be suitable for all investors: readers must exercise their own independent judgment as to the suitability of such
investments and recommendations in light of their own investment objectives, experience, taxation status and financial position. This publication is derived from selected sources
we believe to be reliable, but no representation or warranty is made regarding the accuracy of completeness of, or otherwise with respect to, the information presented herein.
Opinions expressed herein reflect the current judgment of the author: they do not necessarily reflect the opinions of AEW or any subsidiary or affiliate of the AEW’s Group and may
change without notice. While AEW use reasonable efforts to include accurate and up-to-date information in this publication, errors or omissions sometimes occur. AEW expressly
disclaims any liability, whether in contract, tort, strict liability or otherwise, for any direct, indirect, incidental, consequential, punitive or special damages arising out of or in any way
connected with the use of this publication. This report may not be copied, transmitted or distributed to any other party without the express written permission of AEW. AEW
includes AEW Capital Management, L.P. in North America and its wholly owned subsidiaries, AEW Global Advisors (Europe) Ltd. and AEW Asia Pte. Ltd, as well as the affiliated
company AEW SA and its subsidiaries.
BOSTON DÜSSELDORF FRANKFURT HONG KONG LONDON LOS ANGELES LUXEMBOURG MADRID MILAN PARIS PRAGUE SEOUL SINGAPORE SYDNEY WARSAW TOKYO | AEW.COMYou can also read