Indonesia Hotel Destinations - JLL Indonesia
←
→
Page content transcription
If your browser does not render page correctly, please read the page content below
April | 2019

Hotels & Hospitality Group

Hotel Destinations           Indonesia
2 Hotel Destinations - Indonesia

“10 New Balis”
Shaping the future of South East Asia’s tourism industry
Indonesia introduced a growth strategy to replicate the economic effects of tourism in Bali, the country’s
most famous island, across 10 identified destinations. These locations were selected based on their
attractiveness as a tourist destination, as well as the extent that the location will benefit from better access
and amenities.

       Lake Toba,                                                                                                   Morotai Island
      North Sumatra                                                                                                 North Maluku

                    Sumatra
                                                                Kalimantan

                                                                                        Sulawesi
                                                 Tanjung Kelayang,
                                                  Bangka Belitung

                                              Thousand Islands Jakarta                                      Wakatobi, South Sulawesi

                 Tanjung Lesung, Banten
                                                                     Mount Bromo, East Java    Labuan Bajo,
                                                             Java                              East Nusa Tenggara
                                      Borobudur Temple,
                                            Central Java
                                                                              Mandalika,
                                                                      West Nusa Tenggara
Hotel Destinations - Indonesia 3

       #1              place to visit in South East Asia
                       (ranked 7th globally)

Indonesia was ranked seventh out of the top 10
countries to visit in Lonely Planet’s Best in Travel 2019, the
only South East Asia country that made it to the list. Lonely
Planet prided Indonesia for its diversity in offerings that
ranged from new eco-resorts that offer orangutan encounters
in Sumatra to the tribal traditions of Papua.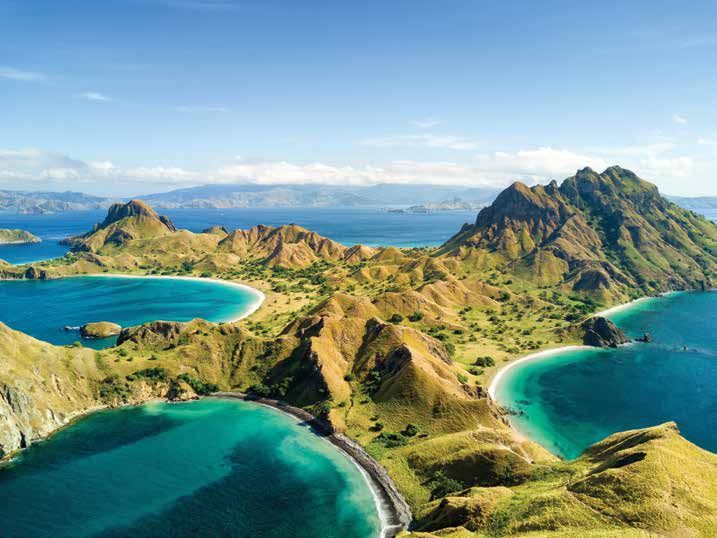
4 Hotel Destinations - Indonesia

Top 5                                                   trends and initiatives to watch in the hospitality industry

                         Record international visitor arrivals in Indonesia

   #1                    2018 marked the 12th consecutive record year for international visitor arrivals to Indonesia, registering a 12.6%
                         year-on-year (y-o-y) growth to 15.8 million. The rate of growth in international visitor arrivals accelerated in
                         recent years, achieving a compound annual growth rate (CAGR) of 13.8% from 2014 to 2018, compared to a
                         CAGR of 7.7% from 2010 to 2014.

                                                                  International Visitor Arrivals to Indonesia (2009-2019F)
                                                   25                                                                                                        +26.5% y-o-y     30%
                                                                                                                                                                to 20 mil
                                                                                                                                                   +12.6% y-o-y               25%
                     Visitor Arrivals (millions)

                                                   20                                                                                               to 15.8 mil

                                                                                                                                                                                    Annual Growth (%)
                                                                                                                                                                              20%
                                                   15
                                                                                                                                                                              15%
                                                   10
                                                                                                                                                                              10%

                                                   5                                                                                                                          5%

                                                   0                                                                                                                          0%
                                                         2009   2010   2011       2012       2013       2014         2015       2016       2017       2018       2019F
                                                                              International Visitor Arrivals                Annual Growth
                         Source: BPS Indonesia, JLL

                       The accelerated growth from 2014 to 2018 was                                            Indonesia's Top 5 source markets
                       supported by the government's relaxation of visa                                          Rank Top 5 Source International                  % of        2018
                       entry requirements and the introduction of new flight                                            Markets        Visitor                    Total       y-o-y
                       routes.                                                                                                        Arrivals
                                                                                                                   1         Malaysia             2.5 mil        15.8%        17.9%
                       In 2016, the Tourist Visa Free Facilities was extended
                       to 169 countries from 45 previously. The government                                         2          China               2.1 mil        13.5%        2.1%
                       also extended the Visa on Arrival to 61 countries to                                        3        Singapore             1.8 mil        11.2%        13.8%
                       include some of Indonesia's top 10 feeder markets
                                                                                                                   4        Timor Leste           1.8 mil        11.1%        83.5%
                       such as Australia, France, Japan, Saudi Arabia, United
                       Kingdom and United States of America.                                                       5         Australia            1.3 mil         8.2%        3.5%
                                                                                                               Source: BPS Indonesia
                       Regular direct charter flights were introduced from
                       several cities in China to Manado and Batam via Lion
                       Air and Sriwijaya Air, as well as flight routes from                                    Indonesia’s Top 5 key visitor growth markets
                       Chongqing to Bintan via air carrier Citilink.                                                Rank           Top 5 Growth Markets              2018 y-o-y
                       Korean Air also recently started operating flights from                                         1                  Timor Leste                    83.5%
                       Korea directly to the island of Lombok.                                                         2                   Malaysia                      17.9%
                       Timor Leste, Indonesia's fourth largest source market,                                          3                  Singapore                      13.8%
                       registered significant visitor arrivals growth, fuelled                                         4          United States of America               12.3%
                       by Garuda Indonesia and Air Timor's introduction of
                                                                                                                       5                    France                          4.9%
                       new weekly flights.
                                                                                                               Source: BPS Indonesia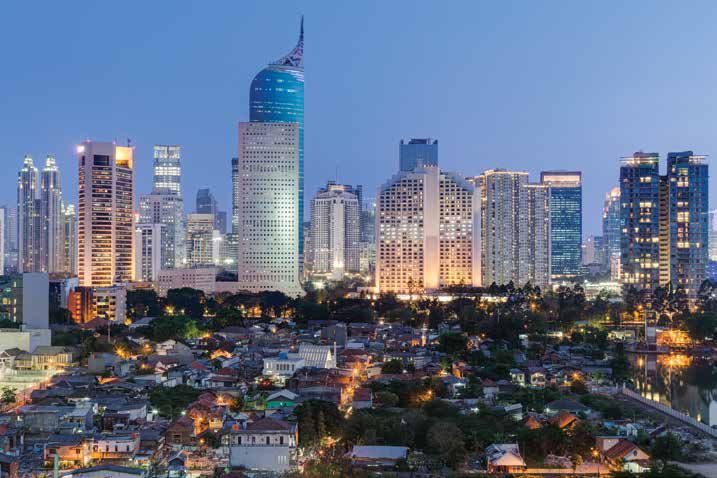
Hotel Destinations - Indonesia 5

   Accommodation demand growth induced by                                           large-scale events
 2018 Asian Games
 Several factors contributed to the overall growth in demand             surge in accommodation demand, Jakarta’s upscale/luxury
 in 2018, including the quadrennial Asian Games where                    and midscale hotels registered significant y-o-y increases in
 Jakarta and Palembang were the joint host cities. As event              RevPAR in August of 40.9% and 48.2%, respectively.
 organisers, officials, coaches and athletes geared up for
 the multi-sport event, which began on 18 August 2018,                   A similar trend was observed in April 2015 when Jakarta was
 international visitor arrivals to Jakarta began to peak                 the host city for the 60th Anniversary of the Asian-African
 approximately one month prior to the event. In July, visitor            Summit. During the month of April 2015, the upscale/luxury
 arrivals rose by 15.0% y-o-y to about 321,000, the highest              and midscale hotels segments recorded increases in RevPAR
 the city has ever recorded in any month. During the event               of 36.6% and 16.3%, respectively. The greater increase in the
 in August and September, visitor arrivals rose by 9.8% and              upscale/luxury segment was most likely due to the profile of
 14.0% y-o-y, respectively.                                              the delegates who attended the summit, which comprised
                                                                         mainly of leaders and delegates of the Asian and African
 Such large-scale events have proven to have positive                    nations.
 impacts on hotel trading performance. In relation with the

                                             Jakarta Upscale/Luxury Hotels RevPAR
                                     Asian-African Summit                               Asian Games
                                     22 to 23 April 2015                            18 Aug to 2 Sep 2018
RevPAR (IDR)

                                        +36.6% y-o-y
                                                                                        +40.9% y-o-y

               Jan       Feb   Mar          Apr          May      Jun        Jul            Aug           Sep       Oct         Nov          Dec
                                              2018              2017           2016                    2015
   Source: STR, JLL

                                                       Jakarta Midscale Hotels RevPAR

               +16.3%          Apr 2015
                               Asian-African Summit                                +48.2%                       Aug 2018
                                                                                                                Asian Games
                      y-o-y                                                                 y-o-y

 2018 International Monetary Fund (IMF) and World Bank Meeting
 Bali played the host city for the 2018 IMF-World Bank meeting            accommodation demand, resulting in y-o-y spikes in RevPAR
 in October 2018, where more than 36,000 delegates and                    across all hotel chain scales.
 participants attended the event.
                                                                           Bali Hotels RevPAR, October 2018
 During the event in October 2018, Bali received more
                                                                                    Luxury                                +58.1%
 than 517,000 international visitors, 11.4% higher than
 the year before and was the highest ever recorded in that                         Upscale                                +79.4%
 particular month. Correspondingly, this led to an increase in                     Midscale                               +60.1%
                                                                          Source: STR
6 Hotel Destinations - Indonesia

                      Expansion of airport infrastructure amidst soaring aviation business

  #2                  According to the International Air Transport
                      Association’s 2018 Annual Review, 7.8 billion people
                      are forecasted to be travelling across the globe
                                                                                  government plans to build a new airport
                                                                                  approximately 15 kilometres north of SHIA. A
                                                                                  feasibility study on the new airport in Jakarta is
                      by 2036. Of these, close to half are expected to be         expected to conclude by end-2019 and will cost
                      travelling to, from and within the Asia Pacific region.     an estimated USD7.0 billion to construct. When
                      With the forecasted increase in air traffic across the      completed, the airport will be able to handle up to
                      region, several countries are expanding their airport       70.0 million passengers per annum.
                      handling capacities in anticipation of the surge in
                      travel demand. Indonesia, with Jakarta and other            Other notable airport expansions in Indonesia:
                      regional airports such as Australia, China, Japan,          • Expansion of Bali's I Gusti Ngurah Rai International
                      Maldives, Singapore, South Korea and Thailand, is             Airport: The expansion includes aprons in the
                      one of the latest countries to expand its passenger           western and eastern sides of the airport to allow
                      handling capacity.                                            for more parking areas for the larger aircrafts. The
                                                                                    airport handled around 24.0 million passengers in
                      To cope with the rapid rise in travellers, Soekarno-Hatta     2018 and is nearing its total handling capacity of
                      International Airport (SHIA) opened a new terminal in         25.0 million.
                      late-2016 and has planned a fourth terminal and a third
                                                                                  • New Bali airport: As passenger traffic to one of
                      runway. In addition, Terminals 1 and 2 will be expanded
                                                                                    Indonesia’s most famous islands continues to grow,
                      to increase passenger handling capacity to 25.0 million
                                                                                    Bali is also planning a new airport in the north of
                      from 9.0 million each.                                        the island, which will be designed to accommodate
                                                                                    up to 32.0 million passengers annually to relieve
                      The expansion of SHIA in Jakarta is expected to
                                                                                    congestion at I Gusti Ngurah Rai International Airport
                      have a knock-on positive effect on the tourism and
                      hospitality industry in the country. In addition to         • Kertajati International Airport: The second largest
                      growing travel to Jakarta, SHIA aims to serve as the          airport after SHIA, the Kertajati International Airport
                      springboard for international travellers to Indonesia’s       is located about 80 kilometres off Bandung and
                      growing collection of tourism destinations.                   became operational in 2018. The airport currently
                                                                                    serves approximately 5.6 million passengers
                      Apart from the existing SHIA and Halim                        annually and has a maximum passenger handling
                      Perdanakusuma International Airport, the                      capacity of 18.0 million.

                      Tourism a driver of economic growth in Indonesia
                      According to the World Travel & Tourism Council, Indonesia's Travel & Tourism GDP is growing twice as fast as
                      the global average.

                                                    Travel & Tourism Contribution to Indonesia's GDP

                                      2017                                  2018                                   2028

                          USD 58.9                                  USD 62.6                           USD 115.8
                                      billion                               billion                                billion
                                                      +7.8% y-o-y                        +6.4% per annum
                                                                                         from 2018 to 2028

                      Source: World Travel & Tourism Council
Hotel Destinations - Indonesia 7

     Indonesia government sets aside IDR420.5 trillion for infrastructure projects

#3   Whilst the "10 New Balis" identified have great
     potential in attracting tourists, tourism growth to-
     date has been mostly challenged by accessibility and
                                                               The 2019 budget includes the construction of new
                                                               and unfinished projects such as road building and
                                                               maintenance; railway facilities and light rail transits;
     infrastructure concerns.                                  and airport construction. Should the construction of
                                                               such infrastructure projects materialise, it will provide
     As infrastructure remains one of the top priorities,      great benefit to the tourism industry.
     the Minister of Finance for Indonesia, Sri Mulyani
     Indrawati, announced in August 2018 that the State
     has set aside IDR420.5 trillion (around USD29 billion)
     for infrastructure projects in 2019. This translates
     to a 2.4% y-o-y increase in the State’s Budget for
     infrastructure, which represents about 17.2% of total
     government spending.

     Indonesia submits bid for
#4   2032 Olympic Games
     In February 2019, Indonesia officially submitted its bid for
     the 2032 Olympic Games which will take place after Tokyo
     (2020), Paris (2024) and Los Angeles (2028). Indonesia
     is expected to compete with other countries that have
     likewise expressed interest to host the Olympic Games,
     such as Australia, Germany, India, and a joint bid by North
     and South Korea.

     Should Indonesia’s bid be successful, it is expected to
     positively impact the tourism and hospitality industries.
     The ripple effects of hosting such a high-profile sporting
     event is evident in Japan, which is gearing up for the
     2019 Rugby World Cup and the 2020 Olympic Games. In
     the lead up to these events, investment momentum has
     been gathering pace over the past few years as investors
     capitalise on the anticipated, ongoing tourism boom.
     Correspondingly, this has also translated to improved
     hotel trading performance as accommodation demand
     gradually increases in the build up to these events.

     The strong publicity surrounding the Olympic Games
     could potentially trickle down to increased market
     liquidity as investors’ interests heighten. Indonesia could
     see an increase in investment activity, particularly from
     foreign investors, in the years leading up to the games if
     Indonesia indeed becomes successful in its bid.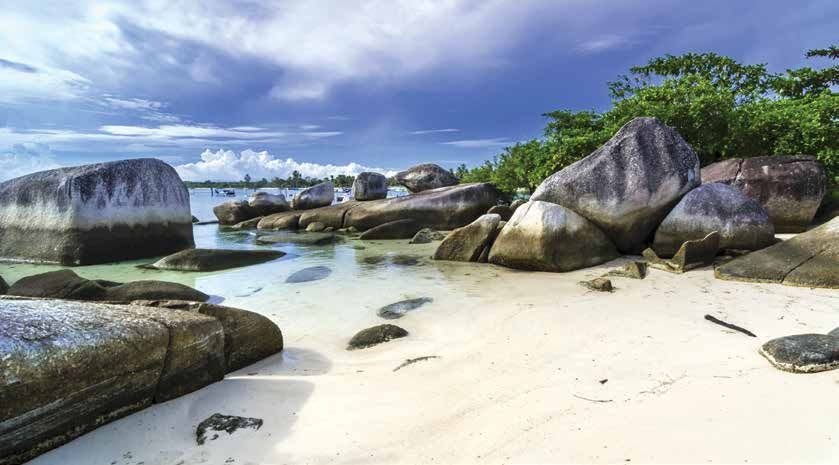
8 Hotel Destinations - Indonesia

   #5                     Indonesia, Where Next

Labuan Bajo
Listed as one of the “10 New Balis”, Labuan Bajo is located              As part of the government’s plan to develop Labuan Bajo into
on the western tip of East Nusa Tenggara province on the                 one of the “10 New Balis”, developing Komodo Airport into a
island of Flores. Labuan Bajo is known for its unique pink               facility with direct international flights has become one of the
sand beaches and rugged terrain that offer beautiful sunset              government’s top priorities.
views. It is also most famous for Komodo National Park
which houses a population of wild Komodo dragons, the                    In 2018, the Transportation Ministry launched a tender for
world’s largest living lizard. The national park was declared a          the expansion and operation of Komodo Airport, which will
UNESCO World Heritage Site in 1991. Other popular activities             require an estimated investment of IDR3 trillion (around
for visitors include diving and snorkelling due to its crystal           USD200 million). The scope of the public-private partnership
clear waters and mountain trekking atop Padar Island.                    will include the construction, operation and facility
                                                                         maintenance of the airport. According to the Ministry, about
According to the country’s Environment and Forestry Ministry             20 investors submitted bids, with the majority being
in 2018, there were more than 10,000 monthly visitors to the             foreign investors.
Komodo National Park of which, about 95% were foreigners.
In a bid to maintain the stability of the park’s ecosystem,              To achieve the forecasted increase in visitor arrivals, the
there are plans to reduce the number of visitors for long-term           aircraft runway will be extended to allow the airport to
sustainability of one of Indonesia's treasures.                          accommodate larger aircrafts, whilst the airport terminals and
                                                                         its facilities will also be expanded.
Labuan Bajo is accessible by air via the Komodo Airport,
formerly known as the Mutiara II Airport. As at March 2019,              In anticipation of future demand, notable recent hotel
there are 99 direct flights from eight Indonesian cities to              openings include the 205-room Ayana Komodo Resort and
Labuan Bajo, namely Jakarta, Surabaya, Bali, Lombok,                     the 25-room Sudamala Resort Seraya. Marriott International
as well as Bajawa, Ende, Maumere and Pupang which are                    also has its eye on the emerging tourist destination and will
located in East Nusa Tenggara.                                           open a 158-room Courtyard by Marriott Labuan Bajo Komodo
                                                                         Resort in 2021.

                15                                      42                    42                                      99
                                                                                                                   weekly flights
        weekly flights                              weekly flights       weekly flights
                                                                                                                  to Labuan Bajo
            Jakarta                                     Bali         Other Indonesian cities

Source: Flightrader24 (accurate as at March 2019)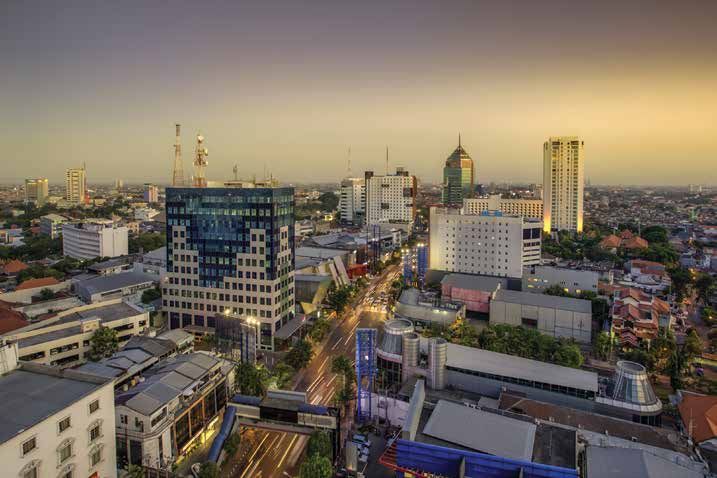
Hotel Destinations - Indonesia 9

Belitung
Nicknamed the “Maldives of Indonesia” for its clear blue                      Notable recent resort openings include the 128-room Santika
waters and sandy beaches, Belitung is an island that is                       Premiere Beach Resort Belitung and the 77-room Swiss-
located on the east coast of Sumatra which has also been                      Belresort Tanjung Binga Belitung. In the past two years,
identified as one of the “10 New Balis” due to its potential as               several OYO-branded hotels have also opened, such as OYO
a beach resort destination.                                                   358 Hotel Martani Belitung, OYO 399 Kelayang Beach Hotel
                                                                              and OYO 503 Hotel Belitong.
Served by the HAS Hananjoeddin International Airport,
Belitung is less than an hour’s flight away from Jakarta and                  Belitung is envisaged to welcome new resorts in the coming
about a 90 minutes’ direct flight from Singapore. In 2018,                    years, including the opening of Sheraton Belitung Resort in 2020
Garuda Indonesia introduced four weekly direct flights                        and Mercure Belitung Tanjung Tinggi Beach Resort in 2021.
between Singapore and Belitung.

As at March 2019, there are a total of 107 weekly scheduled
flights between Belitung and Pangkal Pinang City, Jakarta
and Singapore.

                                                                   4 weekly
                                                                   flights
                                                                  Singapore

                                                                                                          107 weekly
                                                    Sumatra
                                                                                                            flights
                                                      33 weekly         Pangkal
                                                       flights      Pingang City

                                                                                               Belitung

                                                                                           70 weekly
                                                                                            flights
                                                                                     Jakarta

Source: Flightrader24 (accurate as at March 2019)
10 Hotel Destinations - Indonesia

Indonesia Key Tourism Statistics

                                                                         y-o-y Growth

 Total International Visitor Arrivals             2018      15,806,191    +12.6%

 International Accommodation Guests *             2017 **   12,414,940    +8.3%

 Domestic Accommodation Guests *                  2017**    70,380,700    +11.3%

 Average Occupancy Rate
 (Classified Hotels) (%)                          2018        57.1%       +1.4%

 Average Length of Stay
 (Foreign Guests in Classified Hotels)            2018         2.83      -0.05 days
Source: BPS Indonesia
*Accommodation guests in classified hotels only
**Latest data available
Hotel Destinations - Indonesia 11
Quick Facts (2018)
International Visitors Top 5 Source Markets by Hotel Room
by Air (2018) Air / y-o-y Growth Supply Growth
(Estimated)
Mainland
▲ 6.0 million Australia India UK Japan
Bali China 2019: 3.7%
(+6.1% y-o-y) 19.3% / 5.8% / 4.5% / 4.3% /
22.4% / 2019 to 2022: 0.8%
+6.9% +29.9% +11.1% +3.4%
-1.7%
Mainland
▲ 2.8 million Malaysia Japan Singapore Saudi
Jakarta China 2019: 2.9%
(+2.3% y-o-y) 17.9% / 11.8% / 11.2% / Arabia
20.4% / 2019 to 2022: 1.9%
+0.9% -17.2% -4.2% 8.7% /
+2.4%
-8.1%
Singapore Mainland
▲ 322,964 Malaysia Taiwan Thailand
Surabaya China 2019: 12.3%
(+30.7% y-o-y) 21.1% / 9.1% / 2.5% / 2.2% /
5.0% / 2019 to 2022: 1.3%
+28.0% +20.5% -14.2% -17.4%
-8.2%
Malaysia Singapore India Japan China
▼ 155,371 2019: 3.0%
Bandung (-6.9% y-o-y) 69.0% / 18.1% / 1.5% / 0.9% / 0.8%* /
2019 to 2022: 4.0%
-10.8% -10.4% +42.1% -5.2% -12.2%*
Malaysia Singapore France China USA
▼ 138,600 2019: 2.8%
Yogyakarta (-4.9% y-o-y) 49.1% / 12.6% / 4.5% / 2.7% / 2.3%* /
2019 to 2022: 2.6%
+35.6% +18.6% +34.9% +33.6% +26.3%*
Mainland
Malaysia Singapore UK Korea
▼ 78,930 China 2019: 6.9%
Lombok (-36.0% y-o-y) 44.3% / 4.3% / 4.0% / 3.6%* /
6.6% / 2019 to 2022: 5.9%
+10.6% -8.1% +27.5% +89.1%*
+99.5%
Source: BPS Indonesia, JLL
*2017 is the latest available data12 Hotel Destinations - Indonesia
Jakarta
Quick Facts (2018/2019) Tourism
• International visitor arrivals to Jakarta by air rose by 2.3% y-o-y to 2.8 million in 2018. The
208k (-0.5% y-o-y) steady growth was attributed to the government’s visa waiver scheme introduced in 2015, as
International Visitor Arrivals by Air well as the 2018 Asian Games whereby Jakarta was the joint hose city with Palembang.
(YTD Jan 2019)
• As at YTD January 2019, international visitor arrivals declined marginally by 0.5%
2.83 days (+0.22 days) y-o-y to 208,450.
ALOS (2018)
• 5-year CAGR (2013 to 2018) for international visitor arrivals by air: 4.7%
56.9% (-1.5% y-o-y) • Domestic accommodation guests (2017; latest available data): 28.8% y-o-y growth to 10.6
million (85% of the total accommodation guests in classified hotels).
OCC (YTD Mar 2019)
Demand
IDR 2.04 mil (+2.5% y-o-y) • Mainland China remains the top source market for Jakarta in 2018, accounting for about
ADR (YTD Mar 2019) 20.4% of the international visitor arrivals. This was followed by Malaysia (17.9%), Japan
(11.8%) and Singapore (11.2%).
IDR 1.16 mil (+1.0% y-o-y) • Whilst corporate tourism constitutes majority of the tourism demand to Jakarta, the city
RevPAR (YTD Mar 2019) is also a popular stopover and transit hub for international visitors travelling to other
destinations in Indonesia.
• Around 80% of all visitors to Jakarta stay in classified hotels, underscoring the strong demand
for quality accommodation in the city.
Notable Openings
Alila SCBD Supply
227 rooms • According to BPS, there is a total of 326 classified hotels providing 46,899 rooms in 2018.
Aloft Jakarta Wahid Hasyim
• JLL estimates that 750 and 1,756 classified hotel rooms were added to the existing supply in
180 rooms
2017 and 2018, respectively. In 2019, we forecast classified room supply to increase by 2.9%
Best Western Senayan Hotel
y-o-y, or approximately 2,139 rooms.
137 rooms
InterContinental Pondok Indah • From 2019 and 2022, classified room supply is projected to grow at a CAGR of about 1.9%.
311 rooms
Swiss-Belhotel Rasuna Epicentrum
Outlook
323 rooms • Incoming hotel supply is expected to add pressure to Jakarta’s hotel trading performance in
the short-term, as the market continues to absorb the new supply of 2017 and 2018.
• Expected greater connectivity along the Sudirman corridor is expected to revitalise hotel
submarkets in conjunction with the opening of the MRT.
Selected Upcoming Hotels • In the medium- to long-term, trading performance is expected to remain positive, as foreign
Park Hyatt Jakarta (2019)
and local investment in the country’s capital increases amidst significant reforms from the
St Regis Jakarta (2019) government.
The Langham Jakarta (2019)
Waldorf Astoria Jakarta (2020)
Parkroyal Jakarta (2022)
Source: BPS Jakarta, BPS Indonesia, JLL, STR (Mar 2019)
Note: Jakarta trading performance refers to Upscale/Luxury segment, comprising 19 hotels in the basket.
ADR – Average Daily Rate, RevPAR – Revenue per available room, OCC – OccupancyHotel Destinations - Indonesia 13
Bali
Quick Facts (2018/2019) Tourism
• Regarded as one of Indonesia’s most famous islands amongst leisure travellers, Bali
452k (+31.1% y-o-y) continues to enjoy healthy growth in international visitor arrivals by air, increasing by 6.1%
International Visitor Arrivals by Air y-o-y to 6.0 million in 2018. The visitor growth was supported by the IMF-World Bank meeting
(YTD Jan 2019)
in October 2018, which saw more than 36,000 delegates and participants in attendance.
3.17 days (-0.05 days) • Air travel to Bali remains as the most popular mode of transport, comprising 99.3% of total
ALOS (2018) international visitor arrivals.
• Visitor growth to Bali continued on an uptrend as at YTD January 2019, extending its growth
58.4% (+6.0% y-o-y) by 31.1% y-o-y to 452,405 from 345,191.
OCC (YTD Mar 2019) • 5-year CAGR (2013 to 2018) for international visitor arrivals by air: 13.1%
• Total Domestic Visitors Arrivals (2017; latest available data): 1.1% y-o-y growth to 8.7 million
IDR 2.07 mil (+4.7% y-o-y) (60.5% of the total)
ADR (YTD Mar 2019)
Demand
IDR 1.21 mil (+11.1% y-o-y) • Mainland China remains as the top visitor source market for Bali, accounting for about 22.4%
of the total international visitors by air in 2018. This was followed by Australia (19.3%), India
RevPAR (YTD Mar 2019)
(5.8%) and the United Kingdom (4.4%).
• Visitors from India registered a strong y-o-y growth of 29.9% in 2018, mainly attributed to
Notable Openings the sound bilateral relations between Indian and the Indonesian governments, as well as an
Capella Ubud increase in direct flights connecting Bali and India.
22 rooms
• 5-star and 4-star hotels accounted for the majority of visitor stays in classified hotels in 2017
Element by Westin Bali Ubud (latest available data), accounting for approximately 38% and 33% of all classified guests
152 rooms
stays, respectively.
Fairfield by Marriott Bali Legian
160 rooms • Top Key Growth Markets – India (+29.9%), USA (+23.8%) and Singapore (+14.8%)
Kempinski Nusa Dua Bali
475 rooms
Supply
Renaissance Uluwatu • According to BPS, there is a total of 551 classified hotels providing 52,927 rooms in 2018.
207 rooms • According to the supply data tracked by JLL, 1,723 classified rooms were added in 2018.
Six Senses Uluwatu Bali • The classified room supply is forecasted to increase by 4.4% in 2019, which translates to
103 rooms approximately 2,326 rooms.
• From 2019 to 2022, classified room supply is projected to grow at a CAGR of 1.1%, whilst
Selected Upcoming Hotels taking into consideration that not all announced projects will materialise.
Andaz Bali (2019)
InterContinental Bali Canggu (2019)
Outlook
Jumeirah Bali (2019) • Recent improvements in air connectivity, notably from Europe and several Chinese cities, to
Ngurah Rai International Airport have helped to support the strong growth in international
Shangri-La Nusa Dua Resort &
tourism arrivals. We expect continued growth in arrivals from Mainland China, buoyed by
Spa Bali (2019)
more direct flights between key cities in China and Bali.
W Bali - Ubud (2020)
• In the short-term, we envisage quality hotel RevPAR to increase moderately, driven by
increases in occupancy.
Source: Bali Government Tourism Office, BPS Indonesia, JLL, STR (Mar 2019)
Note: Bali trading performance refers to Upscale segment, comprising 24 hotels in the basket
ADR – Average Daily Rate, RevPAR – Revenue per available room, OCC – Occupancy14 Hotel Destinations - Indonesia
Lombok Surabaya
Tourism
• In 2018, Lombok experienced a significant decline in international • Surabaya experienced significant growth in international visitor
visitors by air of 36.0% y-o-y to 78,930, which was mainly attributed to arrivals by air, increasing by 30.7% y-o-y to 322,964 in 2018.
the natural disasters that occurred within the year. Government efforts to prioritise tourism development in Tengger and
• As at YTD January 2019, Lombok was still feeling the impact from Semeru in East Java is expected to benefit Surabaya, which is seen as
a series of national disasters as total international visitor arrivals a key gateway into East Java due to its international connectivity.
declined by 62.0% to 2,102 from 3,151 in the previous year. • As at YTD January 2019, Surabaya received a total of 23,872
• 5-year CAGR (2013 to 2018) for international visitor international visitor arrivals, reflecting a 10.6% decline from the 26,700
arrivals by air: 14.3% over the same period last year.
• Domestic accommodation guests (2017; latest available data): 6.6% • 5-year CAGR (2013 to 2018) for international visitor arrivals by air: 4.8%
y-o-y growth to 1.1 million (78% of total accommodation guests in • Total Domestic Visitors (2017; latest available data): 10.4% y-o-y
classified hotels) growth to 22.7 million (98.6% of total visitors)
Demand
• In 2017 (latest available data), Malaysia remained as the top • In 2018, Malaysia remained the top international source market for
international source market, accounting for 44.3% of the total Surabaya, accounting for about 21.1% of all international visitor
international visitor arrivals by air. This was followed by Mainland arrivals by air. This was followed by Singapore (9.1%) and the
China (6.6%) and Singapore (4.3%). Mainland China (5.0%).
Key Growth Markets (2017; latest available data) Key Growth Markets (2018)
Mainland China +99.5% Malaysia +28.0%
Korea +89.1% Singapore +20.5%
Germany +40.2%
Supply
• According to BPS in 2017 (latest available data), there is a total of • According to BPS in 2017 (latest available data), there is a
65 classified hotels providing 4,118 rooms. total of 94 classified hotels providing 13,267 rooms.
• From 2019 to 2022, classified room supply is projected to grow at • From 2019 to 2022, classified room supply is projected to
a CAGR of about 5.9%. These include Club Med Lombok, Pullman grow at a CAGR of 1.3%, whilst taking into consideration
Mandalika Beach Resort Lombok, Swiss-Belinn Lombok and The that not all announced projects will materialise. These
Legian Sire Lombok. include DoubleTree by Hilton Surabaya, Grand Mercure
Maha Cipta Surabaya, Swiss-Belhotel Darmo Surabaya and
Westin Surabaya.
Outlook
• The Mandalika Project, one of the largest of its kind in South East • Apart for the recent government efforts to focus on tourism
Asia, is expected develop Lombok into a key tourist destination, and development in East Java, the completion of the planned and
boost tourism arrivals to the island. ongoing infrastructural developments, which ranges from toll
roads to an airport expansion, are expected to further boost overall
connectivity to Surabaya.Hotel Destinations - Indonesia 15
Bandung Yogyakarta
Tourism
• International visitor arrivals by air to Bandung fell by 6.9% y-o-y to • International visitor arrivals by air posted a y-o-y decline of 4.9% to
155,371 in 2018. 138,600 in 2018, on the back of a stronger base in 2017.
• As at YTD January 2019, international visitor arrivals largely remained • 5-year CAGR (2013 to 2018) for international visitor
unchanged y-o-y at 11,351 visitors. arrivals by air: 10.0%
• 5-year CAGR (2013 to 2018) for international visitor arrivals by air: • Domestic Visitors (2017; latest available data): 55.0% y-o-y growth to
-2.5% 6.5 million (94.9% of total visitors)
• Domestic Visitors (2016; latest available data): 17.9% y-o-y decline to
4.8 million (96.5% of total visitors)
Demand
• Malaysia remained the top source market for Bandung, accounting • Malaysia remained as the top source market for Yogyakarta in
for 69.0% of all international visitor arrivals by air in 2017 (latest 2017 (latest available data), accounting for about 49.1% of all
available data). This was followed by Singapore (18.1%) international visitor arrivals by air. This is followed by Singapore
and India (1.5%). (12.6%) and France (4.5%).
Key Growth Markets (2017; latest available data) Key Growth Markets (2017; latest available data)
India +42.1% India +50.4%
Australia +31.9% Malaysia +35.6%
Korea +10% France +34.9%
Supply
• According to BPS in 2017 (latest available data), there is a total of • According to BPS, there is a total of 117 classified hotels providing
118 classified hotels providing 10,004 rooms. 26,141 rooms in 2017 (latest available data), with no notable
• From 2019 and 2022, classified room supply is estimated to completions in 2018.
grow at a CAGR of 4.0%. These include Citadines Kings Bandung, • From 2019 to 2022, classified room supply is projected to grow at
MGallery Ciwaruga Botanica and Pullman Bandung City Centre. a CAGR range of 2.6%. These include Citadines Punaka Yogyakarta
and Novotel Suites Yogyakarta Malioboro.
Outlook
• Bandung is increasingly being positioned as a leading innovation • Given Yogyakarta’s proximity to Borobudur, planned infrastructural
hub for creativity and entrepreneurship. The proposed Bandung works, including the Yogyakarta-Bawen toll road, will enhance the
Technopolis is envisioned to be the centre of Indonesia’s tech city’s accessibility. Furthermore, the tourism sector is set for a further
industry and aims to attract foreign direct investment from boost, with Borobudur selected to be amongst the "10 New Balis”.
multinational corporations. In turn, this is expected to translate to
increased accommodation demand, especially from
corporate guests.Talk to us about your hotel ambitions
Mike Batchelor Giuliano Esposito
Chief Executive Officer Senior Vice-President
Strategic Advisory and Asset Management
Asia
Asia
mike.batchelor@ap.jll.com
giuliano.esposito@ap.jll.com
Sashi Rajan Corey Hamabata
Senior Vice-President Senior Vice-President
Strategic Advisory and Asset Management Investment Sales
Asia Asia
sashi.rajan@ap.jll.com corey.hamabata@ap.jll.com
Tay Sze Min
Associate Research
Asia
szemin.tay@ap.jll.com
JLL’s Hotels & Hospitality Group has completed more transactions than any other hotels and hospitality real estate advisor over the last five years, totalling more
than $68 billion worldwide. Between negotiating the world’s most extraordinary, enticing, and profitable property deals, the group’s 350-strong global team also
closed more than 4,400 advisory, valuation and asset management assignments. Investors worldwide turn to JLL to shape their strategies, tailor their portfolios
and maximize the value of their assets. We are recognized as the global leader in real estate services across hospitality properties of all shapes and sizes.
Our expert advice is backed by industry leading research. We apply our broad spectrum of hotel valuation, brokerage, asset management and consultancy services
through every phase of the hotel lifecycle. We have helped more hotel investors, owners and operators achieve high returns on their assets than any other real
estate advisor in the world. Whether you are looking for a hotel or you’re ready to sell, we’ll use our capital markets expertise, hospitality industry knowledge and
global relationships to put the right parties together and execute a bespoke deal that exceeds your objectives.
For more news, videos and research from JLL’s Hotels & Hospitality Group, please visit our website, or view our e-magazine The Hotel Investor, available for iPad.
www.jll.com/hospitality
© 2019 All rights reserved. All information contained herein is from sources deemed reliable; however, no representation or warranty is made to the accuracy thereof.You can also read