2017 FUTURE OF FOOD RETAILING - Willard Bishop
←
→
Page content transcription
If your browser does not render page correctly, please read the page content below

2017
FUTURE OF
FOOD RETAILING
©2017 Inmar, Inc. All rights reserved.

The materials herein may be quoted or
referenced without written permissions
provided any mention of its contents is
sourced as Inmar Willard Bishop Analytics.

Inmar
635 Vine Street
Winston-Salem, NC 27101
(866)440-6917
solutions@inmar.com

Disclaimer:
These documents do not constitute
legal advice. Inmar advises all reviewers
to seek advice from legal counsel based
on specific business needs.
Anyone who has redeemed a coupon, filled a
prescription or returned a product, has touched
Inmar. We apply technology and data science to
improve outcomes for consumers and those who
serve them. As a trusted intermediary for over
35 years, we have unmatched access to billions
of consumer and business transactions in real
time. Our analytics, platforms and services enable
engagement with shoppers and patients, and
optimize results.
Content

About this Report                               1

Highlights                                      2

Channel Trends                                  2

Format Trends, 2016                             3

Understanding the Previous Year                 4

Traditional Grocery by Format                   4

Convenience                                     4

Non-Traditional Grocery by Format               5

eCommerce                                       5

Industry Outlook: 2021                          6

Effect of Inflation                             7

Advancements in eCommerce                       8

Time to Get Personal                            9

The Evolution of The Future of Food Retailing   10

Retail Segment Definitions                      10

Primary Sources                                 11

Contacts                                        12
About this Report
Inmar Willard Bishop Analytics has published The Future of Food Retailing since 1983. The report takes a deep dive
into the food retailing industry in order to identify and quantify market dynamics, trends, and behaviors. The report
recaps the previous year’s activities and provides projections for the next five years in terms of market and dollar share
across the following channel formats:

▶ Traditional Grocery Formats
Traditional Supermarkets | Fresh Format | Limited Assortment | Super Warehouse | Other (Small) Grocery

▶ Non-Traditional Grocery
Wholesale Club | Supercenter/Mass | Dollar | Drug | Military

▶ Convenience Stores
With Gasoline | Without Gasoline

▶ eCommerce (Food and Consumables)
Combined Channels

                                                                                   2017 Future of Food Retailing • 1 ▶
Highlights
In 2016, the landscape of food retailing continued to Natural and organic products, having reached nearly
be reshaped by mergers and acquisitions. The biggest every outlet, have become table stakes. However,
acquisition in traditional grocery was Ahold’s acquisition many retailers continue to have great success by
of Delhaize. However, Walmart’s $3.3 billion acquisition bridging natural and organic goods with an improved
of Jet.com, a pure-play etailer, overshadowed smaller price point through their private label offerings.
acquisitions, regardless of trade channel.
Another key change agent was the rise of the millennial Digital commerce continues to impact the majority
as the total number of these digitally-savvy consumers of food-related purchases, whether through online
surpassed baby-boomers as the largest consumer shopping, click-and-collect, or as an information source
segment. that is reshaping the path-to-purchase.
Source: Richard Fry, “Millennials overtake Baby Bookers as America’s
largest generation” Pew Research Center, April 25, 2016.
Channel Trends
In 1988, the Traditional Grocery channel still commanded the lion’s share of sales generated from grocery and consumable
products. Since then the channel has lost dollar share to the Non-Traditional Grocery channel, which continues to be led
by Supercenters and Wholesale Club stores such as Walmart, Costco and Sam’s Club.
Dollar Share by Channel
8%
2% 16% 16% 15% 16%
34% 37% 39% 40%
90% 50% 48% 46% 44%
1988 2006 2009 2015 2016
Traditional Grocery Non-Traditional Grocery Convenience Stores
(Totals may vary slightly due to rounding) Source: Inmar Willard Bishop Analytics
2017 Future of Food Retailing • 2 ▶Format Trends, 2016
Format Comparisons At A Glance: 2016 Versus 2015 (Grocery and Consumables)
Number of Stores Dollar Share Annual Sales
Gain/
2016
Trade Channel % Chg Loss % Chg
2016 2016 Annual Sales
vs. 2015 vs. vs. 2015
(Millions)
2015
Total Traditional Grocery 40,498 -3.5% 44.6% -1.2% $542,724.7 -4.1%
Traditional Supermarkets 25,380 -5.8% 36.2% -2.3% $440,135.8 -5.9%
Fresh Format 1.547 7.5% 2.3% 0.9% $27,881.7 3.8%
Limited Assortment 4,093 3.8% 3.1% 0.2% $37,272.6 5.8%
Super Warehouse 730 5.1% 1.9% 0.1% $23,617.0 5.1%
Other (Small Grocery) 8,748 0.3% 1.1% 0.0% $13,817.5 3.0%
Total C-Stores 161,052 0.2% 15.9% 0.5% $194,045.9 3.2%
Convenience (w/gas)* 130,755 0.2% 13.6% 0.4% $165,905.5 3.2%
Convenience (w/o gas) 30,297 0.2% 2.3% 0.1% $28,140.4 3.2%
Total Non-Traditional Grocery 62,634 2.1% 39.5% 0.8% $480,228.3 2.6%
Wholesale Club 1,472 1.8% 9.0% 0.2% $109,183.4 2.2%
Supercenter 4,106 2.1% 18.8% 1.0% $228,331.2 5.6%
Dollar 30,496 4.3% 2.8% 0.1% $33,757.0 4.2%
Drug 23,607 0.5% 5.1% 0.1% $61,997.6 1.5%
Mass 2,775 -7.3% 3.5% -0.5% $42,626.8 -12.5%
Military 178 -1.7% 0.4% 0.0% $4,332.3 -5.5%
(Totals may vary slightly due to rounding) Source: Inmar Willard Bishop Analytics
Format Ranking by Percentage 2016 Growth/Decline Versus 2015
30
24.4%
25
Traditional Grocery Non-Traditional Grocery Convenience Stores eCommerce
20
15
10
5.8%
5.6%
5 5.1% 4.2%
3.8% 3.2% 3.0% Traditional
2.2% 1.5%
Military
Supermarkets Mass
0
eCommerce Limited Supercenter Super Dollar Fresh Convenience Other Small Wholesale Drug
Assortment Warehouse Format Store Grocery Club
-5
-5.5% -5.9%
-12.5%
Source: Inmar Willard Bishop Analytics
2017 Future of Food Retailing • 3 ▶Understanding the Previous Year
Predicting future market conditions requires a keen understanding of historical measures and insights into evolving
shopper behaviors. This is particularly useful for predicting areas such as eCommerce, which has limited historical data.
As informational assets increase in the digital world, separating digitally-placed orders and digitally-influenced orders
from in-store purchases will create new challenges. Click-and-collect (on premise) and in-store pickup (inside the store)
may further blur the lines between online and in-store purchasing behaviors.
Traditional Grocery by Format
Overall, the Traditional Grocery channel sales decreased 4.1% to $543 billion in 2016. Market share also declined 1.2%
share points, bringing the channel’s total market share to 44.6%.
Traditional Supermarkets Limited-Assortment
The channel’s decline was led by the Traditional Limited-Assortment stores, with sales gains of 5.8%, held
Supermarkets format, which lost 2 share points and the top spot in terms of percentage growth (excluding
5.9% of sales. Traditional Supermarkets ended 2016 eCommerce). In 2016 the format added 155 stores and
with 36.2% dollar share or $440 billion in sales. reached sales of $37.3 billion.
Note: All formats are measured by the amount of food and The growth was led by German-based Aldi, which is on
consumables sold within the three channels (Traditional pace to have 2,000 stores in the U.S. by the end of 2018.
Grocery, Non-Traditional Grocery, and Convenience Lidl, another German-based deep-discounter, will add
Stores). even more growth as they enter the U.S. market.
Fresh Format Super Warehouse
Fresh Format stores continued to experience substantial Super Warehouse, despite its small base, performed well
sales growth, with an increase of 3.8% to $27.9 billion. in 2016 with across-the-board gains in a number of stores,
The number of Fresh Format stores increased 7.5%, market share, and sales. In terms of percentage growth,
reaching more than 1,500 locations. the format ranked second with a percentage increase of
Established banners like Sprouts Farmers Market 5.1%; just behind Limited Assortment’s 5.8%. Sales for
and Earth Fare Healthy Supermarket continue to add the Super Warehouse format totaled $23.6 billion.
stores and increase shopper engagement using digital
technologies such as mobile apps, digital coupons, and Other (Small Grocery)
personalized offers.
Growth in Fresh Format was also driven by Traditional Market share for Other (Small Grocery) remained flat;
Supermarket banners converting to Fresh Format. however, sales grew by 3.0%, reaching $13.8 billion.
Banners making the transition included Byerly’s, Lowes
Foods, Lunds, and Mariano’s.
Convenience
Convenience Stores enjoyed sales gains of 3.2% (with gas and without gas) despite remaining somewhat flat in
number of stores (+0.2%), and market share, which was up 0.4% with gas and 0.1% without gas. The increase in sales
was driven largely by an expanded assortment featuring more fresh and prepared foods.
Source: Inmar Willard Bishop Analytics
2017 Future of Food Retailing • 4 ▶Non-Traditional Grocery by Format
Sales in the Non-Traditional Grocery channel reached $480 billion, an increased of 2.6%. The top-performing formats
in 2016 were Supercenter and Dollar Store with sales gains of 5.6% and 4.2%, respectively. Conversely, two formats
ex-perienced significant sales declines: Mass -12.5% and Military -5.5%.
Wholesale Club Dollar/Extreme Value
Wholesale Club sales increased 2.2% to $109.2 billion. The Dollar format continued its strong sales growth with
Costco’s comparable percentage sales growth (U.S. mar- a 4.2% increase to $33.8 billion. Store counts reached
ket) remained on par with 2015 at 4%, (Motley Fool) net 30,496, an increase of 4.3%, while market share grew by
sales for Costco increased 2.1%, while net income fell by 0.1%.
1.14%. (Costco Wholesale 2016 Annual Report)
In 2016, food and consumables was the largest segment
Comparable sales for Sam’s Club in the U.S. (including within the format, ranging from 50%-75% of total reve-
gas) decreased 3.2%, despite increases in the number nue. (Dollar Tree/Family Dollar 2016 Annual Report and
of stores from 647 in 2015 to 655 in 2016. (Walmart 2016 Dollar General’s 2016 Annual Report)
Annual Report). Revenue for BJ’s Wholesale Club, the
nation’s third-largest wholesale club retailer, was down Drug
6.6% versus 2015. (Google Finance)
Food and consumable product sales in Drug stores in-
Supercenter/Mass creased slightly to $62 billion; an increase of 1.5%. Store
counts and market share had modest increases of 0.5%
Supercenter sales were up 5.6% in 2016, reaching $228.3 and 0.1%, respectively.
billion. Store counts increased 2.1% to 4,106, while During the year, CVS continued its ongoing efforts to re-
mar-ket share grew by 1.0%. brand more than 1,600 Target pharmacies to CVS-brand-
Despite the continued growth of Supercenters, the Mass ed pharmacies. In addition to the store-witin-a-store
format experienced the sharpest decline of all model, seventy-nine Target clinic locations are being re-
channels and formats. Sales for the Mass Format were branded as MinuteClinics. (CVS Health)
down 12.5% and store counts decreased by 7.3%.
Military
The number of military outlets decreased by 1.7%. Sales
within the Military format declined 5.5%, accounting for
$4.3 billion in revenue during 2016.
eCommerce
eCommerce sales for food and consumables reached $33 billion in 2016, an increase of 24.4%. While eCommerce in
2016 accounted for approximately 4% of total sales, that number will increase exponentially as more retailers acceler-
ate their digital strategies and expand their omni-channel capabilities. For additional information pertaining to digital
commerce, please refer Advancements in Ecommerce on page 8.
(Inmar Willard Bishop Analytics, eCommerce SuperStudyTM)
2017 Future of Food Retailing • 5 ▶Industry Outlook: 2021
By 2021, dollar share for the Traditional Grocery Channel will decline to 43.6%, a decrease of 1.0%. Shares for Non-
Traditional Grocery will remain flat at 39.6%. The Convenience Store Channel will have an increase in shares,
reaching 16.8%. However, modest changes are often masked by large fluctuations occurring within the channel.
For example, the number of Traditional Supermarkets will decrease by 24.6%. This decline is offset by double-digit
growth in store counts for Fresh Format, Limited Assortment, and Super Warehouse formats.
Market Share and Store Count Forecasts (Grocery and Consumables)
2021 Change 2016
2016 2021 % Change in
Dollar in Dollar Store
Dollar Share Store Counts Store Counts
Share Share Counts
Total Traditional Grocery 44.6% 43.6% -1.0% 40,498 36,210 -10.6%
Traditional Supermarkets 36.2% 32.7% -3.5% 25,380 19,132 -24.6%
Fresh Format 2.3% 2.8% 0.5% 1,547 2,290 48.0%
Limited Assortment 3.1% 4.5% 1.4% 4,093 4,963 21.3%
Super Warehouse 1.9% 2.3% 0.4% 730 947 29.7%
Other (Small Grocery) 1.1% 1.2% 0.1% 8,748 8,878 1.5%
Total C-Stores 15.9% 16.8% 0.9% 161,052 162,836 1.1%
Convenience (w/gas)* 13.6% 14.4% 0.8% 130,755 132,203 1.1%
Convenience (w/o gas) 2.3% 2.4% 0.1% 30,297 30,633 1.1%
Total Non-Traditional Grocery 39.5% 39.6% 0.1% 62,634 70,407 12.4%
Wholesale Club 9.0% 9.7% 0.8% 1,472 1,613 9.6%
Supercenter 18.8% 19.7% 0.9% 4,106 4,560 11.1%
Dollar 2.8% 2.8% 0.0% 30,496 37,964 24.5%
Drug 5.1% 4.6% -0.5% 23,607 24,202 2.5%
Mass 3.5% 2.5% -1.0% 2,775 1,904 -31.4%
Military 0.4% 0.4% 0.0% 178 164 -8.1%
Total All Formats 100% 100.0% 264,185 269,453 2.0%
*Does not include gasoline sales.
Totals may vary slightly due to rounding. Source: Inmar Willard Bishop Analytics
2017 Future of Food Retailing • 6 ▶Industry Outlook: 2021
2021 Format Ranking by Projected Annual Percentage Growth/Decline
30
25.0%
25
Traditional Grocery Non-Traditional Grocery Convenience Stores eCommerce
20
15
10 8.0%
4.8% 4.5%
5 3.1% 3.0% 3.0%
2.6% 2.0% Traditional Mass
1.0% 0.9% Supermarkets
0
eCommerce Limited Fresh Super Supercenter Dollar Wholesale Other Small Convenience Drug Military -0.3%
Assortment Format Warehouse Club Grocery Store
-5
-5.2%
Effect of Inflation
Food inflation is expected to average 2.2% over the next five years. We believe that Traditional Supermarkets sales will
not keep pace, and the format will continue to lose market share as consumers spread their grocery-related purchases
across multiple channels and formats.
Projected Annual Percentage Growth vs. Inflation: 2016-2021
eCommerce (Food & Consumables) 25.0%
Limited Assortment 8.0%
Fresh Format 4.8%
Super Warehouse 4.5%
Supercenter 3.1%
Dollar 3.0%
Wholesale Club 3.0%
Other (Small) Grocery 2.6% Food Inflation Projected Annual GrowthRate: 2.2%
Convenience(without Gas) 2.0%
Convenience(with Gas) 2.0%
Drug 1.0%
Military 0.9%
-0.3% Traditional Supermarkets
-5.2% Mass
Source: Inmar Willard Bishop Analytics
2017 Future of Food Retailing • 7 ▶Advancements in eCommerce
In 2016, eCcommerce sales accounted for $33 billion (4%) of the $795 billion in food and beverage sales. By 2021, food
and beverage sales will grow to $930 billion, and online sales will account for 8% of sales, or $70 billion.
According to a recent report by the Food Marketing Institute and Nielsen, online food shopping may reach $100 billion by
2025. The report, “The Digitally Engaged Food Shopper,” states that approximately one-fourth of American households
currently purchase some groceries online and that 70% will engage in online food shopping within the next 10 years.
Rapid Adoption of Digital Commerce
Grocery eCommerce is likely to surpass these optimistic figures as food retailers come online faster than other retail
sectors have done in the past. This rapid adoption is being fueled by a number of factors.
For starters, there’s the size of the prize. Sales from food and consumables (across all channels) has surpassed the trillion
dollar mark. Any number followed by nine zeros garners attention, as even a small piece of a pie that size provides a
relatively stagnant industry with new growth opportunities.
Another key factor for rapid adoption is the Millennial, the first generation born into the digital age. Additionally,
Millennials are now the largest consumer segment and they’re in the grocer’s sweet-spot in terms of life stage. Many
have successfully advanced their careers, generating more disposable income. They are also in their child-bearing years,
and families with children spend as much as 60% more than two-person households.
Now add in “time” to complete the industry’s triple play: Disposable income, households with children, and time-
starved parents looking for ways to maintain a healthy life balance, as well as a healthier lifestyle. The result is a boon
for eCommerce whether through click-and-collect or home delivery.
New Solutions Through Advanced Analytics
Related Materials
Another critical factor is the ability to apply advanced analytics
to big data in order to deliver new solutions that extend beyond a
singular point-of-view. For example, data mining can now consider
solutions holistically, i.e., solutions that bridge promotions and
shopper behaviors, to supply chain efficiencies. These types of
robust analytics create more choices, and “choices” represent the
nucleus of effective omni-channel retailing.
eCommerce is a Basket Case
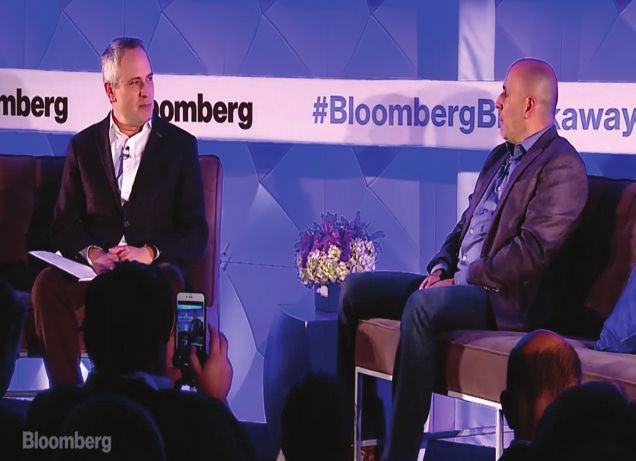
It’s true. eCommerce drives basket size and dollar ring. Below are The Impact of Amazon’s
a few pertinent facts from the Inmar Willard Bishop eCommerce Acquisition on Food Retailing
SuperStudyTM: An Inmar Willard Bishop Webinar
• Online orders are 4X-5X larger than brick-and-mortar orders
• Online orders average 47 units per basket and total
more than $150 before fees
• Ninety-percent of online orders are for “stocking-up”
• Online shopping frequency = 18 days
• Order size is consistent across core shopper segments
and households
• When shopping a retailer that offers eCommerce,
households that shop online and in-store spend Interview with Marc Lore, President
29% more than households shopping in-store only & CEO of Walmart eCommerce, U.S.
Source: Bloomberg
Source: Inmar Willard Bishop Analytics eCommerce SuperstudyTM
2017 Future of Food Retailing • 8 ▶Time to Get Personal
As mentioned previously, “choices” serves as the nucleus for developing effective and sustainable omni-channel
strategies. But the path to success is not as easy as simply providing more choices. Trading partners will fail if they
try to be all things to all consumers. The key to building market share and increasing loyalty requires one thing:
relevancy. All choices must be relevant to the target audience.
Relevancy must be reinforced at every touch-point along the path-to-purchase continuum. Social media content
must focus on relevant activities prior to the start of a purchase cycle. Assortment, merchandising (in-store and
online), pricing, promotions, and services must all be relevant in order to influence shopper behaviors. Missing the
mark in one or two areas will likely result in more “channel hopping,” which further diminishes loyalty.
Personalization Begins with Understanding Your Shopper
Personalization requires a relentless focus on shopper insights. However, this focus goes beyond the consumer’s wants,
needs, and desires. For example, Inmar’s 2017 Shopper Behavior Study revealed some interesting facts regarding digital
coupons. The study indicated that 53% of shoppers knew the store where they normally shop had a digital coupon
program - among these, 76% participated in the program. This simple fact creates significant opportunities to improve
digital engagement. Participation in the digital coupon program can nearly double simply by educating the 47% of
unaware shoppers. Once engaged, behavioral data can be mined when developing targeted and personalized offers.
Use actual purchase behavior(s) to deliver customized, unique offers to:
• Increase relevancy • Improve ROI
• Drive conversion and loyalty • Differentiate your banner/brand
Foundational Elements for Personalization
BIG DATA PROMOTION ORGANIZATIONAL STRUCTURE
Aggregate transactional data from Remove marketing and sales Develop a shopper-centric culture
all points-of-purchase boundaries to determine actual lift that embraces change
Integrate Consumer-Decision Trees Shift communication channels from Apply continuous improvement
Expand your knowledge of the traditional to digital (email, social measures across planning,
path-to-purchase (in-store, online, media, apps, etc.) execution, evaluation, and
and hybrid) Change your focus on competitive optimization
Quantify the impact of social pricing to generating highly- Look for opportunities beyond
influences relevant offers your immediate sphere
of influence (supply chain,
Deploy digital technologies that planning, etc.)
facilitate seamless engagement
2017 Future of Food Retailing • 9 ▶The Evolution of The Future of Food Retailing
Defining the U.S. Grocery Market (Grocery and Consumables)
The sales and SKU estimates for each of the 14 store Excluded from the estimates are:
formats include: • Clothing
• All grocery items • Electronics
• Non-edible grocery • Footwear
• Health and beauty items, including cosmetics and • Gasoline
general merchandise which includes, but is not • Hardlines
limited to: greeting cards and magazines • Jewelry
• Alcohol • Knickknacks
• Tobacco and some seasonal items • Prescription drugs
• Sporting goods
• Toys
Retail Segment Definitions
Traditional Grocery
Traditional Supermarkets Super Warehouse
Stores offering a full line of groceries, meat, and produce A high-volume hybrid of a large Traditional Supermarket
with at least $2 million in annual sales and up to 15% and a Warehouse store. Super Warehouse stores typically
of their sales in GM/HBC. These stores typically carry offer a full range of service departments, perishables,
anywhere from 15,000 to 60,000 SKUs (depending on the and reduced prices, e.g., Cub Foods, Food 4 Less, and
size of the store), and may offer a service deli, a service Smart & Final.
bakery, and/or a pharmacy. Other (Small Grocery)
Fresh Format A small corner grocery store that carries a limited
Different from traditional supermarkets and traditional selection of staples and other convenience goods. These
natural food stores, fresh stores emphasize perishables stores generate less than $2 million in business annually.
and offer center-store assortments that differ from those
of traditional retailers—especially in the areas of ethnic,
natural, and organic, e.g., Byerly’s, Lowes Foods, Lunds,
Mariano’s, The Fresh Market, and Whole Foods.
Limited-Assortment Store
A low-priced grocery store that offers a limited assortment
of center-store and perishable items (fewer than 2,000),
e.g., Aldi, Trader Joe’s, and Save-A-Lot.
Source: Inmar Willard Bishop Analytics
2017 Future of Food Retailing • 10 ▶Non-Traditional Grocery
Wholesale Club Mass
A membership retail/wholesale hybrid with a varied A large store selling primarily hardlines, clothing,
selection and limited variety of products presented in a electronics, and sporting goods, but also carries grocery
warehouse-type environment. These ~120,000 square- and non-edible grocery items. This channel includes
foot stores have 60% to 70% GM/HBC and a grocery line traditional Walmart, Kmart, and Target stores, etc.
dedicated to large sizes and bulk sales. Memberships
include both business accounts and consumer groups, Military
e.g., Sam’s Club, Costco, and BJ’s. A format that looks like a conventional grocery store
carrying groceries and consumables, but is restricted to
Supercenter use by active or retired military personnel. Civilians may
A hybrid of a large Traditional Supermarket and a Mass not shop at these stores (referred to as commissaries).
Merchandiser. Supercenters offer a wide variety of food,
as well as non-food merchandise. These stores average eCommerce (Food & Consumables)
more than 170,000 square feet and typically devote Food and consumable products ordered using the
as much as 40% of the space to grocery items, e.g., internet via any device, regardless of the method of
Walmart Supercenter, SuperTarget, Meijer, and Kroger payment or fulfillment. This channel includes Amazon
Marketplace stores. and Peapod as well as the eCommerce business
generated by traditional brick-and-mortar retailers, e.g.,
Dollar Coborns (Coborns Delivers), Kroger (Clicklist), Safeway
A small store format that traditionally sold staples and (Shop.Safeway.com), ShopRite (ShopRite from Home
knickknacks, but now sells food and consumable items and ShopRite Delivers), Walmart (Walmart Grocery). The
at aggressive price points that account for at least 20%, other non-traditional retail segments above include their
and up to 66%, of their volume, e.g., Dollar General, eCommerce business.
Dollar Tree, and Family Dollar.
Drug
A prescription-based drug store that generates 20%
or more of its total sales from consumables, general
merchandise, and seasonal items. This channel includes
major chain drug stores such as Walgreens and CVS,
but does not include stores/chains, e.g., The Medicine
Shoppe that sell prescriptions almost exclusively.
Convenience Stores
Convenience Store Convenience Store (w/o Gas)
A small, higher-margin store that offers an edited Small, higher-margin Convenience Stores that don’t sell
selection of staple groceries, non-foods, and other gas and offer an edited selection of staple groceries, non-
convenience food items, e.g., ready-to-heat and ready- foods, and other convenience food items, e.g., ready-
to-eat foods. The Convenience Store with Gas format to-heat and ready-to-eat foods. Stores such as 7-Eleven
includes only Convenience Stores that sell gasoline, e.g., without gasoline pumps are included.
ExxonMobil (On the Run), AM/PM, etc.
Primary Sources
While several sources were used to develop this report, the primary sources include Bloomberg, Bureau of Labor
Statistics, Chain Store Guide, Defense Commissary Agency, emarketer.com, FMI, Hoovers, Inmar Willard Bishop Analytics,
Internet Retailer, IRI (a Chicago-based market research firm (@iriworldwide)), Kantar Retail, National Association of
Convenience Stores (NACS), SEC filings, Supermarket News, The Nielsen Company, and the U.S. Census.
2017 Future of Food Retailing • 11 ▶Contacts
About This Report Heather Sowka (847) 756-3719 heather.sowka@inmar.com
Manufacturers Jim Hertel (847) 756-3712 jim.hertel@inmar.com
Retailers Craig Rosenblum (847) 756-3726 craig.rosenblum@inmar.com
Media Sharon Joyner-Payne (336) 631-7663 sharon.joyner-payne@inmar.com
The data within this document is produced by Inmar Willard Bishop Analytics
www.inmar.com • (855) 815-2646 • learnmore@inmar.comYou can also read