Comparison of front-of-pack labels to help German consumers understand the nutritional quality of food products
←
→
Page content transcription
If your browser does not render page correctly, please read the page content below
Copyright!
                                                                                                       Reproduction and dissemination – also partial – applicable to all media only
Peer Review | Nutrition Labelling                                                                      with written permission of Umschau Zeitschriftenverlag GmbH, Wiesbaden.

               Comparison of front-of-pack labels to
               help German consumers understand
               the nutritional quality of food products
               Color-coded labels outperform all other systems
               Manon Egnell, Zenobia Talati, Simone Pettigrew, Pilar Galan, Serge Hercberg, Chantal Julia

                                                                                             Introduction
     Abstract
     Front-of-Package labels (FoPLs) provide simplified nutritional information to           Non-communicable diseases (NCDs) represent
     consumers to help them make healthier food choices. Investigating consu-                the most important causes of death worldwide,
     mers’ understanding of this information is of major importance. This study              outweighing infectious diseases [1]. In Germany
     compared consumers’ objective understanding of five FoPLs (Health Star                  cardiovascular disease and cancers are the two
     Rating System [HSR], Multiple Traffic Lights [MTL], Nutri-Score, Reference              leading causes of death, accounting for 42% and
     Intakes [RIs], warning symbol). In 2018, 1,000 German participants were en-             23% of all deaths respectively among women,
     rolled in an online survey and asked to rank three sets of products according           and 35% and 29% of all deaths among men [2].
     to their nutritional quality, first in the absence of any labelling, and then with
                                                                                             The prevalence of obesity has increased during
     an FoPL displayed on-pack (randomized). Change in ability to correctly rank
                                                                                             the last decades [3]: In 2013, 14.3% of women
     products was assessed using ordinal logistic regression. For all food catego-
     ries, the Nutri-Score performed best, followed by the MTL, warning Symbol,              and 17.1% of men were obese [4], an increase of
     HSR and RIs. The Nutri-Score emerged as the most effective FoPL in conveying            3.3 percentage points among women and 5.0
     information on the nutritional quality of foods for German consumers.                   percentage points among men compared to data
     Keywords: : front-of-pack nutrition label, understanding, German consu-                 collected in 1999 [5]. The prevalence of adult
     mers, nutritional policy, food policy, nutrition labelling                              obesity is currently estimated to range between
                                                                                             16.5% and 23.9% in women and between 17.3%
                                                                                             and 23.3% in men [6].
                                                                                             Multifactorial in their origin, nutrition is a
                                                                                             common determinant of these NCDs [7]. Yet,
                                                                                             dietary behavior is considered as a modifiable
                                                                                             factor, yielding an important potential for the
                                                                                             prevention of NCDs in the long term [8, 9].
                                                                                             Among the multiple strategies aiming at im-
                                                                                             proving the dietary behavior of populations,
                                                                                             some have been identified by the World Health
                                                                                             Organization (WHO) as ‘best buys’, yielding
                                                                                             high benefits for a reduced cost: taxation of less
                                                                                             healthy products, regulation of marketing to
                                                                                             children and front-of-pack labelling [8]. Front-
               Citation                                                                      of-Pack Labels (FoPLs) aim to enable consumers
               Egnell M, Talati Z, Pettigrew S, Galan P, Hercberg S, Julia C (2019)          to make healthier choices at the point of pur-
               Comparison of front-of-pack labels to help German consumers                   chase, by simplifying and helping them inter-
               understand the nutritional quality of food products. Color-coded              pret the detailed nutritional information that is
               labels outperform all other systems. Ernahrungs Umschau 66(5):
                                                                                             accessible at the back of the pack [8].
               76–84
               This article is available online:
               DOI: 10.4455/eu.2019.020                                                      Front-of-pack Labels
                                                                                             In 2017, 23 different types of FoP labels were
               Peer-reviewed                                                                 listed in the Codex Alimentarius (which pro-
               Manuscript (original contribution) received: January 29, 2019                 vides an overview of the various approaches
               Revision accepted: April 01, 2019                                             to simplifying nutritional information to con-

                                               76    Ernaehrungs Umschau international | 5/2019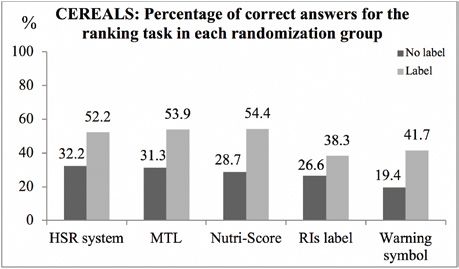
Copyright!
                                                                                      Reproduction and dissemination – also partial – applicable to all media only
                                                                                      with written permission of Umschau Zeitschriftenverlag GmbH, Wiesbaden.

sumers) [10]. Globally, two main approaches can be described:             • Reference Intakes (RIs)
nutrient-specific schemes vs. summary indicators [11].                    • Chilean Warning symbol.
While nutrient-specific schemes provide information on each of            The results of the study for all 12 countries
a series of nutrients, summary indicators rely on a nutrient pro-         have been published elsewhere [17].
filing system to assess the overall nutritional quality of a food
product, combining multiple elements in a single indicator.               Currently in Germany, there are ongoing discus-
Examples of the nutrient-specific approach include:                       sions regarding the implementation of a front-
– Reference Intakes (promoted by agro-food-industry) which pro-          of-pack nutrition label on pre-packed foods, and
   vide numerical information on the contribution of specific nutri-      some consumer associations and manufacturers
   ents to the reference intakes for an adult;                            have declared their support for the introduction
– the Multiple Traffic Lights (developed in the United Kingdom           of a summary FoPL, namely the Nutri-Score.
   [UK]) which additionally provide an interpretation of the level        However, very few studies have investigated
   of each nutrient in the food with a color-code for each nutrient;      the consumers’ understanding of FoPLs in
– and warning labels which are affixed on foods for which the level      Germany specifically [18–21], and none has
   of a given nutrient is above a pre-defined threshold.                  investigated comparatively the main formats
Examples of summary indicator schemes include endorsement                 already implemented around the world in-
schemes (such as the Choices or the Green Keyhole systems) which          cluding the Nutri-Score.
are affixed on foods complying with a series of nutritional criteria      The international comparative experimental
defining healthier foods; and graded schemes (such as the French          FOP-ICE study was set to investigate con-
Nutri-Score, now adopted in Spain and Belgium, or the Health              sumer response to several FOP labels currently
Star Rating System, adopted in Australia and New Zealand) which           implemented in the world. Given this context,
provide an overall indication of the nutritional quality of a food        it appeared of major importance to assess
on a scale from healthier to less healthy.                                comparatively the consumers’ understanding
Schemes vary also in the degree to which they provide an interpre-        of these five FoPLs on German consumers spe-
tation of the nutritional composition of a food. Nutrient-specific        cifically, using data from the FOP-ICE study.
schemes present only numeric data on the food composition and are
considered purely informative, while those providing graphical or
color-coded elements for the overall nutritional quality of the food
or for the content on various nutrients are more interpretative [11].     Methods

Multiple studies have demonstrated the helpfulness of FoPLs in            Participants
raising awareness or the consumer’s understanding of the nutri-           The recruitment was performed by the ISO-ac-
tional quality of pre-packaged foods [12, 13]. Among the various          credited international web panel provider (Pure-
dimensions which should be investigated to test the effectiveness         Profile) using quota sampling based on gender
of FoPLs for consumers, the assessment of the consumers’ objec-           (50% men, 50% women), age (one-third of re-
tive understanding of schemes is among the most informative.              cruited participants in each of the following cate-
Objective understanding is defined as the ability for consumers to        gories: 18–30 years, 31–50 years, over 51 years),
correctly interpret the information that is provided by the FoPL          and level of income (one-third of recruited partic-
[14]. It can be tested by requiring consumers to rank or select food      ipants in each of the following household income
products according to their nutritional quality, using visuals of         levels: low, medium, and high), to ensure equal
food products with and without an FoPL.                                   coverage of the major population groups.
Research suggests that all schemes improve the consumers’ ability         Individuals who reported never or rarely pur-
to correctly interpret the nutritional quality of a food compared         chasing at least two of the three food product
to a control situation with no labelling [15, 16]. Moreover, con-         categories tested in the study (pizzas, cakes,
sumers’ responses to FoPLs may differ depending on their specific         and breakfast cereals) were considered ineligi-
cultural context. Therefore, comparative studies including mul-           ble to participate.
tiple schemes are necessary in order to identify the most helpful         The protocol of the present study was ap-
FoPL in a given cultural context.                                         proved by the Institutional Review Board of
In this context, an international comparative experimental study          the French Institute for Health and Medical Re-
assessing consumers’ objective understanding in 12 countries of           search (IRB Inserm n°17-404) and the Austral-
five FoPLs currently in use in the world was developed using a            ian Curtin University Human Research Ethics
randomized experimental design. The FoPLs included were:                  Committee (approval reference: HRE2017-
• Health Star Rating system (HSR)                                         0760).
• Multiple Traffic Lights (MTL)
• Nutri-Score

                                               Ernaehrungs Umschau international | 5/2019    77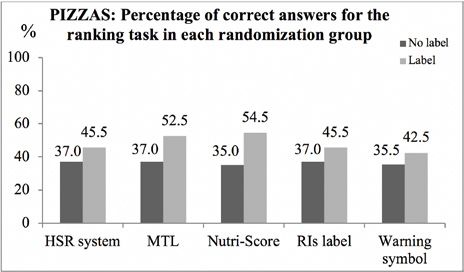
Copyright!
                                                                                                       Reproduction and dissemination – also partial – applicable to all media only
Peer Review | Nutrition Labelling                                                                      with written permission of Umschau Zeitschriftenverlag GmbH, Wiesbaden.

              Labelling condition                 Example of one food category: cakes
              no label

              Health Star Rating system

              Multiple Traffic Lights

              Nutri-Score

              Reference Intakes label

              Warning symbol

             Fig. 1: E
                      xample of a set of three products tested in the present study with the associated FoPLs
                   FoPLs = Front-of-Pack Labels

             Procedure                                                   the five FoPLs groups (HSR, MTL, Nutri-Score, RIs, or Warning
             Participants were exposed to three categories               symbol, resulting in 200 participants per group, and were asked
             of food commonly consumed in Germany:                       to rank the same sets of three products with one of the FoPLs
             pizzas, cakes and breakfast cereals. For each               affixed on mock packages, depending on the randomization arm.
             category, they were first invited to rank a set             An example of a product set used in the study with the five cor-
             of three label-free products, with distinct nu-             responding FoPLs tested is shown in ♦ Figure 1.
             tritional profiles, by selecting one of three op-
             tions for each product:                                     Statistical analysis
             1. highest nutritional quality                              For each participant, the number of correct responses was calcu-
             2. medium nutritional quality                               lated for the no label and the FoPL tasks (yielding a total number
             3. lowest nutritional quality                               of 0 to 3 correct answers for each labelling situation, combining
             An “I don’t know” option was also included.                 results of the three food categories). Ranking was considered cor-
             Then, participants were randomized to one of                rect if all the three products were ranked in the expected order and

                                                  78    Ernaehrungs Umschau international | 5/2019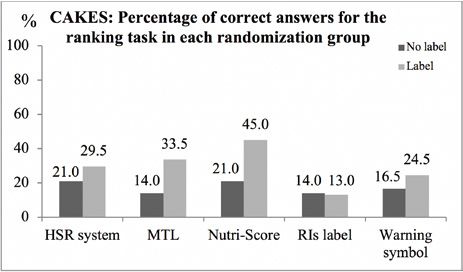
Copyright!
                                                                                       Reproduction and dissemination – also partial – applicable to all media only
                                                                                       with written permission of Umschau Zeitschriftenverlag GmbH, Wiesbaden.

                                                               N (%)       incorrect if any of the products were ranked
                                                                           out of order.
sex
                                                                           The main outcome variable was the change in
men                                                       500 (50.0)       the number of correct responses between the
women                                                     500 (50.0)       FoPL and no label conditions. Multivariable
age, years                                                                 ordinal logistic regression was used to evalu-
                                                                           ate the association of FoPLs with change in the
18–30                                                     340 (34.0)
                                                                           ability to correctly rank products from the no
31–50                                                     330 (33.0)       label to the FoPL condition, using the RIs as a
> 50                                                      330 (33.0)       reference condition.
educational level                                                          Individual characteristics taken into account as
                                                                           covariates included sex, age, educational level,
primary education                                            97 (9.7)
                                                                           household income, involvement in grocery shop-
secondary education                                       382 (38.2)       ping, and self-estimated nutritional knowledge
trade certificate                                         241 (24.1)       and diet quality. Additional information on the
university, undergraduate degree                          129 (12.9)       study methodology is available elsewhere [17].
                                                                           Statistical analyses were carried out for all
university postgraduate degree                            151 (15.1)
                                                                           food categories combined and by food cate-
level of monthly income                                                    gory, using SAS Software (version 9.3, SAS
high                                                      327 (32.7)       Institute Inc, Cary, NC, USA). A p-value ≤
medium                                                    333 (33.3)       0.05 was considered statistically significant.
                                                                           As 30.6% of participants declared at the end of
low                                                       340 (34.0)
                                                                           questionnaire not having seen the FoPL they
responsible for grocery shopping                                           were presented with during the survey, sen-
yes                                                       769 (76.9)       sitivity analyses were performed excluding
no                                                           31 (3.1)      these participants (n = 446).

share job equally                                         200 (20.0)
self-estimated diet quality
I eat a very unhealthy diet                                  34 (3.4)      Results
I eat a mostly unhealthy diet                             202 (20.2)
                                                                           Individual characteristics of the popula-
I eat a mostly healthy diet                               677 (67.7)       tion sample from Germany are presented in
I eat a very healthy diet                                    87 (8.7)      ♦ Table 1. The sample included varied profiles,
nutrition knowledge                                                        including 15% participants with a university
                                                                           postgraduate degree, 68% declaring having a
I do not know anything about nutrition                       15 (1.5)
                                                                           mostly healthy diet, and 62% being somewhat
I am not very knowledgeable about nutrition               193 (19.3)       knowledgeable about nutrition.
I am somewhat knowledgeable about nutrition               617 (61.7)       The Nutri-Score produced the greatest increase
I am very knowledgeable about nutrition                   175 (17.5)       in the number of correct answers compared to
                                                                           the control situation with no label, for pizzas
Did you see the FOP label during the survey?
                                                                           and breakfast cereals: from 70 in no labelling to
no                                                        306 (30.6)       109 correct answers in the FoPL condition for
unsure                                                    140 (14.0)       pizzas, corresponding to an increase of 56%, and
yes                                                       554 (55.4)       from 58 in no labelling to 99 correct answers
                                                                           in the FoPL condition for cereals, correspond-
participants who recalled seeing
                                                                           ing to an increase of 71%. For cakes, the MTL
the FoPL they were exposed to
                                                                           performed best (increase: 139%), followed by
HSR                                                         90 (45.0)      the Nutri-Score (increase: 114%). The MTL per-
MTL                                                       128 (64.0)       formed second best after Nutri-Score for pizzas
Nutri-Score                                               136 (68.0)       and cereals, while results of the other FoPLs var-
                                                                           ied depending on the food category.
RIs label                                                 128 (64.0)
                                                                           The results of percentages of correct answers
Warning symbol                                              72 (36.0)      in the two labelling situations for each FoPL
Tab. 1: D
         escription of the population sample from Germany (N = 1,000)     are presented in ♦ Figure 2. Consistently, all

                                                Ernaehrungs Umschau international | 5/2019    79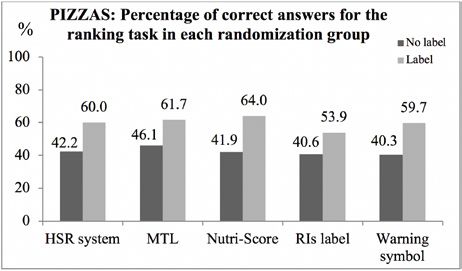
Copyright!
Reproduction and dissemination – also partial – applicable to all media only
Peer Review | Nutrition Labelling with written permission of Umschau Zeitschriftenverlag GmbH, Wiesbaden.
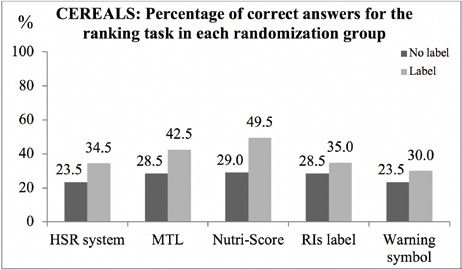
Fig. 2: P
ercentage of correct answers for the sample from Germany with the change compared to no label,
by FoPL and food category
FoPL = Front-of-Pack Label; HSR system = Health Star Rating system; MTL = Multiple Traffic Lights; RIs = Reference Intakes
FoPLs improved the percentage of correct an- Results of the associations between FoPLs and change in ability
swers, but the Nutri-Score showed the largest to correctly rank products among participants recalling hav-
increase in the percentage of correct responses ing seen the FoPL are shown in ♦ Table 3. The Nutri-Score pro-
compared to the no label situation while re- duced the greatest increase in participants’ ability to correctly
sults of the other FoPLs were inconsistent de- rank products (OR: 2.86 [1.77–4.60]), followed by the Warn-
pending on the food category. ing symbol (OR: 2.72 [1.55–4.77]) and then the MTL (OR: 2.24
Analyses conducted among participants re- [1.38–3.63]). Depending on the food category, the magnitude of
calling having seen the FoPL during the survey effects varied, with higher performance in the cakes category,
only, showed similar results (♦ Figure 3). for which the Warning symbol was the FoPL with the highest
Results of associations between FoPLs and par- performance.
ticipants’ ability to correctly rank products are
displayed in ♦ Table 2. Compared to the RIs,
the Nutri-Score was the FoPL associated with
the highest improvement in participants’ abil- Discussion
ity to correctly rank products, overall (Odds
Ratio [OR]: 2.72, 95% confidence interval In the present study, the Nutri-Score displayed the highest perfor-
[1.83–4.05]) and for each of the three food cat- mance in helping consumers understand the nutritional quality
egories. The MTL performed second best, over- of food products, with consistent results in all food categories.
all (OR: 2.15 [1.44–3.21]), largely driven by a For other labels, though some displayed similar performance to
high performance in the cakes category (OR: the Nutri-Score overall (MTL in particular), this performance ap-
4.12 [2.38–7.15]); results were not statistically peared variable depending on the tested food category.
significantly different to the RIs among pizzas Indeed, while the Nutri-Score displayed similar ORs across all food
and cereals. The Warning symbol, followed by categories, the high overall OR observed for the MTL appeared
the HSR, significantly improved participants’ largely driven by higher performance in the cakes category spe-
ability to correctly rank products among cakes cifically, with non-significant improvements compared to the RIs
only, but with lower magnitude of effects. for pizzas or breakfast cereals.
80 Ernaehrungs Umschau international | 5/2019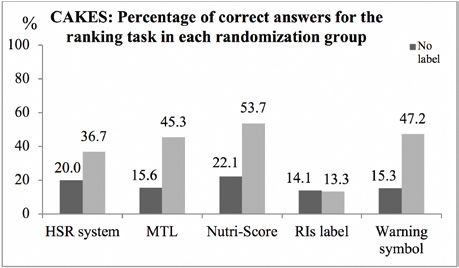
Copyright!
                                                                                                    Reproduction and dissemination – also partial – applicable to all media only
                                                                                                    with written permission of Umschau Zeitschriftenverlag GmbH, Wiesbaden.

                                                                                                                                                          ■ No label

                                                                                                                                                          ■ Label

Fig. 3: P
         ercentage of correct answers for the sample from Germany with the change compared to no label, by FoPL and
        food category, among participants recalling having seen the FoPL
      FoPL = Front-of-Pack Label; HSR system = Health Star Rating system; MTL = Multiple Traffic Lights; RIs = Reference Intakes

The Warning symbol and HSR displayed an                      more specifically the use of color-coding using the green-red
overall lower performance, with significant                  scale (with Nutri-Score and MTL, which performed the best).
improvements in consumers’ objective un-                     The green-red scale may be important to identify the label, as
derstanding compared to RIs only in one food                 these colors are more quickly recognized by the human eye
category.                                                    [23], and as they provide intuitive stop and go signals [24].
Among participants recalling having seen                     Conversely, monochrome labels such as the RIs, Warning labels and
the label during the survey, the Nutri-Score                 HSR may be less noticeable on food packages. A previous study in
remained the FoPL with the highest perfor-                   Germany highlighted that German consumers preferred color-coded
mance, but followed by the Warning symbol                    MTL to GDAs [25]. Thus, results among participants recalling hav-
and then the MTL.                                            ing seen the label during the survey would suggest that a warning
Some caution is required regarding extrapola-                format might be better understood in more salient colors [26].
tion of the results given that the recruitment               Beyond color-coding, a key aspect of the higher performance of
was performed using set quotas rather than                   the Nutri-Score may be related to its use of a single summary
attempting to generate a population repre-                   indicator of the food’s nutritional quality, rather than multiple
sentative sample. However, this method al-                   nutrient-related assessments. This finding is consistent with prior
lowed for the inclusion of a diverse sample in               studies finding that summary indicators are more easily under-
terms of socio-demographic profiles.                         stood by consumers [13, 15], in particular in vulnerable popula-
The superior performance of the Nu-                          tions, which are an important target for public health nutrition
tri-Score in helping consumers rank foods                    policies. Given the very short period when decisions are made in
according to their nutritional quality is con-               purchasing situations [18], the use of a single indicator, such as
sistent with previous studies in France [22]                 the Nutri-Score, may also provide an advantage through the lim-
and with the overall results of the FOP-ICE                  ited cognitive workload needed for interpretation [27]. Hence, the
study in the remaining 11 countries tested                   stronger performance of the Nutri-Score on consumers’ objective
[17]. In the light of these results, some                    understanding may be related to its use of the combination of
graphical characteristics of the FoPLs tested                both semantic colors and a simple and intuitive summary graded
may have impacted their performance, and                     design which appears understandable for all.

                                                        Ernaehrungs Umschau international | 5/2019    81
Copyright!
Reproduction and dissemination – also partial – applicable to all media only
Peer Review | Nutrition Labelling with written permission of Umschau Zeitschriftenverlag GmbH, Wiesbaden.
HSR MTL Nutri-Score Warning
Category N symbol
OR (95% CI) p OR (95% CI) p OR (95% CI) p OR (95% CI) p
all 1,000 1.20 0.4 2.15 0.0002 2.72 < 0.0001 1.10 0.7
categories [0.80–1.80] [1.44–3.21] [1.83–4.05] [0.73–1.65]
pizzas 979 0.96 0.9 1.45 0.1 1.84 0.01 0.94 0.8
[0.57–1.59] [0.88–2.37] [1.13–3.01] [0.56–1.57]
cakes 976 2.01 0.02 4.12 < 0.0001 5.37 < 0.0001 2.18 0.008
[1.14–3.53] [2.38–7.15] [3.11–9.28] [1.23–3.87]
breakfast 879 1.45 0.2 1.68 0.06 2.55 0.0006 0.95 0.9
cereals [0.83–2.52] [0.98–2.90] [1.49–4.34] [0.54–1.68]
Tab. 2: A
ssociationsa between FoPLs and change in ability to correctly rank products between no label and labelling conditions
a
The reference of the multivariate ordinal logistic regression for the categorical variable ‘label’ was the RIs.
The multivariate model was adjusted on sex, age, educational level, level of income, responsibility for grocery shopping,
self-estimated diet quality, and self-estimated nutrition knowledge level.
Bold values correspond to significant results corrected for multiple testing (p ≤ 0.05).
CI = confidence interval; FoPL = Front-of-Pack Label; HSR system = Health Star Rating system;
MTL = Multiple Traffic Lights; OR = Odds Ratio; RIs = Reference Intakes
HSR MTL Nutri-Score Warning
Category N symbol
OR (95% CI) p OR (95% CI) p OR (95% CI) p OR (95% CI) p
all 554 1.57 0.1 2.24 0.001 2.86 < 0.0001 2.72 0.0005
categories [0.92–2.67] [1.38–3.63] [1.77–4.60] [1.55–4.77]
pizzas 541 1.16 0.6 1.04 0.9 1.54 0.1 1.43 0.3
[0.61–2.19] [0.58–1.86] [0.87–2.70] [0.73–2.80]
cakes 537 3.42 0.002 6.78 < 0.0001 8.43 < 0.0001 9.66 <
[1.55–7.54] [3.28–14.05] [4.09–17.38] [4.3–21.74] 0.0001
breakfast 497 1.70 0.1 1.77 0.07 2.38 0.005 1.83 0.1
cereals [0.87–3.34] [0.96–3.27] [1.29–4.38] [0.89–3.77]
Tab. 3: Associationsa between FoPLs and change in ability to correctly rank products between no label and labelling
conditions, among participants recalling having seen the label during the survey
a
The reference of the multivariate ordinal logistic regression was the RIs.
The multivariate model was adjusted on sex, age, educational level, level of income, responsibility for grocery shopping,
self-estimated diet quality, and self-estimated nutrition knowledge level.
HSR: Health Star Rating system; MTL: Multiple Traffic Lights; OR: Odds Ratio; CI: Confidence Interval.
Bold values correspond to significant results corrected for multiple testing (p ≤ 0.05).
CI = confidence interval; FoPL = Front-of-Pack Label; HSR system = Health Star Rating system; MTL = Multiple Traffic Lights;
OR = Odds Ratio; RIs = Reference Intakes
Moreover, recent studies suggest that be- Conclusion
yond food purchases, the Nutri-Score, and
to a lesser extent the MTL, may have an im- The results of this study are of particular interest in the Euro-
pact on food consumption, by reducing the pean Union, where the debate over the implementation of FoPLs
portions size selected for foods considered has recently gathered attention from policy makers and indus-
of lower nutritional quality (cheese, bis- try. While the MTL have been implemented since 2005 in UK, the
cuits and spreads) [28]. Therefore, overall, Nutri-Score, initially applied in France in 2017, has recently been
research suggests that FoPLs, and the Nu- adopted by Belgium, with a voluntary commitment of several
tri-Score in particular, are helpful to increase manufacturers and retailers.
consumers’ awareness in nutrition, improve The results of this study suggest that among the available options, the
their understanding of the nutritional qual- Nutri-Score appears as the most efficient scheme to inform consumers
ity of food products, stimulate healthier food on the nutritional quality of foods, in particular in Germany, where it
purchases and may impact the nutritional would be a helpful tool for consumers in purchasing situations.
quality of the diets [29].
82 Ernaehrungs Umschau international | 5/2019Copyright!
Reproduction and dissemination – also partial – applicable to all media only
with written permission of Umschau Zeitschriftenverlag GmbH, Wiesbaden.
URL: https://www.destatis.de/DE/Publikationen/Thematisch/Gesundheit/
MSc Manon Egnell1
PhD Zenobia Talati2 Gesundheitszustand/Koerpermasse5239003179004.pdf?__blob=publicationFile
PhD Simone Pettigrew2 Zugriff 10.01.19
MD, PhD Pilar Galan1 5. Statistisches Bundesamt. Fragen zur Gesundheit. Ergebnisse des Mikrozensus 1999.
MD, PhD Serge Hercberg1,3 Statistisches Bundesamt, Wirtschaft und Statistik (2001), S. 771–780
MD, PhD Chantal Julia1,3
6. Mensink GBM, Schienkiewitz A, Haftenberger M et al. (2013) [Overweight and
1
Sorbonne Paris Cité
Epidemiology and Statistics Research Center (CRESS) obesity in Germany: results of the German Health Interview and Examination Sur-
U1153 Inserm, U1125, Inra, Cnam vey for Adults (DEGS1)]. Bundesgesundheitsblatt Gesundheitsforschung Gesund-
Paris 13 University heitsschutz 56(5–6): 786–794
Nutritional Epidemiology Research Team (EREN) 7. GBD 2016 Causes of Death Collaborators (2017) Global, regional, and national
Bobigny, 93000, France
age-sex specific mortality for 264 causes of death, 1980-2016: a systematic analy-
m.egnell@eren.smbh.univ-paris13.fr
p.galan@eren.smbh.univ-paris13.fr sis for the Global Burden of Disease Study 2016. Lancet Lond Engl 390: 1151–1210
s.hercberg@eren.smbh.univ-paris13.fr 8. World Health Organization. Global strategy on diet, physical activity and health.
c.julia@eren.smbh.univ-paris13.fr WHO, Geneva (2004)
2
School of Psychology 9. World Health Organization. Global health risks - mortality and burden of dis-
Curtin University
ease attributable to selected major risks. (2009). URL: http://obesity.publiche
Kent St, Bentley, WA 6102, Australia
zenobia.talati@curtin.edu.au althwell.ie/node/9612?&content=resource&member=415&catalogue=none&col
simone.pettigrew@curtin.edu.au lection=none&tokens_complete=true Zugriff 21.03.18
3 Public Health Department 10. Codex Alimentarius Commission. Joint FAO/WHO Food Standards Programme
Avicenne Hospital, AP-HP Codex Committee on Food Labelling. Discussion paper on consideration of ISS uses
Bobigny, 93000, France
regarding front-of-pack nutrition labelling. Report no.: CX/FL 17/44/7. Agenda
Item 7. (2017). URL: www.fao.org/fao-who-codexalimentarius Zugriff 18.12.19
11. Kanter R, Vanderlee L, Vandevijvere S (2018) Front-of-package nutrition labelling
Acknowledgment policy: global progress and future directions. Public Health Nutr 21: 1399–1408
The authors would like to thank Mr. Mark Orange for cre- 12. Hawley KL, Roberto CA, Bragg MA et al. (2013) The science on front-of-package
ating the mock packages, and all researchers and doctoral
food labels. Public Health Nutr 16: 430–439
students who tested the online survey.
13. Hersey JC, Wohlgenant KC, Arsenault JE et al. (2013) Effects of front-of-package
and shelf nutrition labeling systems on consumers. Nutr Rev 71: 1–14
Funding Statement 14. Grunert Klaus G, Wills Josephine M (2007) A review of European research on con-
The present study received funding from Santé Publique sumer response to nutrition information on food labels. J Public Health 15: 385–399
France (French Agency for Public Health) and Curtin Uni- 15. Ducrot P, Mejean C, Julia C et al. (2015) Objective understanding of front-of-package
versity. nutrition labels among nutritionally at-risk individuals. Nutrients 7: 7106–7025
16. Egnell M, Ducrot P, Touvier M et al. (2018) Objective understanding of Nutri-Score
Front-Of-Package nutrition label according to individual characteristics of subjects:
Conflict of Interest
The authors declare no conflict of interest.
comparisons with other format labels. PloS One 13: e0202095
17. Egnell M, Talati Z, Hercberg S et al. (2018) Objective understanding of front-of-
package nutrition labels: an international comparative experimental study across
12 countries. Nutrients 10(10)
References 18. Feunekes GI, Gortemaker IA, Willems AA et al. (2008) Front-of-pack nutrition
labelling: testing effectiveness of different nutrition labelling formats front-of-pack
1. Yach D, Hawkes C, Gould CL, Hofman KJ (2004) The in four European countries. Appetite 50: 57–70
global burden of chronic diseases: overcoming impedi- 19. M öser A, Hoefkens C, van Camp J et al. (2010) Simplified nutrient labelling: con-
ments to prevention and control. JAMA 291: 2616–2622 sumers’ perceptions in Germany and Belgium. J Für Verbraucherschutz Leb 5:
2. OCDE/Observatoire européen des systèmes et des pol- 169–180
itiques de santé (2017) Germany: country health 20. Aschemann-Witzel J, Grunert KG, van Trijp HC et al. (2013) Effects of nutrition
profile 2017, state of health in the EU. Éditions label format and product assortment on the healthfulness of food choice. Appetite
OCDE, Paris/Observatoire européen des systèmes et 71: 63–74
des politiques de santé. Brussels. URL: https://doi. 21. Borgmeier I, Westenhoefer J (2009) Impact of different food label formats on health-
org/10.1787/9789264283398-en Zugriff 10.01.19 iness evaluation and food choice of consumers: a randomized-controlled study. BMC
3. Schienkiewitz A, Mensink G, Kuhnert R, Lange C (2017) Public Health 9: 184
Overweight and obesity among adults in Germany. Jour- 22. Julia C, Hercberg S (2017) Nutri-Score: evidence of the effective-ness of the French
nal of Health Monitoring 2: 20–26 front-of-pack nutrition label. Ernahrungs Umschau 64(12): 181–187
4. Statistisches Bundesamt: Mikrozensus 2017. Fragen zur 23. Nagle MG, Osorio D (1993) The tuning of human photopigments may minimize red-
Gesundheit – Körpermaße der Bevölkerung. Statistis- green chromatic signals in natural conditions. Proc Biol Sci 252: 209–213
ches Bundesamt (2018), Report No.: 5239003179004. 24. Vasiljevic M, Pechey R, Marteau TM (2015) Making food labels social: the impact of
Ernaehrungs Umschau international | 5/2019 83Copyright!
Reproduction and dissemination – also partial – applicable to all media only
Peer Review | Nutrition Labelling with written permission of Umschau Zeitschriftenverlag GmbH, Wiesbaden.
colour of nutritional labels and injunctive norms on perceptions and choice of snack
foods. Appetite 91: 56–63
25. Moeser A, Hoefkens C, van Camp J et al. Nutrient profile labeling: consumers’ per-
ceptions in Germany and Belgium. In: 113th EAAE Seminar. Chania, Crete/Greece
(2009)
26. Cabrera M, Machín L, Arrúa A et al. (2017) Nutrition warnings as front-of-pack
labels: influence of design features on healthfulness perception and attentional cap-
ture. Public Health Nutr 20: 3360–3371
27. Julia C, Péneau S, Buscail C et al. (2017) Perception of different formats of front-
of-pack nutrition labels according to sociodemographic, lifestyle and dietary factors
in a French population: cross-sectional study among the NutriNet-Santé cohort
participants. BMJ Open 7: e016108
28. Egnell M, Kesse-Guyot E, Galan P et al. (2018) Impact of front-of-pack nutrition
labels on portion size selection: an experimental study in a French cohort. Nutrients
10(9)
29. Julia C, Hercberg S (2017) Development of a new front-of-pack nutrition label in
France: the five-colour Nutri-Score. Public Health Panor 3: 537–820
DOI: 10.4455/eu.2019.020
84 Ernaehrungs Umschau international | 5/2019You can also read