NON-FOOD RETAIL AND RUSSIAN CONSUMER MARKET - INFOLine
←
→
Page content transcription
If your browser does not render page correctly, please read the page content below
W W W . I N F O L I N E . S P B . R U W W W . A D V I S . R U W W W . A L L I N V E S T . R U
R E S E A R C H
NON-FOOD RETAIL AND RUSSIAN
CONSUMER MARKET
Trends 2017
Development prospects 2017-2019
DEMO VERSION
KEY RETAIL INDICATORS
KEY NON-FOOD RETAIL EVENTS
NON-FOOD RETAIL COMPANIES RATING
NON-FOOD RETAIL DEVELOPMENT FORECAST
информационное агентство information agency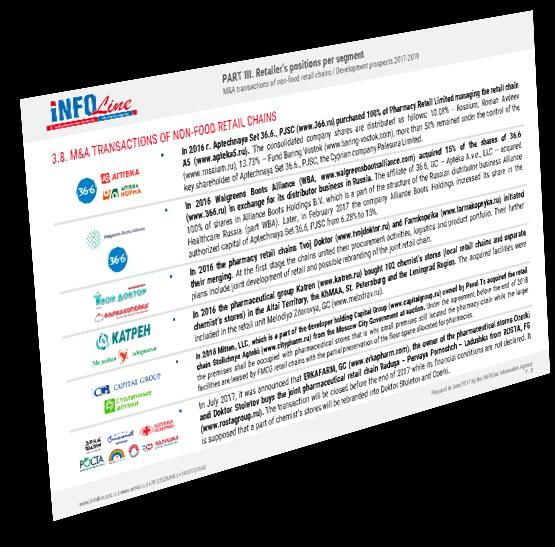
NON-FOOD RETAIL AND RUSSIAN CONSUMER MARKET
информационное агентство information agency
Development prospects 2017-2019. DEMO VERSION
CONTENTS
PART I. Retail and consumer market highlights
1.1. Retail turnover 3.3. Baby goods and fashion retail PART IV. Market of shopping malls
1.2. Retail turnover by categories 3.3.1. Retail of fashion (clothers, shoes, sports gear, 4.1. Key highlights of the commercial real estate market
1.3. Structure of retail turnover by segments accessories and baby goods 4.2. Largest commissioned shopping malls
1.4. Regional structure of Food retail turnover 3.3.2. TOP-10 fashion retailers 4.3. Rating of mall owners INFOLine Developer Russia TOP
1.5. Regional structure of Non-Food retail turnover 3.3.3. Spormaster details 4.4. Key events in the market of shopping malls
1.6. Personal incomes and spending over time 3.3.4. Detsky Mir details 4.5. Projects of shopping malls at early construction stages
1.7. Consumer borrowing and deposits
1.8. Structure of personal incomes and spending 3.4. Pharmacy retail PART V. Non-Food Retail forecasts per 2017-2019 segment
1.9. Consumer behavior 3.4.1. Pharmacy retail sales 5.1. Russia’s economic development scenarios and
3.4.2. TOP-10 pharmacy retailers highlights
PART II. Government control in retail 3.4.3. PAO 36.6 Pharmacy chain (A.V.E. Group) details 5.2. INFOLINE-made non-food retail development scenarios
2.1. Government control in FMGG retail 5.3. Population’s income and expenditure dynamics
2.2. Government control in Non-Food retail 3.5. Cosmetics and Drogerie retail forecast
3.5.1. Cosmetics and Drogerie retail sales 5.4. Retail turnover forecast
PART III. Retailer's positions per segment 3.5.2. TOP-10 Cosmetics and Drogerie retailers 5.5. Non-Food retail development forecast
3.1. DIY&Household and Furniture Retail3.1.1. Retails sales 3.5.3. L’Etoile details
of DIY&Household and Furniture Sources
3.1.2. TOP 10 retailers of DIY&Household and Furniture 3.6. E-Commerce retail List of abbreviations
3.1.3. Market survey of largest DIY suppliers: 2016 3.6.1. E-Commerce structure Author’s profile: INFOLine information & analytical
results and 2017 forecast 3.6.2. TOP-10 E-Commerce retailers agency
3.1.4. Leroy Merlin Details 3.6.3. Details of WILDBERRIES.RU Online retailer
3.2. HA&E and mobile devices retail 3.7. Non-Food retail chains distribution centers (DC) and
3.2.1. Retail sales of home appliances, electronics, and Logistics
mobile devices
3.2.2. TOP 10 HA&E and mobile device retailers 3.8. M&A transactions of non-food retail chains
3.2.3. Details of SAFMAR COMPANY GROUP:
Tehnosila, Eldorado, M.Video 3.9. Non-Food retail dismissals and appointments
3.10. Rebranding and new formats of non-food retail chains
Prepared in June 2017 by the INFOLine Information Agency
www.infoline.spb.ru | www.advis.ru | +78123226848 | +74957727640 P. 2.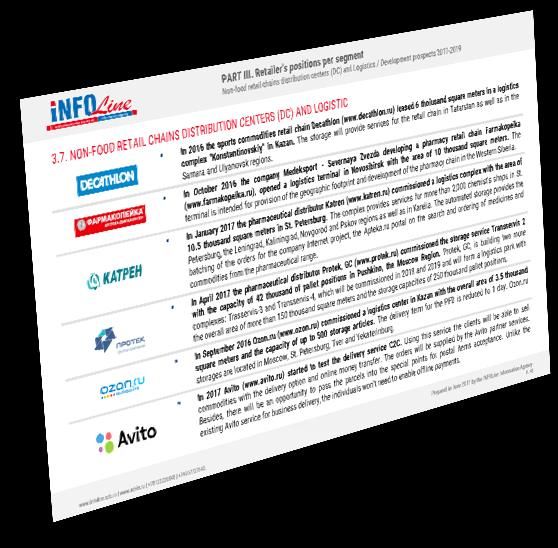
PART I. RETAIL AND CONSUMER MARKET HIGHLIGHTS
информационное агентство information agency
Retail turnover / Development prospects 2017-2019. DEMO VERSION
1.1. RETAIL TURNOVER
In 2016 the retail turnover (RT) decreased by 4.6% expressed in physical terms to 28317.3 bn. RUB. However, in monetary
terms RT increased by 2.9%. In 2017 the Ministry of Economic Development of the Russian Federation anticipates transition in
the RT dynamics expressed in physical terms towards the area of positive values while in 2018 - increase of the growth rate
almost up to the growth rate level fixed in 2014.
In the situation of decline in the population real income by 5.9% over 2016, despite rationalization of the consumer behavior, in
2016 the share of expenses for goods and services purchase in the household budgets increased by 0.8 p.p. and 0.4 p.p. At
the same time, the revenues intended for savings, decreased by 3 p.p.
Against the background of the high basis in 2015, the decrease of the consumer activity and the ruble strengthening in the H2 year, in January-December
2016 the annualized inflation slowed down to 7.1% against 15.5% in January-December 2015. Meanwhile, in January-December 2016 the annualized Food
CPI demonstrated the lowest indicator over the last 10 years – 6% (the lower indicator was registered only in 2013 being equal to 3.9%). Under the conditions
of the maintained moderately stringent monetary policy the Ministry of Economic Development of the Russian Federation forecasts the average CPI for 2017
as 4% by the end of the year (December 2017 against December 2016) – 3.8%.
Retail turnover, in % to the corresponding period of the previous CPI dynamics and forecast (December against
RT dynamics per segments, trillion rubles
year previous December), %
15% 18% 35 48,7% 48,6% 49%
9,0%
48,1%
7,9%
7,9%
16%
7,4%
10% 30
5,7%
5,6%
12,9%
4,9%
14% 47,7% 48%
4,0%
4,0%
3,9%
3,8%
3,6%
3,1%
11,4%
2,1%
25
1,6%
5% 12% 47,0% 47,0%
10% 20 47%
46,6%
0%
8% 6,1% 6,6% 6,5%
5,4% 15 46%
-5% 6%
3,8% 10
-3,9%
-4,6%
-4,9%
-5,0%
4%
-7,0%
-10% 45%
5
-9,7%
2%
-12,7%
-9,9%
-15% 0% 0 44%
II кв. IV кв. II кв. IV кв. II кв. IV кв. II кв. IV кв. II кв. IV кв. II кв. IV кв. 2011 2012 2013 2014 2015 2016 2017П 2011 2012 2013 2014 2015 2016 2017П
2011 2011 2012 2012 2013 2013 2014 2014 2015 2015 2016 2016
General RT dynamics Food RT dynamics Non-Food RT dynamics CPI Food CPI Non-Food CPI Food Non-Food Food products share, % (right scale)
Source: RSC, INFOLine asessments Source: RSC, EMR Source: RSC, EMR, INFOLine asessments
Prepared in June 2017 by the INFOLine Information Agency
www.infoline.spb.ru | www.advis.ru | +78123226848 | +74957727640 Р. 3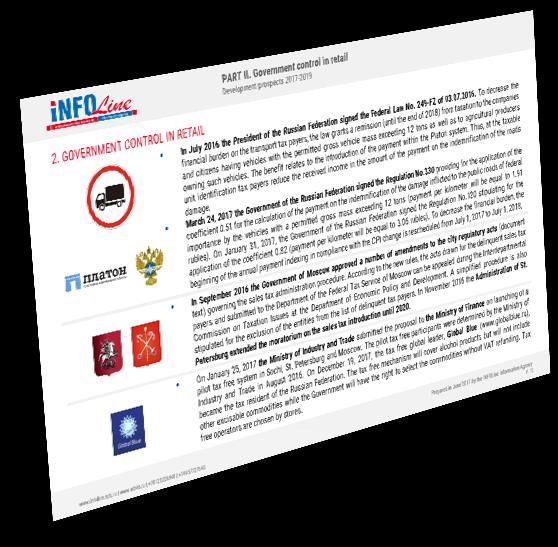
PART I. RETAIL AND CONSUMER MARKET HIGHLIGHTS
информационное агентство information agency
Personal incomes and spending over time / Development prospects 2017-2019. DEMO VERSION
1.6. POPULATION INCOME AND EXPENSES DYNAMICS
By the end of 2016, the population income has been reduced for 26 months and, despite the decline slowdown to -2.7% in
September 2016, by December 2016 the decline again accelerated and was equal to -6.8%.
At year-end 2016, the reduction of the population real income accelerated by 5.9% (in 2015 the reduction was equal to 3.2%)
while the real income increased by 0.7% (after the 9% reduction in 2015). The one-off payment to the retirees equal to 5,000
rubles in the beginning of 2017 resulted in a sharp income increase, thus, the Ministry of Economic Development expects the
population real income growth at the year-end for the first time since 2013 (by 3.3%).
As of the results of Q4 2016 the population confidence index increased by 1 p.p. (-18%) against Q3 2016, the enabling index
for large purchase remained the same (-33%) while the savings enabling index reduced by 1 p.p. (-42%). 84% of the FSSS
surveyed consumers pointed out that now is not the best time to spend money (against 73% as of the Q4 results, 2015) while
75% of the consumers in Q4, 2016 reduced their expenses to the level of Q4 2015 (with the indicator of 73% in Q3 2016).
Population distribution by
Salary and population real income dynamics, % Population income and expenses
18,9% average income
12% 16 15,0% 16,1% 19%
12,6% 13,7% 13,3% Luxury + Premium
9% 10,7% 9,3% 11,9%
6,0% 11,4% 11,4%11,1% 11,0% 14% ~11%
10,2% 8,8%
5,9% 8,8% 9,6% 9,2%
6% 4,8% 4,5% 3,8%3,2% 3,6% 12
9% Middle
2,2% 2,3% 3,3%
3% 1,9% 1,5% 0,8% ~9%
-0,7% 0,7% -0,5% 2,4% 4%
0% 8 2,9% 0,4%
2,6% 2,0% 2,8% 3,8% 2,7%
1,8% -1%
-3% -1,1% 1,9% 0,1% 0,1% 0,5% -0,1% Value
-1,6%0,6%0,8%0,5% -1,2%1,1%
-3,2% -3,0% -1,9% -1,9%-3,7% -2,4% -2,9% -0,6% -6% ~55%
-6% -4,4%-4,3% 4 -5,9%
-5,6% -6,5% Over 60% of the population
-9% -7,0% -11% do not have savings!
-12% 0 -16%
II кв. IV кв. II кв. IV кв. II кв. IV кв. II кв. IV кв. II кв. IV кв. II кв. IV кв. II кв. IV кв. II кв. IV кв. II кв. IV кв. II кв. IV кв. II кв. IV кв. II кв. IV кв. Buy STOP
2011 2011 2012 2012 2013 2013 2014 2014 2015 2015 2016 2016 2011 2011 2012 2012 2013 2013 2014 2014 2015 2015 2016 2016 ~25%
Population expenses, trillion rubles
Real salary Real monetary income Monetary income exceedance over expenses, % (right scale)
Population expenses dynamics, % (right scale)
Source: RSC Source: RSC Source: RSC, INFOLine
Prepared in June 2017 by the INFOLine Information Agency
www.infoline.spb.ru | www.advis.ru | +78123226848 | +74957727640 Р. 4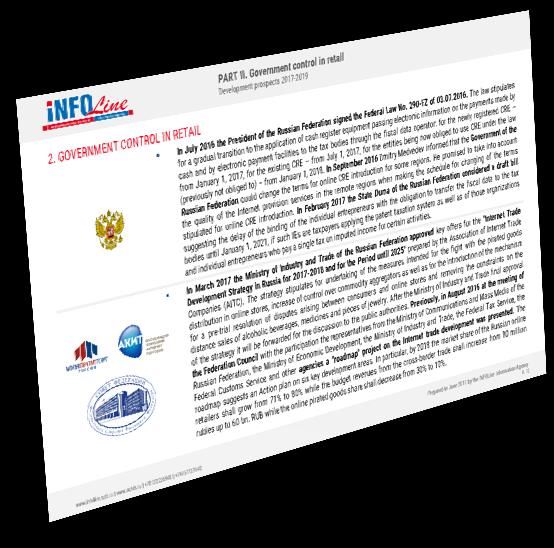
PART I. RETAIL AND CONSUMER MARKET HIGHLIGHTS
       информационное агентство   information agency
                                                                        Development prospects 2017-2019. DEMO VERSION

                                                                                                                                    Retail turnover Food и Non-Food
    STRUCTURE OF PART I                                                                                                     Structure of retail turnover by segments
                                                                                                                           Regional structure of Food and Non-Food
                                                                                                                                                        retail turnove
                                                                                                                          Personal incomes and spending over time
                                                                                                                                  Consumer borrowing and deposits
                                                                                                                        Structure of personal incomes and spending
                                                                                                                                                  Consumer behavior

9 slides, 15 diagramms
                                                                                                                            Prepared in June 2017 by the INFOLine Information Agency
     www.infoline.spb.ru | www.advis.ru | +78123226848 | +74957727640                                                                                                            P. 5.
PART II. GOVERNMENT CONTROL IN RETAIL
информационное агентство information agency
Development prospects 2017-2019. DEMO VERSION
2. GOVERNMENT CONTROL IN RETAIL
In July 2016 the President of the Russian Federation signed the Federal Law No. 290-FZ of 03.07.2016. The law stipulates
for a gradual transition to the application of cash register equipment passing electronic information on the payments made by
cash and by electronic payment facilities to the tax bodies through the fiscal data operator: for the newly registered CRE –
from January 1, 2017, for the existing CRE – from July 1, 2017, for the entities being now obliged to use CRE under the law
(previously not obliged to) – from January 1, 2018. In September 2016 Dmitry Medvedev informed that the Government of the
Russian Federation could change the terms for online CRE introduction for some regions. He promised to take into account
the quality of the Internet provision services in the remote regions when making the schedule for changing of the terms
stipulated for online CRE introduction. In February 2017 the State Duma of the Russian Federation considered a draft bill
suggesting the delay of the binding of the individual entrepreneurs with the obligation to transfer the fiscal data to the tax
bodies until January 1, 2021, if such IEs are taxpayers applying the patent taxation system as well as of those organizations
and individual entrepreneurs who pay a single tax on imputed income for certain activities.
In March 2017 the Ministry of Industry and Trade of the Russian Federation approved key offers for the "Internet Trade
Development Strategy in Russia for 2017-2018 and for the Period until 2025" prepared by the Association of Internet Trade
Companies (AITC). The strategy stipulates for undertaking of the measures intended for the fight with the pirated goods
distribution in online stores, increase of control over commodity aggregators as well as for the introduction of the mechanism
for a pre-trial resolution of disputes arising between consumers and online stores and removing the constraints on the
distance sales of alcoholic beverages, medicines and pieces of jewelry. After the Ministry of Industry and Trade final approval
of the strategy it will be forwarded for the discussion to the public authorities. Previously, in August 2016 at the meeting of
the Federation Council with the participation the representatives from the Ministry of Communications and Mass Media of the
Russian Federation, the Ministry of Economic Development, the Ministry of Industry and Trade, the Federal Tax Service, the
Federal Customs Service and other agencies a "roadmap" project on the Internet trade development was presented. The
roadmap suggests an Action plan on six key development areas. In particular, by 2018 the market share of the Russian online
retailers shall grow from 71% to 80% while the budget revenues from the cross-border trade shall increase from 80 million
rubles up to 60 bn. RUB while the online pirated goods share shall decrease from 30% to 10%.
Prepared in June 2017 by the INFOLine Information Agency
www.infoline.spb.ru | www.advis.ru | +78123226848 | +74957727640 P. 6.
PART II. GOVERNMENT CONTROL IN RETAIL
       информационное агентство   information agency
                                                                        Development prospects 2017-2019. DEMO VERSION

     STRUCTURE OF PART II                                                                                                  Government control in FMGG retail
                                                                                                                        Government control in Non-Food retail

6 slides
                                                                                                                        Prepared in June 2017 by the INFOLine Information Agency
     www.infoline.spb.ru | www.advis.ru | +78123226848 | +74957727640                                                                                                        P. 7.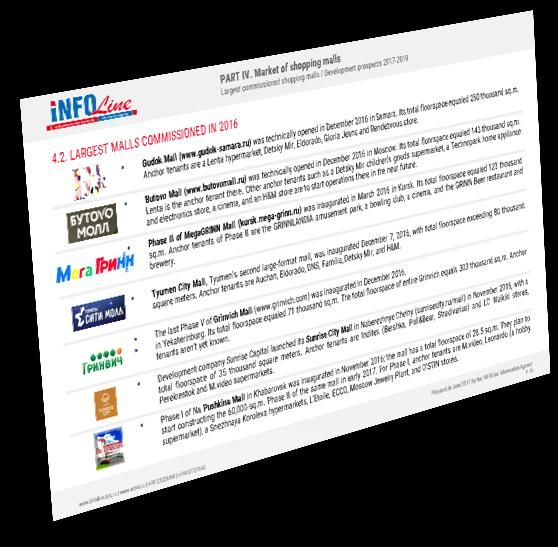
PART III. RETAILER'S POSITIONS PER SEGMENT
информационное агентство information agency
Retails sales of DIY&Household and Furniture / Development prospects 2017-2019. DEMO VERSION
3.1.1. RETAILS SALES OF DIY&HOUSEHOLD AND FURNITURE
Declining apartment block construction (a 3.4% drop in 2016) and individual housing construction (a 9.7% drop in 2016)
caused a 6% DIY market shrinkage in the same year, with Hard-DIY being affected the most: 17% vs. 4% decline of Soft-DIY.
The Garden segment meanwhile increased by 8%. Household and Furniture sales fell by 5% and 7%, respectively.
Regional DIY chains cannot compete with international players like Leroy Merlin; thus, Metrika, a federal-level retail chain,
ceased its operations in 2016, with its hypermarkets being subsequently sold. The primary legal entities of the Trest SKM
Company Group received bankruptcy claims, with 5 SuperStroi-branded properties being sold to Brozex, more than 20 other
properties closed. In early 2017, the chain ceased to exist with the rest of its shops closed. Domotsentr, Siberian Federal
District’s largest chain, closed all of its shops in 2016 and put the brand, the property, and the stock on sale; the brand and the
commodity stock were purchased by Vyacheslav Kucherov to develop a DIY chain in Rostov Region.
Operating highlights of Russia’s top 10 DIY&Household and Furniture retail
DIY&Household and Furniture retail turnover in Russia
chains (as of January 1, 2017)
2800 20% 650 80
17,0% 600 74
2400 15% 550 70
14,4% 700
13,2% 650 9,0% 633 580 500 60
2000 600 8,7% 590 10% 59
450
8,3% 8,2% 50
530 434 402 400 48
1600 401 7,8% 7,7% 382 390 2,1% 5%
372 350
1,5% 40
1200 325 0% 300
1458 1370 -1,7% 250 30
-5,0% 1390 200 27
800 1535 -5,0% -5% 23
1295 1408 150 21 20
1107 -7,4% -6,0% 17
400 -9,6% -10% 100 14 12
-6,8% 10 10
50
0 -15% 0 0
2011 2012 2013 2014 2015 2016 2017П Leroy IKEA OBI Петрович Castorama Сатурн Максидом Бауцентр Hoff Строит.
Merlin Двор
DIY, RUB bln Household, RUB bln
Furniture, RUB bln DIY Market dynamics, % scale Retail space, thousand sq. M Number of stores (% scale)
Household Market dynamics, % scale Furniture Market dynamics, % scale
Source: INFOline’s DIY Market of Russia Source: corporate data, INFOLine assessments
Prepared in June 2017 by the INFOLine Information Agency
www.infoline.spb.ru | www.advis.ru | +78123226848 | +74957727640 Р. 8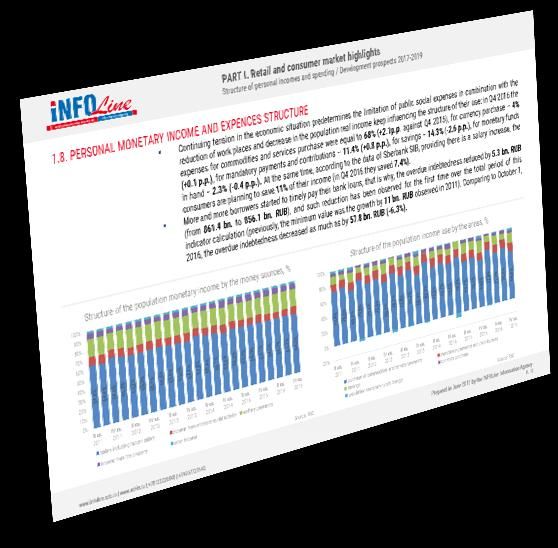
PART III. RETAILER'S POSITIONS PER SEGMENT
информационное агентство information agency
Retails sales of DIY&Household and Furniture / Development prospects 2017-2019. DEMO VERSION
3.1.2. TOP 10 RETAILERS OF DIY&HOUSEHOLD AND FURNITURE
In 2016, Leroy Merlin opened 17 hypermarkets, having invested 30 billion rubles; in 2017, the company plans to invest just as
much to open 17 hypermarkets more (3 have been opened over the first half of the year), including 5 in the Ural, Siberian, and
Far-Eastern Federal Districts.
In 2016, 70 million people shopped at IKEA. In 2016, IKEA announced its plans to construct the third IKEA Hypermarket and
Mega Mall on the borders of St. Petersburg and Leningrad Region. In early 2017, it also announced the global renovation of the
existing Mega Malls, with Kazan Mega Mall being the first to renovate for a total of 2 billion rubles of investments.
In February 2017, STD Petrovich opened a touch-n-beep construction base in Novaya Riga, Moscow Region; in April, a similar
construction base of the company was reopened in St. Petersburg, relocated from Salova Street. The company plans to open
another such facility in Tallinskoye Highway, St. Petersburg, until the end of 2017. In 2016, STD Petrovich made its online DIY
sales leadership even more pronounced; as such, in Moscow and Moscow Region, online sales make for half of the regional
revenue. The company plans to achieve the same in St. Petersburg by 2019-2020.
INFOLine DIY&Household Retail Russia Top Revenue Rankings Retail space dynamics of Russia’s Top 10 DIY&Household chains
44,5%
200 186,0 35% 200 45%
30,3% 194
180 30% 180 40%
160 160
25% 35%
140 19,0% 140
24,0% 17,4% 15,7% 20% 25,3% 30%
120 120
100,1 11,1% 15% 100 25%
100 85
10% 80 20%
80 4,1%
5% 60 13,5% 15%
60 1,0% 0,0%
40 21 26
36,8 31,3 0% 20 7,3% 16 10%
40 30,7 20 0 0 7,4% 12 10 6 7 7
24,7 18,9 17,5 9 3 9
20 -6,0% 15,5 14,4 -5% 0 5%
0
0,0% 2,9% -3 4,0% 0,0% 0
0 -10% -20 0%
Leroy IKEA OBI Петрович Castorama Сатурн Максидом Бауцентр Hoff Строит.
Leroy IKEA OBI Петрович Castorama Сатурн Максидом Бауцентр Hoff Строит.
Merlin Двор
Merlin Двор
2014, RUB bln 2015, RUB bln 2016, RUB bln 2016 dynamics, % scale 2015 2016 Retail space dynamics in 2016, % scale
Source: INFOline’s asessements, companie’s data Source: INFOline’s DIY Market of Russia
Prepared in June 2017 by the INFOLine Information Agency
www.infoline.spb.ru | www.advis.ru | +78123226848 | +74957727640 Р. 9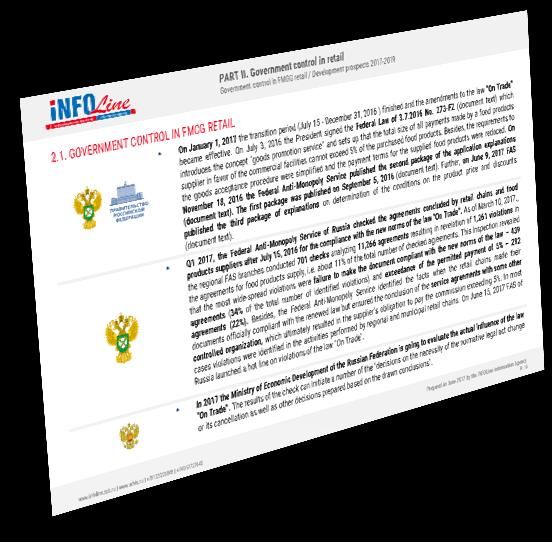
PART III. RETAILER'S POSITIONS PER SEGMENT
информационное агентство information agency
DIY&Household and Furniture Retail / Development prospects 2017-2019. DEMO VERSION
3.1.4. LEROY MERLIN DETAILS
Leroy Merlin opened its first Russian hypermarket in September 2004 in Mytishchi, Moscow Region. Leroy Merlin Vostok LLC is
the Russian branch of Leroy Merlin, a member of the Adeo Group which unites more than 300 stores in 10 countries of the
world.
In Russia, Leroy Merlin operates hypermarkets with 10 to 12 thousand. sq. m of retail space, each offering a product range of
30-40 thousand SKU. The chain is also developing its smaller store format for non-major cities.
In 2013, Leroy Merlin started online sales operations in Russia. The e-store serves Moscow, Moscow Region, St. Petersburg,
Leningrad Region, and Rostov-on-Don.
In Russia, Leroy Merlin leads in terms of revenue and sales efficiency in the DIY market. Its strategy is based on the Everyday
Low Prices strategy that implies optimization of procurement prices, costs, and product range, as well as optimized stock.
Leroy Merlin operates in the following regions Formats Top Management
Chain stores: Volga, North-Western, Siberian, Ural,
Central, Southern, and Far-Eastern Federal Districts
Vincent Pierre Marie Philippe Mougeot,
Jeanty, General Director of Marketing
Prepared in June 2017 by the INFOLine Information Agency
www.infoline.spb.ru | www.advis.ru | +78123226848 | +74957727640 P. 10PART III. RETAILER'S POSITIONS PER SEGMENT
информационное агентство information agency
DIY&Household and Furniture Retail / Development prospects 2017-2019. DEMO VERSION
3.1.4. LEROY MERLIN DETAILS
In 2016, Leroy Merlin opened 17 hypermarkets; in the first half of 2017, the chain opened 3 hypermarkets more in Barnaul,
Khabarovsk, and Moscow, thus operating 62 hypermarkets as of July 1, 2017.
In 2017, Leroy Merlin plans to keep that pace of development and see a revenue increase of no less than 25%.
In 2017-2019, the company wants to focus on developing its chain in Siberia and Far East, in particular to increase its presence
in Omsk and Krasnoyarsk and to enter the markets of Irkutsk and Vladivostok. In 2017-2021, Leroy Merlin plans to invest 400
million euro per annum to advance its operations in Russia. Leroy Marlin plans to enter the Belorussian markets in 2018-2019.
It also expects the number of its hypermarkets to reach 140 by 2020-2021. The company prioritizes cities with a population
above 700 thousand or one million (city proper).
Leroy Merlin actively develops its private labels and systematically searches for Russian supplies to further localize its product
range.
Dynamics of Leroy Merlin revenue per square
Dynamics of Leroy Merlin hypermarkets Leroy Merlin revenue dynamics
meter of retail space
70 250 233 70% 450
64%
Тысячи
400 385 388
60 3 60% 353
200 186 352 343
350 321
50 17 44% 50% 300
150 300 264
39% 265
40 150 40% 250
8 33% 119
29% 30%
26%
30 6 59 100 94 26% 24% 25% 30% 200
6 71 150
20 4 42 20%
2 34 54
3 28 50 38 100
10 3 22 29 10% 50
6 16 18 21
10 13
0 4 0
0 0%
2008 2009 2010 2011 2012 2013 2014 2015 2016 I пол.
2017
No. of hypermarkets opened during the period Revenue per sq. m, thousand rubles per sq. m
Revenue exclusive of VAT, RUB bln Dynamics, % scale
No. of hypermarkets as of the beginning of the period Average revenue per sq. m of top 50 DIY chains, thousand rubles per sq. m
Source: corporate data Source: corporate data, statements of the company according to RAS Source: INFOLine assessments
Prepared in June 2017 by the INFOLine Information Agency
www.infoline.spb.ru | www.advis.ru | +78123226848 | +74957727640 P. 11PART III. RETAILER'S POSITIONS PER SEGMENT
информационное агентство information agency
Non-Food retail chains distribution centers (DC) and Logistics / Development prospects 2017-2019. DEMO VERSION
3.7. NON-FOOD RETAIL CHAINS DISTRIBUTION CENTERS (DC) AND LOGISTICS
In 2016 the company Leroy Merlin (www.leroymerlin.ru) launched an innovative distribution center with the area of 100
thousand square meters in Domodedovo (Moscow Region). The facility is built in the build-to-suit format while its structure
allows for a high operational efficiency due to the traffic capacity of the transition areas, specially designed mezzanine floors
to handle the small orders and buffer storage areas. DC capacities provide for a simultaneous loading and unloading of more
than 89 trailers.
In 2016 the company IKEA (www.ikea.com/ru/ru) started the DC in Yesipovo (Moscow Region). This construction will
increase the size of the existing store by 190 thousand of cubic meters in fact duplicating its performance up to 7.5 thousand
tons per day. The scope of the investments made to the project exceeded 8 bn. RUB.
In 2016 the company Hoff (www.hoff.ru) leased 50 thousand square meters in the storage complex "Severnoye Domodedovo"
(Domodedovo, Moscow Region).
In 2016 the retail chain M. video (www.mvideo.ru) and the company Delovye Linii (www.dellin.ru) introduced the new
delivery format when the commodities are delivered to all the stores in one region simultaneously (Pick-by-Line) and not in a
store-by-store manner. Due to such approach the speed of commodities delivery to the M.video stores increased by 40%.
In 2017 M.video (www.mvideo.ru) is planning to unite two existing storages in Chekhov (Moscow Region). The area of the
central distribution center will be equal to 62 thousand square meters with the storage capacities up to 92 thousand cubic
meters. The structure of handled cargoes will include the full range: starting from major and small household appliances to
the accessories and media carriers. The unification of the storage complexes will allow for speeding of the shipping and
delivery of commodities.
In 2016 the retail chain Sportmaster (www.sportmaster.ru) introduced the project "Cross docking at the entry points"
intended for the optimization of the commodities delivery from the suppliers through the federal distribution centers to
regional storages. The technology application provided for the increase of the federal DC performance due to reduction of a
total traffic of the boxes containing commodities along the conveyor lines and reduce labor input on their handling.
Prepared in June 2017 by the INFOLine Information Agency
www.infoline.spb.ru | www.advis.ru | +78123226848 | +74957727640 P. 12.PART III. RETAILER'S POSITIONS PER SEGMENT
информационное агентство information agency
M&A transactions of Non-Food retail chains / Development prospects 2017-2019. DEMO VERSION
3.8. M&A TRANSACTIONS OF NON-FOOD RETAIL CHAINS
Q1 2016 the company OBI GmbH (www.obi.ru) consolidated its business in Russia finishing the transaction on the buying out
of the share in Sdelai Svoimi Rukami, LLC from its Russian partner Igor Sosin.
In summer 2016 the founder and the principal beneficiary of SBR Corporation, GC (www.metrika.ru) Eugeny Lebedev sold 4
hypermarkerts Metrika located in the company-owned premises with the total area of more than 40 thousand square meters
as well as a number of land lots and pieces of property to the entrepreneurs D. Izbrekht and A.Kaverin. E. Tkebucheva was
appointed as a new General Director of SBR Corporation. The new owners announced their intention to focus onto the holding
real property management for restructuring of the loans and business reorientation. Since November 2016 the founders of SBR
Corporation, LLC, are Staraya Derevnya, LLC (80%) and Semenov Maksim Anatolyevich (20%).
In February 2016 SBR Corporation, GC (www.metrika.ru) sold a land lot and a hypermarket building in Vyborgskoye Shosse
in St. Petersburg to Kesko, GC (www.kesko.fi), developing the DIY chain K-rauta in Russia. In July 2016 a hypermarket K-
rauta was opened at this address (www.k-rauta.ru).
Q4 2016, the founder of the holding Domocentr (www.domocentr.ru) Timofey Kuligin (60%) and his business partner Dmitry
Kruglov (40%) sold their shares in the management company to entrepreneur Vyacheslav Kucherov. The transaction
included transfer of the rights for the brand use while the real property units remained under the management of their former
owners. Mister Kucherov is planning to develop the DIY network under the brand "Domocentr" in the Rostov Region while
having placed the facilities located in the SFD for sale to decrease the debt burden.
In the beginning of 2017 the co-owner of Brozex, GC (www.brozex.com), Vycheslav Brozovskiy purchased 5 retail facilities
SuperStroy (www.stroyarsenal.ru) which were previously under the management of bankrupt Trest SKM, Group of
Companies. Bronzex, GC transferred the acquired facilities under the brand DomoStroy.
Prepared in June 2017 by the INFOLine Information Agency
www.infoline.spb.ru | www.advis.ru | +78123226848 | +74957727640 P. 13.PART III. RETAILER'S POSITIONS PER SEGMENT
информационное агентство information agency
Non-Food retail dismissals and appointments / Development prospects 2017-2019. DEMO VERSION
3.9. NON-FOOD RETAIL DISMISSALS AND APPOINTMENTS
In July 2016 Marchin Rafal Tokazh was appointed as
the General Director of OBI in Russia (www.obi.ru). In September 2016 Milen Genchev was appointed to
He superseded Ian David Strickland as General the position of General Director of IKEA Centres
Director. Previously, Marchin Rafal Tokazh worked as Russia (www.mega.ru). Genchev has been working in
the Director of the Centroobuv retail chain as well as IKEA since 2014, at first as the Financial Director,
the Managing Director of the retail chain Karusel. further – as the Deputy General Director. Now Milen
Genchev is responsible for the development
In July 2016 Adam Rosinski was appointed to the
strategies of the MEGA retail centers and the IKEA
position of Commercial Director of OBI in Russia
property management in Russia.
(www.obi.ru). He superseded Eugeny Drozdov as
Commercial Director. Previously, M. Rosinski worked
At the end of 2016 First Deputy General Director of
as the Procurement Director in OBI Centrala
the company 220 Volt (www.220-volt.ru) Leonid
Systemowa Sp. z o.o.
Dovladbegyan left the company to focus on the
In September 2016 Artyom Taraev was appointed to
development of his own projects. As of the H1 of
the position of General Director of K-rauta (www.k-
2017 Mr. Dovladbegyan is managing the online LED
rauta.ru). He superseded Pavel Lokshin who
agency (www.ledagency.ru).
transferred to Х5 Retail Group to the position of
Director of Perekrestok Express.
In August 2016, Solomon Kunin was appointed to the
At the end of 2016 Pavel Alyoshi stepped down from
position of General Director of Marketplace, LLC, the
the position of General Director of Yandex. Market
operator of the project Goods.ru (www.goods.ru) of
(www.market.yandex.ru) and become one of the
the company M.video. Previously, Mr. Kunin worked
members of the Board of Directors in 220 Volt Group
for Deloitte, Ernst & Young and Lin Consulting.
(www.220-volt.ru). As a new member of the Board of
Directors, Mr. Alyoshin will develop the strategy for
the e-commerce development. Maksim Grishakov
was appointed to the position of General Director of
Yandex.Market in May 2017.
Prepared in June 2017 by the INFOLine Information Agency
www.infoline.spb.ru | www.advis.ru | +78123226848 | +74957727640 P. 14.PART III. RETAILER'S POSITIONS PER SEGMENT
информационное агентство information agency
Non-Food retail dismsissals and appointments / Development prospects 2017-2019. DEMO VERSION
3.10. REBRANDING AND NEW FORMATS OF NON-FOOD RETAIL CHAINS
In 2016 the retail chain Hoff (www.hoff.ru) launched two new formats with the area of less than 2 thousand square meters: Hoff
Mini (with the opportunity to buy goods from a whole range) and Hoff Home (with a special range of household goods). As of
June 2017, the company manages 4 stores under the brand Hoff Mini and 4 stores under the brand Hoff Home.
In 2016 TD Vimos (www.vimos.ru) continued reconstruction of retail facilities and expansion of floor spaces in the NWFD. On
average, the construction base floor spaces increased from 1 to 5 thousand square meters. In 2016 such reconstruction was
conducted in the retail facilities in Kolpino, Tikhvin, Slantsy, Gruzino (Leningrad Region). In 2017 retail facilities' reconstruction is
continuing; besides, opening of 2 or 3 new facilities is ahead. The investment volume planned for 2016-2017 is equal to 1.2 bn.
RUB.
In 2016 the brand of furniture Milano Home Concept (www.mhc.it) entered the Russian market. As of June 2017, there are 4
show rooms working in Moscow and the Moscow Region. It is planned to launch the dozens of show rooms in Moscow and other
Russian regions.
In 2016 the company 220 Volt (www.220-volt.ru) launched the new franchise format – Partner 220. The format stipulates for
the division of partner functions division: the entrepreneurs invest in business while the company conducts operating and
strategic management. In general, the company has been developing franchising for more than 10 years making new formats and
adapting the existing ones with the account of the economic situation.
In 2017 the company 220 Volt (www.220-volt.ru) is planning to open a retail facility of a new enlarged format in Moscow: it will
cover a larger area (750 square meters) and have a broader range (3-4 times broader). It is planned to develop new format
together with the suppliers who will open their stores in the territory of the new facility.
In 2016 the company M.video (www.mvideo.ru) presented a new project called Goods.ru – an online marketplace which shall become a direct
competitor of Yandex.Market. Its principal difference is the availability of the service for buyers (delivery, payment, warranties, etc.). The project
was launched in April 2017. Goods.ru presents household and repair goods, household appliances and electronics and juvenile items. During
the first project stage delivery will be effected only in the territory of Moscow and the Moscow Region.
Prepared in June 2017 by the INFOLine Information Agency
www.infoline.spb.ru | www.advis.ru | +78123226848 | +74957727640 P. 15.PART III. RETAILER'S POSITIONS PER SEGMENT
информационное агентство information agency
Development prospects 2017-2019. DEMO VERSION
STRUCTURE OF PART III The dynamics of market capacity
Retail chains rating
Динамика операционных показателей
The dynamics of operational indicators
Business references of segment leaders
Distribution centers and logistics of retail chains
M&A transactions
Retirements and appointments of TOP managers
Rebranding and development of new trade formats
ПО СЕГМЕНТАМ:
DIY&HOUSEHOLD AND FURNITURE
HOME APPLIANCES, ELECTRONICS, AND MOBILE DEVICES
FASHION (CLOTHES, SHOES, SPORTS GEAR AND ACCESSORIES) AND
BABY GOODS
PHARMACY
COSMETICS AND DROGERIE
E-COMMERCE 46 slides, 51 diagramms
Prepared in June 2017 by the INFOLine Information Agency
www.infoline.spb.ru | www.advis.ru | +78123226848 | +74957727640 P. 16.PART IV. MARKET OF SHOPPING MALLS
информационное агентство information agency
Key highlights of the commercial real estate market / Development prospects 2017-2019. DEMO VERSION
4.1. HIGHLIGHTS OF COMMERCIAL PROPERTY MARKETS
In 2016, 12% less commercial buildings were commissioned compared to 2015: only 10.2 million sq.m.; categories affected
the most were malls (38% less space commissioned) and warehouses (7% less).
FMCG hypermarkets make up for 5% of the total commercial property commissioned; in 2016. 114 such hypermarkets were
opened with their total floorspace equaling 895 thousand sq.m.; 59 of those occupy stand-alone building of a total area of 495
thousand sq.m., which is 14% less than in 2015. The largest hypermarkets then commissioned are: Globus (29 thousand sq.m.,
Odintsovo); O’KEY (19 thousand sq.m., St. Petersburg), and Lenta (Yekaterinburg, 14 thousand sq.m.).
As of DIY, 33 new hypermarkets were opened, 17 of which are Leroy Merlin; however, 34 existing supermarkets were closed,
including ten Metrika and seven Superstroi hypermarkets. 22 of the DIY hypermarkets commissioned occupy stand-alone
buildings with a total floorspace of 210 thousand sq.m., which is 23% more than in 2015.
Commissioning of commercial buildings in Russia Structure of commercial buildings and malls commission in Russia, %
12 30% 100%
26%
25% 25% 25% 90% 22,2% 20,7%
10 21% 12,0 11,6
20% 80% 42,1% 42,9% 45,0%
10,2 10,8% 51,7%
15% 70% 15,2%
8 13%
10% 60% 7,8% 6,0%
6 5% 50% 11,9% 14,8%
3% 16,0%
0% 40% 6,4% 5,0% 16,9%
0% 9,5 -3% 4,6%
4 7,5 7,9 30%
7,1 7,2 -5% 59,3% 58,1% 6,9%
6,0 6,3 6,1
5,2 -9% -12% -10% 20% 39,6% 37,3%
2 -12% 34,5%
-15% 10% 24,5%
-15%
0 -20% 0%
2011 2012 2013 2014 2015 2016 2011 2012 2013 2014 2015 2016*
Buildings, thousands Floorspace, M. sq.m. Floorspace dynamics, % scale Number dynamics, % scale Malls DIY and FMCG hypermarkets Warehousing Other
Source: INFOLine assessments, RSC, UISFS Source: INFOLine, Research “Market of Russian shopping malls” data, RSC, UISFS
Prepared in June 2017 by the INFOLine Information Agency
www.infoline.spb.ru | www.advis.ru | +78123226848 | +74957727640 Р. 17PART IV. MARKET OF SHOPPING MALLS
информационное агентство information agency
Development prospects 2017-2019. DEMO VERSION
Highlights of commercial property markets
STRUCTURE OF PART IV Largest malls commissioned
INFOLine DEVELOPER RUSSIA TOP MALL OWNERS
Key mall market events
Malls at an early stage of construction as of early 2017
12 slides, 5 diagramms
Prepared in June 2017 by the INFOLine Information Agency
www.infoline.spb.ru | www.advis.ru | +78123226848 | +74957727640 P. 18.PART V. NON-FOOD RETAIL FORECASTS PER 2017-2019 SEGMENT
информационное агентство information agency
Russia’s economic development scenarios and highlights / Development prospects 2017-2019. DEMO VERSION
5.1. RUSSIA’S ECONOMIC DEVELOPMENT SCENARIOS AND HIGHLIGHTS
Indicator Scenario 2016 2017F 2018F 2019F
Basic 64,2 69,8 71,2
$ exchange rate (annual average), RUB for USD 66,9
Target 64,2 69,6 70,7
Basic 4,0 4,0 4,0
Inflation, annual average % 7,1
Target 4,0 4,0 4,0
Basic 92,6 96,8 102,0
Nominal GDP, RUB trln. 86,0
Target 92,6 96,9 103,2
Basic 2,0 1,5 1,5
GDP, % -0,2
Target 2,0 1,7 2,5
Basic 2,0 2,2 2,0
Fixed capital investments, % -0,9
Target 2,0 3,9 6,8
Basic 1,0 1,5 1,2
People’s real disposable income, % -5,9
Target 1,0 1,9 2,0
Basic 1,9 2,6 2,5
Retail turnover, % -4,6
Target 1,9 2,9 3,0
Source: EMR Research “Forecast of socio-economic development of the Russian Federation up to 2020" dated from 07.04.04.2017.
Prepared in June 2017 by the INFOLine Information Agency
www.infoline.spb.ru | www.advis.ru | +78123226848 | +74957727640 P. 19.PART V. NON-FOOD RETAIL FORECASTS PER 2017-2019 SEGMENT
информационное агентство information agency
Population’s income and expenditure dynamics forecast / Development prospects 2017-2019. DEMO VERSION
5.3. POPULATION’S INCOME AND EXPENDITURE DYNAMICS FORECAST
The baseline forecast by MED holds that the gross disposable household income will fall to 59.4% of GDP by 2019 (equaled
61.4% of GDP in 2016), with most of that reduction to take place in 2019.
The proportion of net property income to be received by households in 2017–2019 will remain positive and grow slightly to
2.8% (up from 2.6% of GDP in 2016).
By 2018, the rate of household savings will fall to 11.1% of their gross disposable income (down from 12.3% in 2016), i.e. from
7.6% to 6.6% of GDP. The share of disposable income to be spent on consumption will increase to 88.9% by 2019, up from
87.7% in 2016.
MED forecasts that the specific weight of household consumption expenditures in the GDP structure will fall to 53% of GDP
(down from 54% in 2016) under the conditions of moderate recovery growth of real disposable income.
Real wage and income dynamics forecast, % Monthly average nominal wage and per capita income dynamics forecast
10% 8,4% 50
43,1
8% 45 40,8
5,3% 38,4
6% 40 36,7
4,4% 34,0
2,8% 3,3% 2,7% 32,6
4% 35 30,0 30,3 30,8
1,2% 1,3% 1,0% 1,5% 1,3%1,2% 26,8 27,7
2% 0,8% 0,7% 30 25,5
23,4 22,8
0% 25 20,7
-2% -0,7% 20
-4% -3,2% 15
-6% 10
-5,9%
-8% 5
-10% -9,0% 0
2011 2012 2013 2014 2015 2016 2017П 2018П 2019П 2011 2012 2013 2014 2015 2016 2017П 2018П 2019П
Real wage Real income Monthly average nominal accrued wage, thousand rubles Per capita income, thousand rubles
Source: RSC, EMR Source: RSC, EMR
Prepared in June 2017 by the INFOLine Information Agency
www.infoline.spb.ru | www.advis.ru | +78123226848 | +74957727640 Р. 20PART V. NON-FOOD RETAIL FORECASTS PER 2017-2019 SEGMENT
информационное агентство information agency
Development prospects 2017-2019. DEMO VERSION
СТРУКТУРА ЧАСТИ V Russia’s economic development scenarios and highlights
INFOLine-made Non-Food retail development scenarios
Population’s income and expenditure dynamics forecast
Retail turnover forecast
Non-Food retail development forecast
7 slides, 10 diagramms
Prepared in June 2017 by the INFOLine Information Agency
www.infoline.spb.ru | www.advis.ru | +78123226848 | +74957727640 P. 21.NON-FOOD RETAIL AND RUSSIAN CONSUMER MARKET
информационное агентство information agency
Development prospects 2017-2019. DEMO VERSION
SOURCES
FSSS OF RUSSIA. Details of Russia’s Social and Economic Situation.
January–February 2016 // Feb 22, 2017. (Bulletin). Fashion Consulting Group. Opportunities and Risk Zones in Post-Turbulent
CB of RUSSIA. Statistical Bulletin of the Bank of Russia #1 2017 // Feb Fashion Market // Dec 2016 (Study).
17, 2017. (Bulletin). GfK TEMAX®. Russian Home Appliance and Electronics Market in 2016 // Feb
Minekonomrazvitiya of Russia. Social and Economic Development 2017 (Analytical Overview).
Forecast for Until 2020 // Apr 7, 2017. INFOLine. Questionnaires, surveys, and interviews of 200 FMCG chains // Feb
Minekonomrazvitiya of Russia. Social and Economic Development of 2017.
Russia: Outcomes of 2016 // Feb 7, 2017. INFOLine. Questionnaires, surveys, and interviews of 200 Non-Food chains // Feb
FSSS OF RUSSIA. Russian Statistical Yearbook 2016 // December 2016 2017.
(Statistical Compendium). INFOLine. Store Opening and Closure Monitoring // Jan 2017 (Registry).
CB of RUSSIA. Monetary Policy Report // December 2016 (Report). INFOLine. Analytical database: 600 Universal and Specialized DIY Chains in
IFRS accounts and annual reports of international and Russian Russia // Feb 2017 (Registry).
companies. NFOLine. Analytical database: 700 FMCG Chains in Russia // Feb 2017 (Registry).
Euroset. Total Sales in the Russian Portable Electronics Market in 2016 INFOLine. Russia’s DIY Market // April 2017 (Study).
// Feb 2017 (Analytical Oveview). INFOLine. Russia’s Household Market // April 2016 (Study).
Sberbank CIB. Ivanov’s Consumer Index // Apr 2017 (Analytical INFOLine. Russia’s Consumer Market Conditions and Russia’s FMCG Chain
Overview). Rankings // May 2017 (Overview).
GfK TEMAX®. Online Audience Development Trends in Russia in 2016 INFOLine. INFOLine DIY RETAIL RUSSIA TOP // Apr 2017 (Ranking).
// Jan 2017 (Study). INFOLine. INFOLine RETAIL RUSSIA TOP-100 // May 2017 (Ranking).
Nielsen. Online or Offline: Where Do Russians Buy More? // Jan 2017 INFOLine. INFOLine FMCG RETAIL RUSSIA TOP // Jan 2017 (Ranking).
(Study) INFOLine. Homeware and Gardenware Retail Sales, DIY Chains in Russia // Jan
DSM Group. Pharmaceutical Market of Russia // Mar 2017 (Analytical 2016 to May 2017 (Themed News).
Overview). INFOLine. Food Retail Sales, FMCG Chains in Russia // Jan 2016 to May 2017
Outcomes of major retail forums. (Themed News).
Prepared in June 2017 by the INFOLine Information Agency
www.infoline.spb.ru | www.advis.ru | +78123226848 | +74957727640 P. 22.NON-FOOD RETAIL AND RUSSIAN CONSUMER MARKET
информационное агентство information agency
Development prospects 2017-2019. DEMO VERSION
AGREEMENT ON THE USE OF INFORMATION
Subscriber (customer, buyer) may keep and process provided information.
Further distribution, resale, copying and publication of information are prohibited.
No whole provided information or its part can be distributed via the local network, broadcast and transmitted in any form and
by any means, including electronic, mechanical, photocopying, recording or otherwise, without the prior consent of INFOLine.
It is forbidden to transfer information to third-party organizations: subsidiaries, participating companies, any other legal
entities, as well as transfer information to unincorporated structural units established in a different location, including
branches, offices and any other structural units for commercial or non-commercial purposes.
The fulfillment term hereunder is 10 years from the provision of information.
The Subscriber shall not transfer or otherwise assign, in whole or in part, its rights and obligations hereunder without the prior
written consent of INFOLine.
The Subscriber assumes full liability for non-fulfillment of its obligations hereunder under the laws of the Russian Federation.
The provided information means messages and materials of INFOLine information agency (registered by the Federal Service for Supervision of
Communications, Information Technology, and Mass Media (Roskomnadzor) under IA No. FS 77 - 37500).
Prepared in June 2017 by the INFOLine Information Agency
www.infoline.spb.ru | www.advis.ru | +78123226848 | +74957727640 P. 23.NON-FOOD RETAIL AND RUSSIAN CONSUMER MARKET
информационное агентство information agency
Development prospects 2017-2019. DEMO VERSION
INFOLINE
Today, companies are in desperate need of monitoring and analyzing industrial and general economic events in Russia and worldwide.
This is not accomplishable without a professional and efficient information department.
INFOLine is ready to serve you as your information department; our work is for your business to develop and capitalize on; our services
can be accessed by all employees of your company.
INFOLine is an independent company that has been studying various industries of Russia since 2001; studies INFOLine specialists have
carried out in 2001–2017 have been recognized by our numerous clients and partners as best in the market.
199155, St. Petersburg, 28 KIMa Prospekt
www.infoline.spb.ru | www.advis.ru | +78123226848 | +74957727640
mail@advis.ru
Thanks for your attention!
Prepared in June 2017 by the INFOLine Information Agency
www.infoline.spb.ru | www.advis.ru | +78123226848 | +74957727640 P. 24.You can also read