Author Attribution in the Bitcoin Blocksize Debate on Reddit
←
→
Page content transcription
If your browser does not render page correctly, please read the page content below
Author Attribution in the Bitcoin Blocksize
                 Debate on Reddit
                                 Andre Haynes
                                ahaynes@eml.cc
                                  10 July, 2015
            1NDXgokkrWxwisQpGNb9hWwHpE43RQqcSk

                                     Abstract
         The block size debate has been a contentious issue in the Bitcoin com-
      munity on the social media platform Reddit. Many members of the com-
      munity suspect there have been organized attempts to manipulate the
      debate from people using multiple accounts to over-represent and mis-
      represent important issues on the debate. The following analysis uses
      techniques from authorship attribution and machine learning to deter-
      mine whether comments from user accounts that are active in the debate
      are from the same author. The techniques used are able to recall over
      90% of all instances of multiple account use and achieve up to 72% for
      the true positive rate.

1    Introduction
The current block size debate is critical to reach consensus on issues that affect
the scalability and overall future of the Bitcoin network. The process for consen-
sus is one that typically involves Bitcoin core developers, miners, merchants and
other experts and stakeholders, but there has been difficulty reaching a viable
agreement on the block size. The wider community on the social media site Red-
dit has been eager to support the side of the debate they believe is best for the
future of bitcoin. But this has only served to add a lot of noise to the debate and
many bitcoin experts who are active in the Reddit community believe that there
are even organized attempts to manipulate the outcome of the debate by people
using multiple accounts, also known as sock puppets. Two members have gone as
far as offering a bounty for an in-depth analysis indicating the presence (or ab-
sence) of multiple accounts used to manipulate debate. As part of a submission
for this bounty, this report seeks to identify cases of multiple account use on the
Bitcoin subreddit. To do this in an unbiased way, it will use established tech-
niques from authorship attribution studies and machine learning. Assuming the
intended audience may not have much background in statistics or machine learn-
ing, this report will forego many of the technical details, in favor of discussing
the intuition and purpose of the techniques used. Enough technical details and
references will be provided that the analysis can be reproduced. The full project

                                         1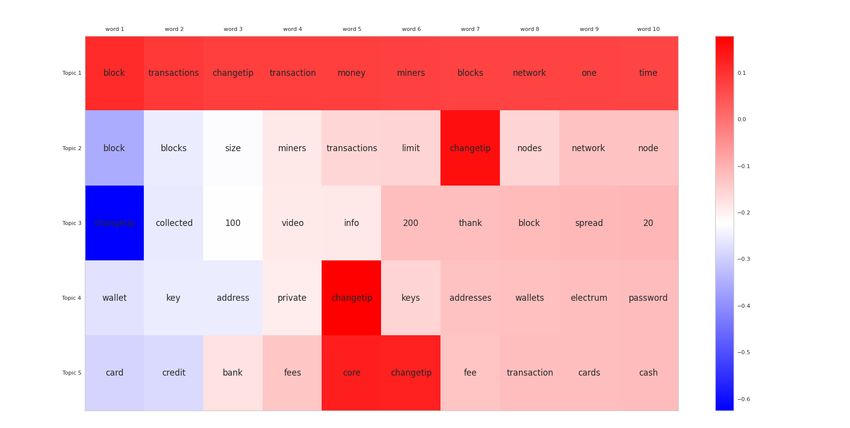
is available at https://github.com/aehaynes/reddit_authorship

    The main idea behind authorship attribution is that by computing some
text based features we can distinguish among texts from different authors [1].
Authorship attribution research is typically concerned with building generative
models for each candidate author, however, this analysis simply aims to con-
struct a discriminative model to determine whether comments from a given pair
of Reddit users originated from the same author. It will use tools from natural
language processing and statistics to engineer features that will measure how
similar two users are based on what they talk about (topical similarity) and how
they talk about it (syntactic similarity). These features will then be used to
train a Random Forests classifier on the binary classification task of predicting
whether or not the topical and syntactic similarity scores indicate the comments
from the two users are from the same author.

    In Section 2 we will discuss the methodology behind data gathering, feature
engineering and classification tasks. Section 3. will discuss the results and
give a brief discussion on their performance. The main report aims to be as
objective as possible, however, identifying cases of manipulation will rely on
some reasonable but subjective assumptions. For this reason, any discussion of
identifying cases of manipulation is left for Appendix I., where we give three
examples of multi-account use for manipulation. The main report will focus on
identifying possible cases of multiple account use.

2     Methodology
2.1    Data
The data was collected from the Bitcoin subreddit using the Reddit API to
retrieve all threads matching a given list of keywords related to the block size
debate (see Appendix IV. for more details). All user comments were retrieved
from the matching threads and stored in a database. Since the block size debate
has been most active over the last year, comments were split into two groups:
the first group treated as ‘seen’ data, containing all comments before 1st June
2014, used to train and test the Random Forests classifier; and the second group
containing all comments from 1st June 2014 to 10th June 2015, treated as ‘un-
seen’ data and used in post-modeling investigation to determine whether there
are in fact authors with multiple user accounts who are active in the debate.

    For both groups only users with 10 or more comments were considered for
analysis. This was done to eliminate possible sources of noise and strengthen
assumptions that rely on large samples for some statistical features in the fea-
ture engineering phase. The comments were pre-processed to remove: common
words — also known as stop words — (e.g. “and”, “the”), URLs, text tagged
as quoted comments, and some special characters including HTML escape codes.

   In this analysis we aggregated all comments for each user to form a profile,
and used it to compute a cumulative representation of that user’s tendencies.
This is in contrast to instance based approaches that consider each item of

                                       2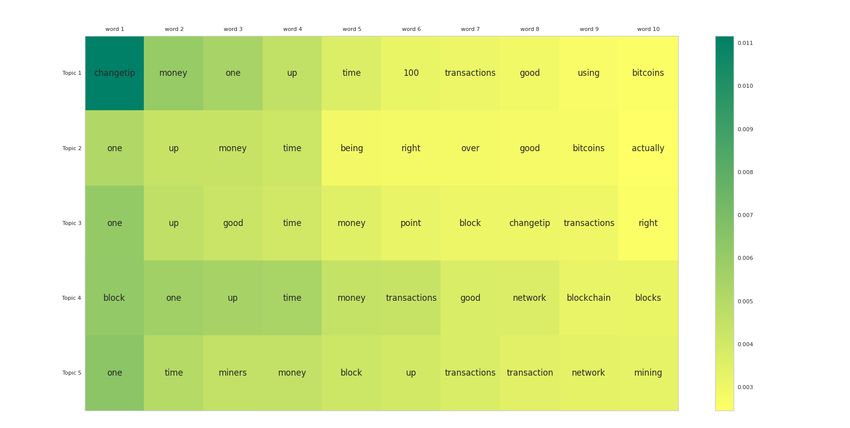
text from an author individually. The instance based approach is sensitive
to variations in style of writing across different contexts — as is the case if
the author was writing for different audiences [1]. Since the data was limited
to one community on Reddit with a relatively fixed audience, it was assumed
that there was no significant variation in writing style across a given user’s
comments. The goal is to represent the general style of each user and not the
separate style of each individual comment. Furthermore, since comments are
often brief, building a profile of a user’s comments helped to avoid missing or
ambiguous measurements for features that were sparse in individual comments.
For example the number of times a semi-colon occurs may be close to zero for
individual comments, but may be higher in an aggregated set of comments.

                   Figure 1: Data flow for creating a profile.

2.2     Feature Engineering
The author discrimination model uses representations of what users comment
about (topics), and the written style of their comments (syntax), as a basis
for judging the similarity between two users. The representations used, view
the collection of texts, also known as a corpus, as a bag-of-words i.e. a collec-
tion of words with no inherent ordering. The bag-of-words approach is used
to generate a family of models known as Vector Space Models. These provide
an algebraic representation of a corpus as a collection of vectors, where each
dimension corresponds to terms that occur in the corpus. The weights of each
component of the vector are typically given by the frequency of the correspond-
ing term in the source text, but there are other weighting schemes such as
term frequency-inverse document frequency (tf-idf). Tf-idf is a cross-entropy
transformation that gives more weight to terms that are frequent in a text but
infrequent across the corpus, and lower weight to terms that are common across
all texts in a corpus, as well as terms that are uncommon across the corpus [2].
In this way, tf-idf re-weights the frequency vector representation of a text, so
that terms that are over used (e.g. in this case, words like “bitcoin”, “blocksize”
etc.) or rarely used have a lower weight. By comparison, terms that are not
common nor infrequent (e.g. “BIP100“) are weighted with a higher value. This
gives a kind of term-relevance model.

2.2.1   Topical Features
Vector space models can also be used to do topic modeling i.e. to identify a
collection of words that best represent salient topics in a corpus. Latent Dirich-

                                        3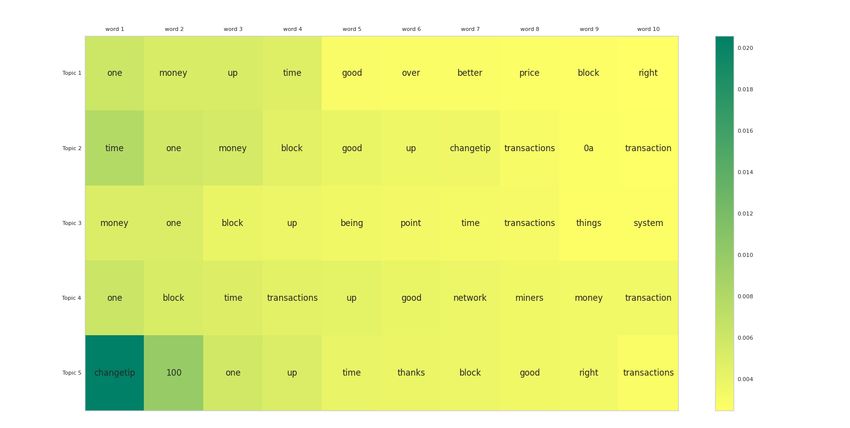
let Allocation (LDA) and Latent Semantic Analysis (LSA) represent two such
    techniques. To keep this discussion brief and non-technical, refer to [3] and
    [4] for the technical details of these algorithms. It is worth noting that they
    determine topics by identifying latent structure in term co-occurrences across a
    corpus.

        LDA is a parametric model that in this context would try to represent each
    comment as a mixture of topics, where each topic has a particular probability
    distribution over the terms in the corpus. LDA requires that the number of
    topics, and the prior or initial distribution of topics across comments (i.e. the
    probability each topic occurs in a comment) is given at the outset. On the
    other hand, LSA only requires that you choose the number of topics. In this
    context, it uses singular value decomposition to compute the hidden relation-
    ships between comment vectors in the vector space model for the corpus [4].
    It is also worth noting that transforming the word vectors using tf-idf before
    applying LSA to the corpus can give significant improvements over using LSA
    on an untransformed corpus.

         Once the topic representations were computed, users topics were compared
    using Hellinger distance for LDA and cosine similarity for LSA (See Appendix
    II. for definitions). Hellinger distance measures the distance between two prob-
    ability distributions and is more appropriate for LDA since it gives topics as a
    probability distribution over words. Cosine similarity gives the normalized Eu-
    clidean distance between two vectors in the LSA space, and was used to measure
    how close the latent topics of users’ comments were.

                      Summary of Features and Similarity Measures
  Type                 Feature           Transformation       Similarity Measure
               word frequency vector          tf-idf             cosine distance
                  LSA topics vector           tf-idf             cosine distance
Topical
                 LDA topics vector            none             Hellinger distance
                    vocabulary set            none              Jaccard distance
                  character 4-grams           tf-idf             cosine distance
                commas per sentence           none            Welch t-test p-value
Syntactic     semi-colons per sentence        none            Welch t-test p-value
                 colons per sentence          none            Welch t-test p-value
                ellipses per sentence         none            Welch t-test p-value
                     total words              none        generalized Jaccard distance
                     total vocab              none        generalized Jaccard distance
Summary           net word diversity          none        generalized Jaccard distance
             word diversity per sentence      none            Welch t-test p-value
                 words per sentence           none            Welch t-test p-value

          Table 1: Features and similarity measures used to judge user similarity.

    2.2.2     Syntactic Features
    The goal of including syntactic features is to develop representations that cor-
    relate with writing style, and compare them across users for similarity. Table 1.
    has a list of the syntactic features and corresponding similarity measures used

                                             4
to compare users for similarity (see Appendix II. for definitions). A few of these
features are worth mentioning in more detail.
Character n-grams view each comment as a collection of n-character se-
quences. For example, the text “block size” would generate the following se-
quence of character 4-grams:
{“bloc”, “lock”, “ock ”, “ck s”, “k si”, “ siz”, “size”}
Character n-grams are able to capture the nuances in writing style, including
persistent grammatical mistakes and unusual uses of punctuation. A user who
has a habit of writing “block-size”, will have several of the previously mentioned
4-grams in common with a user who writes “block size”, but will clearly have
more in common with other users who have the same stylistic preference. See
[1] for a more detailed discussion of character n-grams and why 4-grams perform
well in practice. Similar to the vector space model of terms, a user’s comments
were modeled using a vector of 4-gram sequences weighted by frequency. The
vectors were transformed using tf-idf, and cosine distance was used to measure
the similarity between users.
Also worth mentioning are the features for punctuation rates per sentence.
Consider the number of commas per sentence for a user as a random variable.
The distribution of this random variable is not Gaussian, however, over a large
sample of sentences, Central Limit Theorem implies that the average number
of commas per sentence converges to a Gaussian distribution. Suppose it is
reasonable expect that user accounts controlled by the same author would have
a similar distribution in the number of commas per sentence over a large sample.
A statistical hypothesis test can be constructed to determine if the difference
in the average rate or commas between two users is significant. The most
appropriate test for this is the Welch t-test, since it allows for the standard
deviation of the commas per sentence to be different for the two users. It is
important to note that the resulting p-value is not a valid distance or similarity
measure. The most that can be said of a small p-value is that it suggests there
is no evidence to reject the assumption of no difference in the average comma
rate between the two users. Although the p-value is not a valid measure of
similarity, it is certainly informative in judging whether two users are similar in
the relevant features.
2.3 Classification
A random sample of 60% of the users from the ‘seen’ data was used to gen-
erate training data for binary classification. The remaining 40% was used to
test and compare the classification accuracy under different conditions. Keeping
the users in the training and test set distinct allows us to determine how well
the patterns of similarity learned in the training users generalize to predicting
similarity for a new set of users.
To generate labeled instances of multi-account use for training, each user’s
comments from the training data was randomly and evenly split into two pro-
files, as shown in Figure 1. The features of all user profiles were compared
5to each other (pairwise) using the corresponding similarity measures. Cases
where the comparison was between two profiles from the same user were as-
signed {Label = 1}. These represented a true comparison from the same user.
All other cases representing comparisons between different users were assigned
{Label = 0}.
Figure 2: Data flow for constructing training and test data from profile features.
In the training data there are 1616 users with more than 10 comments.
Splitting each user’s set of comments into two profiles gives 3232 profiles. This
leads to (3232)(3231)
2 = 5, 221, 296 unique comparisons, out of which only 1616
have {Label = 1} (≈ 0.03%). This is known as class imbalance and presents an
interesting challenge for both training a classifier and judging its classification
accuracy. Since {Label = 0} is the dominant class, a uniform random sample of
the training data would result in a classifier that is able to predict instances of
{Label = 0} well, but not {Label = 1}. Furthermore, a classifier that predicts
{Label = 0} for all comparisons would have a prediction accuracy of over 99%,
for predictions on a uniform sample of the test set. Given our goal, this is clearly
not useful.
To address the problem for training, we designed our training set by first
specifying r, the ratio of {Label = 1} samples to {Label = 0} comparisons. All
comparisons where {Label = 1} were chosen, and a random uniform sample of
nr comparisons from {Label = 0} was taken such that,
| {Label = 1} |
r=
nr
A Random Forest classifier was trained on this data and prediction accuracy
was judged on a random sample of the test set with an equal amount of class
{Label = 1} and {Label = 0} comparisons.
Another useful set of measures to judge the performance are precision and
recall. In the context of this problem, precision measures what proportion of
comparisons predicted as having {Label = 1}, were actually cases of the same
user. Recall on the other hand measures what proportion of comparisons that
are actually cases of the same author, were predicted to have {Label = 1}. A
recall score of 1 therefore implies that all cases of {Label = 1} were predicted
to have {Label = 1}; and a precision score of 1 implies that all cases that were
6predicted to have {Label = 1} are actually cases of the same user.
Figure 3: Precision and Recall.
Additionally, a precision vs recall curve can be used to assess how precision
and recall vary over different decision thresholds. The decision threshold is the
value used as a cutoff for the probability of the class prediction. e.g. at a
threshold of 0.5 a binary classifier would predict {Label = 1}, if the predicted
probability of {Label = 1} (given the data) is ≥ 0.5. Precision vs Recall curves
were used to choose the sample ratio and threshold that gave the best precision.
In this problem, it is more useful to have a ‘cleaner’ list of suspects of multi-
account use (high precision), than it is to have a list of suspects that include
all multi-account users and a potentially large number of false positives (high
recall).
73 Results
3.1 Topics
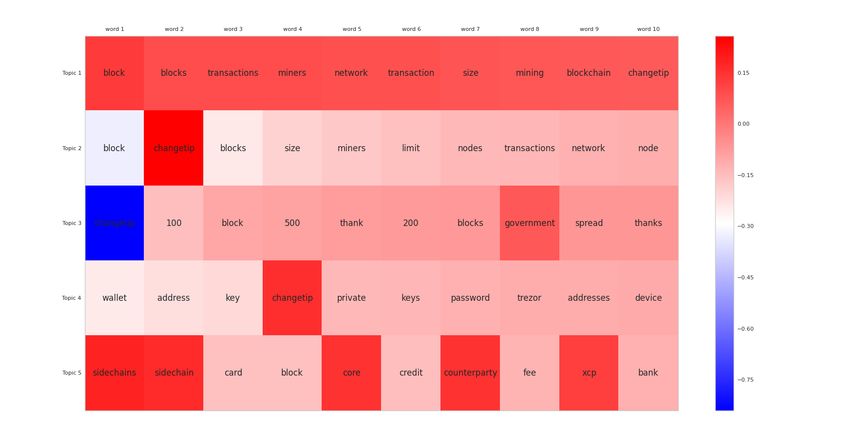
Figure 4. shows the top 5 (of 100) topics computed using LSA for the ‘seen’
data. Within each topic, words of similar color can be thought of as being more
related to each other, while diverging colors represent weaker word associations.
The first topic in LSA is typically interpreted as the most frequent words across
all topics in the corpus; subsequent topics are interpreted as salient groups of
semantic relations. Topic 4 appears to be related to bitcoin wallets, addresses
and private keys, as well as a diverging discussion related to Electrum wallets
and passwords. Topic 3 on the other hand appears to be entirely related to
tipping via changetip.
Figure 4: LSA topics for the ‘seen’ training data.
Topics from LDA did not produce as many meaningful results. This may
be due to not using aggressive stop word removal. This was done to allow
character 4-grams to capture more syntactic nuances. However, LSA appears
to be extremely robust to lack of aggressive stop word removal. Overall, the
100 LSA topics captured around 24% of the variability in the ‘seen’ corpus.
Figure 5. shows the top 5 (of 100) topics using LSA on the ‘unseen’ data.
As expected, there is a fair amount of overlap between topics in the ‘seen’ data
(i.e. comments prior to June 2014) and the ‘unseen’ data. There are noticeable
differences: Topic 5 represents trending discussions related to Counterparty, and
core developers working on sidechains. Topic 4 seems suggests that over the last
year, the Trezor device has become more popular.
8Figure 5: LSA topics for the ’unseen’ data.
Each user’s set of comments are represented as a linear combination of the
100 LSA topics, and in this way LSA can be used to represent what each user
tends to talk about. As was the case with the ‘seen’ data, LDA did not lead to
many meaningful topic words, however, LDA was still included as a feature for
classification. The optimal number of topics for LDA were selected using the
Arun measure (see [6] for more details). To ease the computation and storage
constraints, the number of LSA topics were chosen as the minimum of 100 and
the number of topics that explained 50% of the variation.
3.2 Classification Performance
As mentioned in Section 2., care was needed in designing training and test sets
due to the class imbalance problem. Class {Label = 1} represented less than
1% of the data, therefore a classifier that simply predicts {Label = 0} for all
test cases would achieve a prediction accuracy of over 99% if prediction accuracy
is judged naively on a uniform sample of the test set. Similarly, training the
classifier on a uniform sample of the training set would not give the classifier
enough cases to learn the class {Label = 1} effectively. To investigate the effect
of class imbalance on prediction, the Random Forest classifier was trained on
training samples with different ratios of {Label = 0} to {Label = 1}. For each
sample with sample ratio = r, all training cases with {Label = 1} are chosen,
and cases with {Label = 0} are uniformly sampled such that:
# of observations with {Label = 1}
nr = # of samples with {Label = 0} =
r
Prediction accuracy was judged on a balanced test set with equal samples of
{Label = 0} and {Label = 1}.
9Figure 6: Prediction accuracy and Precision/Recall curves for ‘seen’ test data.
Figure 6. shows how prediction accuracy varies with the sample ratio, r, for
balanced and unbalanced test classes. Prediction accuracy peaks around r = 2
on the balanced test samples. The monotonic improvement of the prediction
accuracy on the unbalanced test classes may be due to seeing more training
samples overall as r is increased. As mentioned in Section 2., the precision and
recall measures are a better judge of performance in the context of this problem.
Sample Ratio Best Precision Recall Threshold
0.1 0.019 0.470 0.99
0.25 0.043 0.377 0.99
0.5 0.103 0.335 0.99
1 0.165 0.260 0.99
2 0.370 0.168 0.99
4 0.428 0.220 0.99
10 0.722 0.110 0.99
Table 2: Best precision for each sample ratio.
Table 2. shows the best precision and corresponding recall and threshold
for the sample ratios used. The classifier trained on samples with r = 10 gave
the best precision of 0.72 at a threshold of 0.99. However, this was only able to
retrieve approximately 10% of the relevant cases of multi-account use. Instead,
the classifier selected for investigating the ‘unseen’ data was trained with r = 10,
and a threshold of 0.96 was used for prediction. This gave a precision of 0.476
and recall of 0.250 on the ‘seen’ test sample. Therefore, this classifier can be
expected to recover at most one quarter of the relevant cases of multi-account
use in the ‘unseen’ data, with at most half of the recovered cases being actual
10instances of multi-account use. Appendix I. further discusses ranking cases of
multi-account use to identify manipulation.
Figure 7: Feature importance scores for the Random Forest classifier.
Figure 7. shows the importance of each feature for discriminating between
user accounts. The topical features were the most important judge of author
similarity with the tf-idf transformed word frequency vector and the LSA topics
being the most dominant. Character 4-grams and commas per sentence were
the most important of the syntactic features.
114 Conclusion
The goal of the bounty was to identify manipulation of the block size debate
from people using multiple accounts as ‘sock puppets’. Objectively identifying
instances of multi-account use gives a systematic way to approach the problem,
by reducing the number of accounts that need to be further analyzed for manip-
ulation. This analysis set out to detect multi-account use in the Reddit Bitcoin
community by using topical features to represent what users talked about and
syntactic features to represent their styles of writing. The resulting model sug-
gested that topical features were the most important for discriminating whether
two users are the same, but this may also be due to the setting of this problem.
On Reddit, comments are usually at most a few sentences long and may not
contain enough information in the syntactic features to discriminate between
users effectively. Other syntactic features such as part of speech tags could
be explored for efficacy, but were not in this analysis due to their high com-
putational cost. Features that required statistical hypothesis tests to inform
their similarity could also be improved by using permutation tests instead of a
Welch t-test. This was not done because it would have required on O(k · m)
computations on average; where 10 ≤ k ≤ 1000 and represents the number of
permutation tests required for a pair of profiles, and m is the number of pairwise
comparisons for all user profiles — approximately 5 × 10⁶ comparisons for the
training data.
There is also room for improving the topic models, in particular the LDA
model. Since many of the topical words in LDA were common, non-informative
words, more aggressive stop word removal is likely to provide significant im-
provements. In practice, LDA generally performs better than LSA at detecting
meaningful topics, but requires more effort to tune parameters and some subjec-
tivity in choosing the number of topics. Non-parametric approaches such as the
Hierarchical Dirichlet Process may provide improvements and less subjectivity.
In spite of these shortcomings, the classifier performed well on the discrim-
ination task, with a peak accuracy of around 85% on the ‘seen’ class balanced
test data. The classifier with 48% precision and 25% recall was chosen to recover
as many relevant instances of multi-account use in the ‘unseen’ data without a
large trade off in the quality of the results. Three probable cases of manipula-
tion are discussed in Appendix I.
The true identity of Satoshi Nakamoto — the creator of bitcoin — remains
an open question. An interesting direction for future work would be to use the
techniques discussed in this analysis to identify probable candidates for Satoshi.
12References
[1] Stamatatos, E. A Survey of Modern Authorship Attribution Methods
[2] Gomaa, W., & Fahmy, A. A Survey of Text Similarity Approaches
[3] Blei, D., Ng, A., & Jordan, M. Latent Dirichlet Allocation
[4] Deerwester, S., Dumais, S., Furnas, G.W., Landauer, T. K., & Harshman
R. Indexing by latent semantic analysis
[5] Wallach, H. Topic Modeling: Beyond Bag-of-Words
[6] Arun, R., Suresh V., Veni Madhavan C. E. & Narasimha Murthy M. N.,
On Finding the Natural Number of Topics with Latent Dirichlet Allocation:
Some Observations
135 Appendix I: Sock Manipulation
5.1 Ranking Manipulation
Applying the selected classifier to the ‘unseen’ data gave 321 pairs of users as
suspects for multi-account use, over 373 unique users. Based on the classifier’s
precision on the ‘seen’ test data (0.476), this implies that at most 152 of these
comparisons are true instances of multi-account use. To further investigate
manipulation in the 321 suspect pairs, consider a mapping from each user to
the set of users they were paired with, including the user themselves:
f : useri 7→ {useri } ∪ {userj |∀userj s.t. (userj , useri ) is a suspect pair}
This mapping along with Jaccard distance (see Appendix II.) can be used to
score how related each pair of the 373 users are based on the users they have in
common as suspect pairs:
pair score(userx , usery ) = Jaccard f (userx ), f (usery )
Under this score, a pair of suspected users who are part of no other suspect pair
would have pair score = 1 and a pair of users who are not part of the same
suspect pair, nor paired with common users would have pair score = 0
A number of reasonable assumptions could be made about the tendencies of
users who use multiple accounts to manipulate threads on Reddit. For example,
one could reasonably assume the accounts they control might have similar user
names, or that the accounts are relatively new, or that they have a tendency
to post around the same time of day. As reasonable as those may be, it is
important to choose assumptions that are as objective as possible, and are not
easily subverted by an attentive manipulator. So far this analysis has assumed
that a manipulator would have a tendency to post in a similar syntactic and
semantic style across multiple accounts, and that this can be discerned from the
classifier we developed. It may also be reasonable to assume that a manipulator
would have some tendency to post in the same threads using these multiple
accounts. We can use Jaccard distance to score pairs of users based on the
threads they have in common:
threads(useri ) = {set of all threads useri commented in }
thread score(userx , usery ) = Jaccard threads(useri ), threads(userj ) ,
Based on these assumptions, suspect pairs were given a score which ranks their
likelihood for manipulation:
rank score(userx , usery ) = thread score(userx , usery )·pair score(userx , usery )
The suspect mapping and sock puppet rankings are available in the project
repository (suspect dictionary.txt and sock rankings.txt). It is hard to judge
the quality of the results without having clear and irrefutable examples of ma-
nipulation. However, the ranked pairs include a few ‘throwaway’ accounts, some
deleted accounts, and even a few account pairs that whose comments seemed to
provide evidence of organized attempts at manipulation. Three selected pairs
of suspects are discussed below.
145.2 Examples of Probable Manipulation
The following are three cases of manipulation found in sock rankings. They
discuss:
1. a false positive case of manipulation
2. a case of manipulation for support
3. a case of manipulation for hostility
5.2.1 (PrimeDice, BitsByDre)
To show the shortcomings of the analysis: this pair received a high manipulation
ranking, but turned out to be an obvious false positive on further investigation.
These users appear to be dedicated tipping accounts. They would have been
classified as the same user since all of their comments include words that engage
the changetip tipping bot (e.g. “changetip”, “bits”, “sent” etc.). This would
explain the high pair score they received. The high thread score may be due
to their activity in the weekly bitcoin tipping threads. Although this is an
extreme example, it demonstrates that even with the manipulation ranking, the
analysis is still highly susceptible to false positives and one should not draw
naive conclusions from the results.
5.2.2 (la0ban, MemoryDealers)
MemoryDealers is a known Reddit account of Roger Ver — a Bitcoin investor
and well known bitcoin personality. He has used it to post on several bitcoin
related threads and on other subreddits. On the other hand, la0ban seems
to be a relatively new and unknown account. la0ban has been very active in
threads related to the scandal between Roger Ver and OKCoin, and the content
of la0ban’s comments suggest it is someone who is privy to more information
than the average Bitcoin sub-reddit poster. la0ban’s posts unusually support-
ive of Roger Ver, and one could even go as far as saying that most of la0ban’s
comments have an agenda that is seemingly in-line with Ver’s.
The ranking identified this as a probable case sock manipulation, and we are
inclined to agree given the nature of the comments. Less rigorous support can be
discerned from the name “laoban” — a Mandarin word, and popular restaurant
in Singapore. The fact that Ver is frequently in Asia, and recently traveled to
Singapore for a bitcoin conference is interesting, but certainly a stretch as far
as reasonable evidence is concerned.
5.2.3 (throwawaybecausemod2, treeorsidechains); KeiserProfile
Apart from the fact that throwawaybecausemod2 seems to be a ‘throwaway’
account by name, all three accounts have been active on threads related to
Peter Todd — a Bitcoin consultant and well known community member. They
typically made comments that are critical of Todd, and at times even hostile
towards him. The pair (’throwawaybecausemod2, ’treeorsidechains’) received
a high ranking but they were also related to the user account KeiserProfile in
the suspect pairs from classification. These accounts are all fairly new, and can
15be interpreted as having similar agendas related to Peter Todd. It is therefore
probable that they represent cases of sock manipulation.
If we can reasonably say that examples 5.2.2 and 5.2.3 represent probable cases
of sock manipulation, then it is likely that there are more cases in the suspect
pairs from classification. Furthermore, since the classifier was shown to recover
at most 25% of all relevant instances of multi-account use, it is likely that there
are even more cases of manipulation that went unaccounted for. Therefore,
guided by the results of this analysis, it is our opinion that there is evidence of
sock manipulation on the Bitcoin Reddit, including threads related to the block
size debate.
6 Appendix II: Similarity Measures
• Cosine similarity:
n
P
xi × yi
x·y i=1
cossim(x, y) = =s s
kxkkyk n
P Pn
(xi )2 × (yi )2
i=1 i=1
where
x = (x1 , x2 , . . . , xn )
y = (y1 , y2 , . . . , yn )
• Jaccard similarity:
|A ∩ B|
J(A, B) =
|A ∪ B|
and
A = B = ∅ ⇒ J(A, B) = 1
• Generalized Jaccard similarity:
P
min(xi , yi )
J(x, y) = P i
i max(x i , yi )
where
x = (x1 , x2 , . . . , xn )
y = (y1 , y2 , . . . , yn )
• Hellinger distance (discrete):
v
u k
1 ut ( √p − √q ) 2
X
H(P, Q) = √ i i
2 i=1
where P and Q are discrete probability distributions such that:
P = (p1 , . . . , pk )
Q = (q1 , . . . , qk )
167 Appendix III: LDA Topic Words
7.1 Top 5 LDA topics for ‘seen’ data
7.2 Top 5 LDA topics for ‘unseen’ data
178 Appendix IV: Data Gathering
See the project repository (https://github.com/aehaynes/reddit_authorship)
for the files mentioned below.
1. The top 200 matching threads for keywords in keywords.txt (one search
per keyword), were retrieved for each of the following sort conditions:
relevance, top, hot, new. For example, for the keyword “blocksize”:
[
Search Results = {search results1 , ..., search results4 }
where
search results1 = search(“blocksize”, sort by = top)
search results2 = search(“blocksize”, sort by = hot)
search results3 = search(“blocksize”, sort by = new)
search results4 = search(“blocksize”, sort by = relevance)
Summary:
Input: keywords list (keywords.txt)
Output: submission id’s for matching threads (submission id.pkl)
2. Given a set of submission id’s, main.py fetched all comments from the
corresponding threads and stored the comments in a sqlite database.
Database schema: (update this to actual variable names)
See info db.py for full schema. The database includes:
• submissionId: reddit submission id
• commentId: id for comment in question (= submissionId if original
post comment)
• parentId: commentId of parent comment (= submissionId if top level
comment i.e. not a nested comment)
• author: username of comment author
• title: title of the thread
• timestamp: UTC timestamp of when comment was made
• upvotes: number of upvotes
• downvotes: number of downvotes
Summary:
Input: submission id’s (submission id.pkl)
Output: database of comments from the threads with corre-
sponding submission id (redditDB.sqlite)
18You can also read