Drug Use Patterns and Trends, 2018 - November 2018 NDEWS Coordinating Center
←
→
Page content transcription
If your browser does not render page correctly, please read the page content below
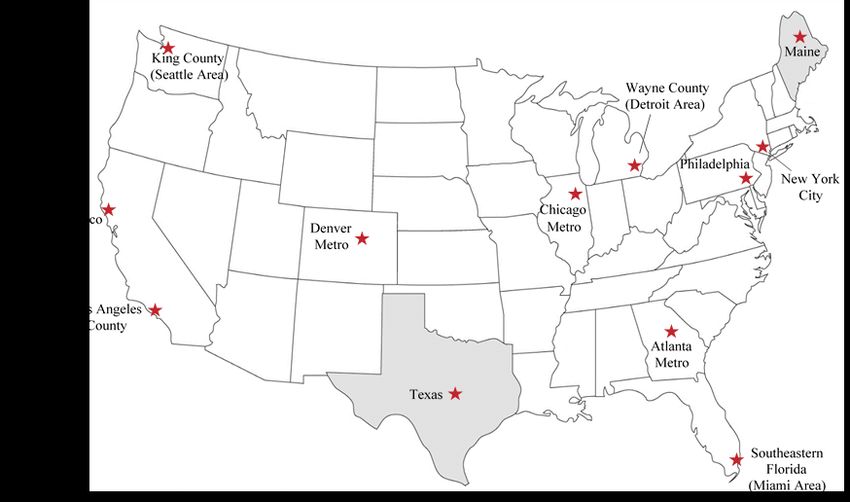
Atlanta Metro
                  Sentinel Community Site (SCS)
                Drug Use Patterns and Trends, 2018

                                                  November 2018

                                   NDEWS Coordinating Center

National Drug Early Warning System (NDEWS) ◊ www.ndews.org ◊ ndews@umd.edu ◊ @ndewsnews ◊ network.ndews.org

         NDEWS is funded under NIDA Cooperative Agreement DA038360 awarded to the Center for Substance Abuse Research (CESAR)
             at the University of Maryland, College Park. Opinions expressed in this report may not represent those of NIH or NIDA.
Sentinel Community Epidemiologists (SCEs)
Atlanta Metro Los Angeles County Philadelphia
Brian J. Dew, PhD Mary-Lynn Brecht, PhD Suet T. Lim, PhD
Dept of Counseling and Psychological Svcs Integrated Substance Abuse Programs City of Philadelphia
Georgia State University University of California at Los Angeles Dept of Behavioral Health and Intellectual
Phone: 404-413-8168 Phone: 310-983-1196 disAbility Services
bdew@gsu.edu lbrecht@ucla.edu Community Behavioral Health
Phone: 215-413-7165
Chicago Metro Maine suet.lim@phila.gov
Lawrence J. Ouellet, PhD Marcella H. Sorg, PhD, RN
School of Public Health Rural Drug and Alcohol Research Program San Francisco
University of Illinois at Chicago University of Maine Phillip O. Coffin, MD, MIA
Phone: 312-355-0145 Phone: 207-581-2596 San Francisco Dept of Public Health
ljo@uic.edu mhsorg@maine.edu Phone: 415-437-6282
phillip.coffin@sfdph.org
Denver Metro Southeastern Florida (Miami Area)
Marion Rorke, MPH James N. Hall, BA King County (Seattle Area)
Dept of Public Health and Environment Center for Applied Research on Substance Use Caleb Banta-Green, PhD, MSW, MPH
City and County of Denver and Health Disparities Alcohol and Drug Abuse Institute
Phone: 720-865-5453 Nova Southeastern University University of Washington
marion.rorke@denvergov.org Phone: 786-547-7249 Phone: 206-685-3919
upfrontin@aol.com calebbg@u.washington.edu
Wayne County (Detroit Area)
Cynthia L. Arfken, PhD New York City Texas
Dept of Psychiatry and Behavioral Denise Paone, EdD Jane C. Maxwell, PhD
Neurosciences Bureau of Alcohol and Drug Use School of Social Work
Wayne State University Prevention, Care and Treatment The University of Texas at Austin
Phone: 313-993-3490 New York City Dept of Health & Mental Phone: 512-656-3361
cynthia.arfken@wayne.edu Hygiene jcmaxwell@austin.utexas.edu
Phone: 347-396-7015
dpaone@health.nyc.govNational Drug Early Warning System (NDEWS)
Atlanta Metro Sentinel Community Site (SCS)
Drug Use Patterns and Trends, 2018
Brian J. Dew, Ph.D., Ned Golubovic, Ph.D., and Josh Castleberry, Ed.S.
Georgia State University
Highlights
• For the first time, the percentage of individuals seeking public substance abuse treatment
primarily for methamphetamine (10.7%) in metropolitan Atlanta exceeded the percentage
seeking treatment for cocaine (10.0%).
• Individuals seeking public substance abuse treatment for methamphetamine were more likely to
be female (53.5%) and White (91.6%). Injection use of methamphetamine was reported in
nearly a quarter of all individuals seeking treatment.
• The number of statewide decedents who had methamphetamine “on board” rose 26.4% from
2016 to 2017, which was the second largest increase of any drug category. Reports from law
enforcement suggest increased purity rates of over 90% and greater supply as primary reasons.
• Despite reports of expanding heroin use across metropolitan Atlanta and Georgia in 2017,
heroin seizures, exposure calls, and deaths for heroin were down compared with the previous
year.
• Multiple law enforcement reports have identified the increased presence of fentanyl and
fentanyl-analogs in metro Atlanta and Georgia in 2017. An increase of counterfeit oxycodone
and hydrocodone pills has been found to contain fentanyl in Atlanta and in Georgia.
• For the first time, U-47770 and carfentanil were found among Georgia decedents in 2017. The
State Medical Examiner found 32 decedents who were positive for U-47770 and 9 decedents
who were positive for carfentanil.
• Although multiple data sources indicate stable availability and use of cocaine in 2017, the
statewide mortality data indicated an increase of 45% of deaths with cocaine on board
compared with the previous year. This increase indicates the largest rise in deaths involving
cocaine use in the last 15 years. A possible explanation for this increase, based on ethnographic
reports and local HIDTA officials’ reporting, is the emergence of the cocaine supply being mixed
with fentanyl.
NDEWS Atlanta Metro SCS Drug Use Patterns and Trends, 2018 1• Numerous indicators suggest that alprazolam continues to be the primary benzodiazepine
abused in metropolitan Atlanta and throughout Georgia. It is the benzodiazepine most
frequently detected in Georgia Poison Control calls, Georgia Medical Examiner results, NFLIS
data, and ethnographic reports with users.
• In 2017, alprazolam ranked as the top drug (n = 576) found in decedents in the Georgia Medical
Examiner’s reports, followed by methamphetamine (n = 479) and oxycodone (n = 469).
• In metropolitan Atlanta, oxycodone is the drug of choice among users of prescription opiates.
• Local ethnographic reports suggest a continued increased demand for higher quality marijuana
and THC-based liquids, with the latter being increasingly smoked in vapor pens and e-cigarettes.
NDEWS Atlanta Metro SCS Drug Use Patterns and Trends, 2018 2NDEWS Priority Substances
COCAINE/CRACK
Key Findings
Although Atlanta has historically been known for its high use of both cocaine hydrochloride and crack
cocaine, multiple data sources (e.g., public substance abuse treatment admissions, Georgia Medical
Examiner’s Office, and Georgia Poison Control Center) indicated a decrease in the drug’s use from 2000
to 2013. Nevertheless, from 2013 to 2016, multiple sources indicated a stabilization at these lower
levels. However, in 2017, several indicators, including local ethnographic reporting with drug users and
information provided by local HIDTA officials, suggest an increase in cocaine-related demand and use in
metropolitan Atlanta. Cocaine-related telephone calls to the Georgia Poison Control Center for
metropolitan Atlanta decreased 6% from 2016 to 2017; however, statewide toxicology results for 2017
showed a 40% increase in decedents with cocaine on board at the time of death. Cocaine law
enforcement seizures have been stable from 2012 through 2017. Local HIDTA officials acknowledge that
in 2017, the demand for cocaine has increased while the retail, midlevel, and wholesale pricing of the
drug has remained stable. The DEA confirmed that the upper range of local cocaine purity has remained
stable from 2016 to 2017, while ethnographic results among local users also suggest consistent cocaine-
related purity rates in 2017 compared with the previous year. The cocaine in Atlanta continues to be
predominantly Columbian, although there have been increasing amounts of higher grade Mexican and
Peruvian cocaine transported into Atlanta.
Local HIDTA officials report 2017 retail prices for crack cocaine to be between $20 and $35 for a rock
and $70 and $100 for a gram of cocaine hydrochloride. Whole prices for cocaine in the first three
months of 2017 averaged between $31,000 and $35,000 per kilogram. These prices reflect a stable
market for cocaine prices over the past three years.
The number of deaths associated with cocaine use in Georgia has fluctuated significantly since 2007. It is
important to note that the use of cocaine statewide was considerably higher between 7 and 10 years
ago. However, public health officials have noted an increase in deaths over the past five years although
cocaine use has dropped considerably in 2012 to 2017 compared with earlier periods. Multiple sources,
including DEA officials, statewide Medical Examiner reports, and ethnographic reporting with drug users,
indicate the presence of the synthetic opiate, fentanyl, mixed with cocaine hydrochloride as a potential
cause of this increase in cocaine-related deaths.
Figure 1. Georgia’s Number of Decedents with Select Drugs on Board at Time of Death (2007–2017)
600
500
400
300
200
100
0
2007 2008 2009 2010 2011 2012 2013 2014 2015 2016 2017
Cocaine Heroin Methamphetamine Fentanyl
Source: Georgia Medical Examiner’s Office.
NDEWS Atlanta Metro SCS Drug Use Patterns and Trends, 2018 3Using patterns and preferred routes of administration related to local cocaine use remained consistent in 2017. Crack cocaine comprised nearly two thirds of all cocaine users in metropolitan Atlanta, and its users continued to be predominantly African American and older than 35 years of age. Users of cocaine hydrochloride tended to be White, young, affluent, and residing in suburban counties. METHAMPHETAMINE Atlanta has traditionally had the highest rates of methamphetamine use among other major U.S. cities east of the Mississippi River. In addition to high rates of use, the purity levels of crystal methamphetamine in Atlanta during 2017 maintained an average of nearly 90%, and conversion of methamphetamine from a liquid to a crystallized form is increasingly being conducted in the city. In fact, two large methamphetamine-related raids took place in the city in 2017 with nearly $16 million worth of the drug being seized. During these two busts, law enforcement officers confiscated 650 lbs. of liquid methamphetamine. The 2017 annual report from Atlanta’s DEA Field Division described local methamphetamine availability as high compared with stable in years 2011 through 2015. The frequency of Georgia deaths where methamphetamine was on board has continued to increase over the last three years. In 2017, there were 479 statewide decedents where methamphetamine was present at the time of death compared with 379 in 2016 and 285 in 2015. Additionally, the number of methamphetamine reports among drug items seized and analyzed by NFLIS in 2017 (n = 5,146) increased in comparison with the previous year (n = 4,680). For the first time, the percentage of individuals seeking public substance abuse treatment primarily for methamphetamine (10.7%) in metropolitan Atlanta exceeded the percentage seeking treatment for cocaine (10.0%). More than 1 in 10 persons seeking substance abuse treatment in metropolitan Atlanta in 2017 did so primarily for methamphetamine use. Individuals seeking methamphetamine-related treatment in 2017 were most likely to be female (53.5%), White (91.6%), between the ages of 26 and 44 years (67%), and smoking the drug (50.8%). Injection use of methamphetamine was reported in nearly a quarter of all individuals seeking treatment. The two most popular secondary substances among methamphetamine users seeking treatment were alcohol (18.2%) and marijuana (16.1%). Because of changes in data reporting systems by the Georgia Department of Human Resources, no metropolitan Atlanta treatment data for 2015 and 2016 was available nor can trending of 2017 treatment data be compared with years prior to 2015. The number of statewide decedents who had methamphetamine “on board” rose 26.4% from 2016 to 2017, which was the second largest increase of any drug category. Reports from law enforcement suggest increased purity rates of over 90% and greater supply as primary reasons. In 2017, pricing for methamphetamine in Atlanta appears to have stabilized following three years of decreasing prices. During 2017, local HIDTA officials report that a gram of crystal methamphetamine could be purchased for $65 per gram and an ounce of the drug could be bought for between $350 and $1,500 with an average cost of $550. Wholesale prices of methamphetamine fluctuated between $10,000 and $16,000. Although ethnographic reports and local HIDTA officials report increasing use of the drug in Atlanta’s African American community, local users of methamphetamine continue to be mostly White. Historically, separate drug distribution systems have existed between methamphetamine and cocaine at the retail level. Therefore, it was uncommon for street dealers to sell both types of stimulants. Conversations with law enforcement officials and results from local ethnographic reporting suggest that greater numbers of retail distributors are now selling both methamphetamine and cocaine. NDEWS Atlanta Metro SCS Drug Use Patterns and Trends, 2018 4
HEROIN

Although Atlanta has been identified by local DEA officials as an emerging primary distribution center for
heroin, multiple drug indicators for 2017 pointed toward a decrease in heroin use. Traditionally known
for having low indicators for heroin, Atlanta has witnessed elevated use of the drug, starting in 2013. As
indicated in Figure 2, heroin comprised 5.3% and narcotic analgesics represented an additional 8.2% of
all drug seizures in metropolitan Atlanta during 2017.

Figure 2. NFLIS Drug Reports* by Selected Drug Categories** of Interest, Number of Drug-Specific
Reports Percentage of Analyzed Drug Category Reports, and Percentage of Total Analyzed Drug
                                                                          Reports, 2017
              Drug Identified,                            Percent of   Percent of
       by Selected Drug Category**               Number Drug Category Total Reports
Total Drug Reports*                               15,642   100.0%        100.0%
Opioids Category                                  2,111    100.0%        13.5%
  Semi-synthetic Opioids                           1807     85.6%        11.6%
HEROIN                                             822      38.9%         5.3%
OXYCODONE                                          585      27.7%         3.7%
HYDROCODONE                                        338      16.0%         2.2%
BUPRENORPHINE                                       38       1.8%         0.2%
HYDROMORPHONE                                       15       0.7%         0.1%
METHORPHAN                                           5       0.2%        < 0.1%
OXYMORPHONE                                          2     < 0.1%        < 0.1%
6-MONOACETYLMORPHINE                                 1     < 0.1%        < 0.1%
DIHYDROCODEINE                                       1     < 0.1%        < 0.1%
  Synthetic Opioids                                304      14.4%         1.9%
TRAMADOL                                            84       4.0%         0.5%
U-47700                                             80       3.8%         0.5%
FENTANYL                                            54       2.6%         0.3%
METHADONE                                           50       2.4%         0.3%
FLUOROISOBUTYRYLFENTANYL                            12       0.6%        < 0.1%
CARFENTANIL                                         10       0.5%        < 0.1%
MITRAGYNINE                                          7       0.3%        < 0.1%
FLUOROFENTANYL                                       3       0.1%        < 0.1%
P-FLUOROBUTYRYL FENTANYL (P-FBF)                     3       0.1%        < 0.1%
PROPOXPHENE                                          1     < 0.1%        < 0.1%

Source: Adapted by the NDEWS Coordinating Center from data provided by the U.S. Drug Enforcement Administration (DEA),
Diversion Control Division, Drug and Chemical Evaluation Section, Data Analysis Unit. Data were retrieved from the NFLIS Data
Query System (DQS) on June 13, 2018.

However, heroin-related seizures from the National Forensic Laboratory Information System decreased
from 892 in 2016 to 822 in 2017. Georgia Medical Examiner’s Office results from heroin found among
decedents decreased from 2016 to 2017 (60 vs. 42). In 2017, more than 24% of all decedents tested
positive for heroin and nearly a third of this total reported positive results for fentanyl. Calls from the
Georgia Poison Control for metropolitan Atlanta doubled from 54 in 2012 to 91 in 2015. However, a
reversal two-year trend continued in 2017 as the number of calls decreased for metropolitan Atlanta
from 91 in 2015 to 81 in 2016 to 76 in 2017. Around 5% of all public primary substance abuse treatment
admissions in metropolitan Atlanta was for heroin, ranking behind alcohol, cocaine, marijuana,
methamphetamine, and prescription opioids.

NDEWS Atlanta Metro SCS Drug Use Patterns and Trends, 2018                                                                      5
The supply of heroin has continued to increase because of large shipments from South America and Mexico coming directly into Atlanta from 2013 to 2017. Additionally, new and continued use of heroin among young adults (18–28 years old) in mostly White, suburban areas have largely fueled the increased demand for the drug. For years prior to 2014, the sale of heroin was conducted in open air markets in a part of the inner city named “The Bluff.” When substance abuse treatment admissions for heroin were less than 3.5% annually (years prior to 2014), the exchange of the drug, even among those persons who lived in the suburbs and other parts of the city, largely took place in this neighborhood. Users would enter The Bluff by car or public transportation, purchase their heroin, and return home. In 2014, retail distribution of heroin, as a result of increased law enforcement presence in The Bluff and of increased demand among more affluent young adults, was conducted more extensively throughout the city, especially in less urban, White suburbs in Northwest and Northeast Atlanta. PRESCRIPTION OPIOIDS Among individuals seeking public substance abuse treatment in metropolitan Atlanta, nearly 7% identified prescription opioids as their primary concern. Although 2.3% reported hydrocodone-related products, 4.7% identified oxycodone as the primary reason for seeking treatment. When considering both primary and secondary reasons for seeking substance abuse treatment, over 11% identified prescription opioids upon admission. Persons seeking treatment primarily for prescription opioids were evenly likely to be male or female, and they were more likely to be White and between the ages of 26 and 44 years. Among seizures analyzed by NFLIS, oxycodone was the leading prescription opioid reported (3.7%), followed by hydrocodone (2.2%). Compared with 2016, the number of oxycodone seized items decreased in 2017 (664 vs. 585) and the number of hydrocodone seized items also decreased in 2017 (424 vs. 338). The combined number of seized items tested by NFLIS found for oxycodone and hydrocodone outnumbered seized items for heroin. Ethnographic reports have found increasing numbers of counterfeit prescription opioid tablets in metropolitan Atlanta. Fentanyl and other prescription opioids have been found in oxycodone and hydrocodone pills distributed at “street level.” FENTANYL AND OTHER NONPRESCRIPTION SYNTHETIC OPIOIDS The decrease in heroin prevalence across indicators does suggest a reversal in trend compared with the previous four years. This reversal aligns with ethnographic reports with local heroin users, which indicate a greater prevalence of fentanyl in the retail heroin market. This increased presence of fentanyl appeared in multiple data indicators, including multiple law enforcement reports that have identified the increased presence of fentanyl and fentanyl-analogs in metro Atlanta and Georgia in 2017. Fentanyl has also been identified as a drug that is frequently used in combination with other opiates (e.g., heroin) and stimulants (e.g., cocaine). An increase of counterfeit oxycodone and hydrocodone pills has been found to contain fentanyl in Atlanta and in Georgia. Among decedents reported by the Georgia Medical Examiner’s Office, following a tripling of cases that tested positive for fentanyl from 2014 to 2015, there has been a stabilization of fentanyl-related deaths in 2016 and 2017 (222 vs. 226). Local HIDTA officials have corroborated local ethnographic reports that Atlanta’s heroin supply is being cut with fentanyl. Nevertheless, the lack of increases in heroin and fentanyl-related deaths could also be caused by recent legal changes aimed at increasing access to naloxone. A notable finding was that for the first time, U-47700 and carfentanil were found among Georgia decedents in 2017. The State Medical Examiner found 32 decedents who were positive for U-47700 and NDEWS Atlanta Metro SCS Drug Use Patterns and Trends, 2018 6
9 decedents who were positive for carfentanil. In previous years, the State Medical Examiner’s Office
had found no reports of U-47700 or carfentanil. NFLIS-related drug seizure data also found increases in
2017 for both U-47700 and carfentanil compared with the previous year. The number of drug seizures
for U-47700 totaled 80 in 2017 compared with 14 in 2016, and the total for carfentanil in 2017 was 10
compared with 1 in the previous year. It is important to note that the total number of U-47700 seizures
reported by NFLIS in 2017 outnumbered the total number of fentanyl seizures during the same year.

                            Other Priority Substances in Atlanta

BENZODIAZEPINES

Although data indicators related to the supply of, use of, and demand for benzodiazepines were mixed
in metropolitan Atlanta in 2017, numerous indicators suggest that alprazolam continued to be the
primary benzodiazepine abused in metropolitan Atlanta and throughout Georgia. Alprazolam continued
to be the preferred benzodiazepine, followed by diazepam, and lorazepam among statewide decedents
across the state of Georgia. In 2017, Alprazolam ranked as the top drug (n = 576) found in decedents in
the State’s Georgia Medical Examiner’s reports. Mortality data reviewed in 2017 has shown an uptick of
16% in deaths with benzodiazepines on board. However, seizures analyzed by NFLIS for 2017 indicate a
significant decrease in the number of alprazolam-related seizures compared with 2016 (1,017 vs. 1,345).
As indicated in Figure 3, the number of benzodiazepine-related drug poisoning calls in Atlanta during
2017 decreased over 16.2% from the previous year.

Figure 3. Drug Poisoning Calls in Metropolitan Atlanta by Select Drug (2012–2017)

            1600
            1400
            1200
            1000
              800
              600
              400
              200
                 0
                          2012          2013           2014       2015     2016   2017

                                      Benzos        Cocaine      Heroin   Meth

          Source: Georgia Poison Control Call Volume Database.

Results from ethnographic reporting indicated a continued supply of, and preference for, liquid
alprazolam, which could be purchased for between $2 and $3 per milliliter in metropolitan Atlanta.
Retail pricing for 1-milligram “blue footballs” (nickname commonly used to describe a 1-mL dose of

NDEWS Atlanta Metro SCS Drug Use Patterns and Trends, 2018                                                7
alprazolam in pill form) in Atlanta has stabilized between $2 and $3 in 2017. For the 2-mg alprazolam
bars, the cost continued to range between $5 and $10.
MARIJUANA
In 2017, marijuana remained the most widely available and commonly used illicit drug in both
metropolitan Atlanta and Georgia. Availability remained high, whereas demand for marijuana containing
elevated THC increased. In addition, recent results from ethnographic reporting and discussions with
local Drug Enforcement Administration (DEA) officials indicated a sharp increase in demand for liquid
THC that could be consumed via e-cigarette and/or vapor technologies. Georgia has passed several drug-
related laws that expand the medical use of THC-based oils, both in the quantity of the substance one
can carry and the number of permissible medical conditions allowing for its use. Liquid forms of THC can
be purchased in local smoking-oriented stores (e.g., head shops), via the Internet, and mail-ordered
from states like Colorado and Washington. Prices for liquid THC in 2017 ranged from $15 to $40 per
cartridge, and users reported that supply was increasing in metropolitan Atlanta.
Atlanta continued to serve as a primary distribution center for marijuana. The majority of marijuana
available in Atlanta continued to come from Mexico, with smaller amounts originating in Canada and the
Caribbean. Local HIDTA officials, along with results from local ethnographic reporting, noted increases in
THC levels found in Mexican-produced marijuana in Atlanta. Law enforcement officials suggested that
this increase in purity was an effort on behalf of Mexican growers and distributors to compete with
higher quality domestic marijuana grown in Colorado, Washington, and California.
Results from the Georgia Poison Control center indicated a recent uptick in marijuana-related calls,
especially at the state level. Marijuana-related calls for metropolitan Atlanta increased from 51 in 2012,
58 in 2013, 61 in 2014, 85 in 2015, and 99 in 2016, whereas statewide calls increased from 87 to 186
during this same time period. Results from seizure data from NFLIS have found downward trends in
marijuana, while reporting increases in THC products. NFLIS seizure data has shown a 65% increase in
THC seizures from 2016 to 2017 and a 65% decrease in Cannabis seizures during this two-year period.
Infectious Diseases Related to Substance Abuse
According to the Georgia Department of Public Health, the number of new HIV diagnoses in
metropolitan Atlanta fell 15.5% in 2016, reversing a three-year trend of increasing numbers of new HIV
infections. There were 1,577 new HIV diagnoses in metropolitan Atlanta in 2016 compared with 1,867
new HIV infections in 2015, 1,764 in 2014, and 1,665 in 2013. Males continued to account for the
majority of new infections in 2016 (81%) although this rate decreased from the previous year when 83%
of newly diagnosed individuals were male.
Male-to-male sexual contact (MSM) remained the most prevalent transmission category accounting for
72% of total transmissions (1,133). These results for MSM sexual contact reflect a nearly identical
percentage when compared with results from 2015. Injection drug use (IDU) accounted for 2% of new
transmissions (35) in 2015, which was identical to the rate reported in the previous year, and MSM/IDU
accounted for additional 2% (25), indicating no change in prevalence compared with 2015.
NDEWS Atlanta Metro SCS Drug Use Patterns and Trends, 2018 8Among persons diagnosed in 2016, African American/Black accounted for 73% (1,157), Whites
accounted for 13% (201), and Hispanic/Latino made up 8% (119) of new infections. Nearly half (48%) of
new infections in 2016 were among persons younger than the age of 30 years.
New Substance-Related Legislative and Policy Updates
In March 2017, GAHB64, a bill focusing on the regulation of THC oil, was introduced to the Georgia
House of Representatives This law, if passed, would have introduced circumstances for lawful
possession and control of certain amounts of low-THC oil. The bill also introduced licensing for
cultivation of cannabis for the purpose of producing, processing, and dispensing THC oil in Georgia. An
expansion of the state’s existing medical marijuana program, this bill would have legalized the
harvesting and distribution of THC oil and was an effort to address lack of access of the product in areas
of Georgia due to state laws banning growing, buying, or transporting of the drug. GAHB64 did not pass
the most recent Georgia General Assembly session, but it is expected to be reintroduced during the next
legislative session.
In April 2017, the “Jeffrey Dallas Gay Jr. Act, a bill that allows for the opioid antagonist naloxone to be
sold over the counter without a prescription, went into effect. Under this law, Georgia health officers
are allowed to issue standing orders to prescribe opioid antagonists (naloxone) on a statewide basis.
This passage of this bill allows pharmacists to dispense an opioid antagonist to any person at risk of
experiencing an opioid-related overdose or to a pain management clinic, first responder, harm reduction
organization, family member, friend, or other person in a position to assist a person at risk of
experiencing an opioid-related overdose. Additionally, this bill provides immunity from any civil or
criminal liability, for the pharmacist dispensing the opioid antagonists and person administering the
opioid antagonist.
On May 4, 2017, HB 249 was signed by Govern Nathan Deal and was enacted January 1, 2018. This bill
addressed issues of opioid abuse by moving the Prescription Drug Monitoring Program (PDMP) from the
Georgia Drugs and Narcotics Agency to the Department of Public Health. This bill requires doctors to
check the state PDMP before prescribing all opioids and all benzodiazepines. This law was a significant
legislative step in curbing opioid abuse by helping doctors avoid writing overlapping prescriptions or
prescribing drugs with potentially harmful interactions.
In July 2017, Georgia Senate Bill 16 took effect throughout the state. This bill allows for an individual
with a registration card issued by the Department of Public Health to possess up to 20 fluid ounces of
low levels of THC oil and permits reciprocity of medical cannabis registration cards between Georgia and
other states so long as the medical cannabis in a person’s possession meets Georgia’s legal
requirements. The implementation of this bill also increased the list of medical conditions that are
eligible for treatment with medical cannabis. The medical conditions included in this policy were
Tourette’s syndrome, autism spectrum disorder, epidermolysis bullosa, Alzheimer’s disease, AIDS, and
peripheral neuropathy. Lastly, this law changes the reporting requirements for doctors, reducing the
reporting schedule from quarterly to semi-annually and including the THC levels used in treatment.
NDEWS Atlanta Metro SCS Drug Use Patterns and Trends, 2018 9In May 2018, Govern Nathan Deal signed House Bill 65 into law. This Bill expanded Georgia Senate Bill 16, adding PTSD and intractable pain to the list of conditions eligible for treatment by low THC oil. The bill took effect on July 1, 2018. NDEWS Atlanta Metro SCS Drug Use Patterns and Trends, 2018 10
Treatment Tables

NDEWS Atlanta Metro SCS Drug Use Patterns and Trends, 2018        11
Table 1: Trends in Admissions* to Programs Treating Substance Use Disorders, Atlanta MSA^Residents, 2013-2017
             Number of Admissions and Percenage of Admissions with Selected Substances Cited as Primary Substance at Admission, by Year and Substance

                                                                                                             Calendar Year
                                                              2013                         2014                       2015                       2016                         2017
                                                     (#)               (%)        (#)              (%)       (#)              (%)       (#)              (%)       (#)               (%)
Total Admissions (#)                               unavail           unavail     unavail          unavail   unavail          unavail   unavail          unavail   18,915             100%
Primary Substance of Abuse (%)
Alcohol                                             unavail            unavail   unavail          unavail   unavail          unavail   unavail          unavail    8,029             42.4%
Cocaine/Crack                                       unavail            unavail   unavail          unavail   unavail          unavail   unavail          unavail    1,890             10.0%
Heroin                                              unavail            unavail   unavail          unavail   unavail          unavail   unavail          unavail    1,001              5.3%
Prescription Opioids                                unavail            unavail   unavail          unavail   unavail          unavail   unavail          unavail    1,277              6.8%
Methamphetamine                                     unavail            unavail   unavail          unavail   unavail          unavail   unavail          unavail    2,017             10.7%
Marijuana**                                         unavail            unavail   unavail          unavail   unavail          unavail   unavail          unavail    3,837             20.3%
Benzodiazepines                                     unavail            unavail   unavail          unavail   unavail          unavail   unavail          unavail      264              1.4%
MDMA                                                unavail            unavail   unavail          unavail   unavail          unavail   unavail          unavail          20           0.1%
Synthetic Stimulants                                unavail            unavail   unavail          unavail   unavail          unavail   unavail          unavail      346              1.8%
Synthetic Cannabinoids**                            unavail            unavail   unavail          unavail   unavail          unavail   unavail          unavail   unavail            unavail
Other Drugs/Unknown                          unavail       unavail      unavail        unavail       unavail       unavail       unavail     unavail           234          1.2%
NOTES:
^Atlanta MSA: Includes the following 29 counties—Barrow, Bartow, Butts, Carroll, Cherokee, Clayton, Cobb, Coweta, Dawson, DeKalb, Douglas, Fayette, Forsyth, Fulton, Gwinnett,
Haralson, Heard, Henry, Jasper, Lamar, Meriwether, Morgan, Newton, Paulding, Pickents, Pike, Rockdale, Spalding, and Walton.
*Admissions: Includes admissions to publicly funded programs. Each admission does not necessarily represent a unique individual because some individuals are admitted to treatment
more than once in a given period.
**Marijuana/Synthetic Cannabinoids: The data do not differentiate between marijuana and synthetic cannabinoids.
unavail: Data not available.

SOURCE: Data provided to the Atlanta Metro NDEWS SCE by the Georgia Department of Human Resources.

          NDEWS Atlanta Metro SCS Drug Use Patterns and Trends, 2018                                                                                                           12
Table 2: Demographic and Drug Use Characteristics of Treament Admissions* for Select Primary Substances, Atlanta MSA^ Residents, 2017
Number and Percentage of Admissions, by Primary Substance with Selected Demographic and Drug Use Characteristics
Primary Substance
Benzo- Synthetic Synthetic
Alcohol Cocaine/Crack Heroin Prescription Opioids Methamphetamine Marijuana**
diazepines Stimulants Cannabinoids**
# % # % # % # % # % # % # % # % # %
Number of Admissions (#) 8,029 100% 1,890 100% 1,001 100% 1,277 100% 2,017 100% 3,837 100% 264 100% 346 100% unavail unavail
Sex (%)
Male 5,033 62.7% 1,063 56.2% 594 59.3% 634 49.6% 937 46.5% 2,453 63.9% 135 51.1% 196 56.6% unavail unavail
Female 2,955 36.8% 827 43.8% 407 40.7% 643 50.4% 1,080 53.5% 1,383 36.0% 129 48.9% 150 43.4% unavail unavail
Race/Ethnicity (%)
White, Non-Hisp. 3,294 41.0% 351 18.6% 650 64.9% 1,030 80.7% 1,848 91.6% 1,190 31.0% 214 81.1% 286 82.7% unavail unavail
African-Am/Black, Non-Hisp 4,147 51.7% 1,435 75.9% 282 28.2% 205 16.1% 109 5.4% 2,312 60.3% 34 12.9% 38 11.0% unavail unavail
Hispanic/Latino 312 3.9% 43 2.3% 37 3.7% 32 2.5% 53 2.6% 194 5.1% 14 5.3% 16 4.6% unavail unavail
Asian/Pacific Islander 187 2.3% 48 2.5% 22 2.2% 3 0.2% 7 0.3% 82 2.1% 2 0.8% 2 0.6% unavail unavail
Other 89 1.1% 13 0.7% 10 1.0% 7 0.5% 0 0.0% 59 1.5% 0 0.0% 4 1.2% unavail unavail
Age Group (%)
Under 18 40 0.5% 1 0.1% 0 0.0% 1 0.1% 5 0.2% 169 4.4% 2 0.8% 2 0.6% unavail unavail
18-25 566 7.0% 84 4.4% 147 14.7% 171 13.4% 299 14.8% 1,197 31.2% 35 13.3% 64 18.5% unavail unavail
26-44 3,493 43.5% 664 35.1% 549 54.8% 757 59.3% 1,351 67.0% 1,905 49.6% 120 45.5% 218 63.0% unavail unavail
45+ 3,930 48.9% 1,141 60.4% 305 30.5% 90 7.0% 520 25.8% 566 14.8% 59 22.3% 62 17.9% unavail unavail
Route of Administration (%)
Smoked 26 0.3% 1,270 67.2% 48 4.8% 13 1.0% 1,025 50.8% 3,665 95.5% 1 0.4% 121 35.0% unavail unavail
Inhaled 0 0.0% 445 23.5% 196 19.6% 30 2.3% 268 13.3% 17 0.4% 4 1.5% 52 15.0% unavail unavail
Injected 3 0.0% 41 2.2% 694 69.3% 32 2.5% 478 23.7% 1 0.0% 1 0.4% 60 17.3% unavail unavail
Oral/Other/Unknown 8,000 99.6% 134 7.1% 63 6.3% 1,202 94.1% 246 12.2% 184 4.8% 258 97.7% 131 37.9% unavail unavail
Secondary Substance (%)
None 3,445 42.9% 446 23.6% 241 22.1% 526 41.2% 875 43.4% 2,138 55.7% 169 64.0% 171 49.4% unavail unavail
Alcohol 0 0.0% 645 34.1% 99 9.9% 176 13.8% 368 18.2% 346 9.0% 23 8.7% 36 10.4% unavail unavail
Cocaine/Crack 1,722 21.4% 0 0.0% 240 24.0% 131 10.3% 189 9.4% 468 12.2% 19 7.2% 42 12.1% unavail unavail
Heroin 74 0.9% 46 2.4% 0 0.0% 130 10.2% 69 3.4% 224 5.8% 5 1.9% 29 8.4% unavail unavail
Prescription Opioids 167 2.1% 16 0.8% 186 12.0% 0 0.0% 48 2.4% 84 2.2% 17 6.4% 11 3.2% unavail unavail
Methamphetamine 271 3.4% 42 2.2% 106 10.6% 42 3.3% 0 0.0% 265 6.9% 4 1.5% 9 2.6% unavail unavail
Marijuana** 2,074 25.8% 384 20.3% 122 12.2% 151 11.8% 325 16.1% 0 0.0% 9 3.4% 35 10.1% unavail unavail
Benzodiazepines 115 1.4% 5 0.3% 22 2.2% 46 3.6% 92 4.6% 32 0.8% 0 0.0% 3 0.9% unavail unavail
Synthetic Stimulants 75 0.9% 3 0.2% 111 7.0% 24 1.9% 48 2.4% 28 0.7% 11 4.2% 0 0.0% unavail unavail
Synthetic Cannabinoids** unavail unavail unavail unavail unavail unavail unavail unavail unavail unavail unavail unavail unavail unavail unavail unavail unavail unavail
NOTES:
^Atlanta MSA: Includes the following 29 counties—Barrow, Bartow, Butts, Carroll, Cherokee, Clayton, Cobb, Coweta, Dawson, DeKalb, Douglas, Fayette, Forsyth, Fulton, Gwinnett, Haralson, Heard, Henry, Jasper, Lamar, Meriwether, Morgan, Newton,
Paulding, Pickents, Pike, Rockdale, Spalding, and Walton.
*Admissions: Includes admissions to publicly funded programs. Each admission does not necessarily represent a unique individual because some individuals are admitted to treatment more than once in a given period.
**Marijuana/Synthetic Cannabinoids: The data do not differentiate between marijuana and synthetic cannabinoids.
unavail: Data not available; Percentages may not sum to 100 due to missing data, rounding, and/or because not all possible categories are presented in the table. Category frequencies may not sum to drug total due to missing data and/or not all
possible categories are presented in the table.
SOURCE: Data provided to the Atlanta Metro NDEWS SCE by the Georgia Department of Human Resources.
NDEWS Atlanta Metro SCS Drug Use Patterns and Trends, 2018 13Sources DATA FOR THIS REPORT WERE DRAWN FROM THE FOLLOWING SOURCES: Forensic drug analysis data came from the National Forensic Laboratory Information System (NFLIS) and represent evidence seized in suspected drug cases throughout metropolitan Atlanta that were tested by the GBI Forensic Laboratory from 2011 to 2017. NFLIS methodology allows for the accounting of up to three drugs for each item submitted for analysis. The data presented are a combined count, including primary, secondary, and tertiary reports for each drug. Data for 2017 are preliminary and subject to change. Newly diagnosed HIV cases for Metro Atlanta in 2016 were provided by the Georgia Department of Human Resources’ Public Health Department. Results from 2013, 2014, and 2015 were compared in this report. Law enforcement reports of local drug use trends, prices, and availability were obtained from officials at the Atlanta High Intensity Drug Trafficking Area (HIDTA). Annual meetings with HIDTA staff are supplemented with multiple telephone consultations throughout the year. Drug use trends, prices, and supply have been reported from 2010 to 2016. Public substance abuse treatment admissions for 2017 have been provided by the Georgia Department of Human Resources. Due to a recent changeover in reporting systems, no data were included in this report for 2015 and 2016 nor can this data be compared with previous years due to varying reporting systems. State drug-related mortality data were obtained from the Georgia Medical Examiner’s Office. Data represent the number of postmortem specimens that tested positive for a particular drug and were collected from fiscal years (FYs) 2007 through 2017. Poison exposure call data were extracted using general terms from the Georgia Poison Control Center and represent the count of drug exposure calls by drug from 2006 to 2017. Qualitative information and purity data are a result of street-level ethnographic reporting with drug users and law enforcement officials in the metropolitan Atlanta area. Due to the SCE’s research efforts over the past 15 years, relationships with persons involved with local illicit drug distribution have been maintained that allow for the corroboration of information with other data sources. For additional information about the drugs and drug use patterns discussed in this report, please contact Brian J. Dew, Ph.D., Associate Professor and Chair, Department of Counseling and Psychological Services, Georgia State University, P.O. Box 3980, Atlanta, GA 30302, Phone: 404–413–8168, E-mail: bdew@gsu.edu. NDEWS Atlanta Metro SCS Drug Use Patterns and Trends, 2018 14
You can also read