Advanced Microwave Atmospheric Sounder (AMAS) Channel Specifications and T/V Calibration Results on FY-3C Satellite
←
→
Page content transcription
If your browser does not render page correctly, please read the page content below
IEEE TRANSACTIONS ON GEOSCIENCE AND REMOTE SENSING, VOL. 53, NO. 1, JANUARY 2015                                                                   481

              Advanced Microwave Atmospheric Sounder
               (AMAS) Channel Specifications and T/V
                Calibration Results on FY-3C Satellite
                                               He Jieying, Zhang Shengwei, and Wang Zhenzhan

   Abstract—The Advanced Microwave Atmospheric Sounder
(AMAS) is the new generation of Microwave Humidity Sounder
(MWHS) onboard the Feng Yun 3 C/D (FY-3C/D) satellite and
follows the heritage and development of MWHS onboard the
FY-3(A/B) satellite. AMAS onboard the FY-3C satellite is a
15-channel total power microwave radiometer in the range of
89–191 GHz scheduled to be launched on September 23, 2013.
Compared to MWHS onboard FY-3A/B, AMAS improves chan-
nel characteristics by adding eight horizontal polarized channels
near 118.75 GHz, which is the first operational polar-orbiting
satellite-based sensor to observe the atmosphere in Earth-scanning
mode in the 118-GHz oxygen band. Also, AMAS has more chan-
nels at 183 GHz than MWHS. This paper analyzes the channel ca-
pability and radiometric characteristics of AMAS at 118.75 GHz.
Before the launch of FY-3C, the intensive thermal vacuum (T/V)
tests for AMAS were carried out in a 2-m T/V chamber, and the                        Fig. 1. Schematic diagram of AMAS system.
basic parameters were obtained, such as the receiver nonlinearity
and sensitivity of each channel for AMAS. Furthermore, system                        for deriving the atmospheric vertical distribution of temperature
nonlinear error correction and bias correction of warm and cold
targets are derived after the T/V data analysis and will be used for                 and humidity, rainfall, etc. The chosen observation channels
calibration processing, playing an important role in level 1 and 2                   are at 89 GHz (vertical polarization), 118.75 GHz (horizontal
data processing. Accuracies of calibrated channels in AMAS range                     polarization, eight-channel), 150 GHz (vertical polarization),
from 0.48 K to 2.7 K.                                                                and 183.31 GHz (horizontal polarization, five-channel). AMAS
  Index Terms—Advanced Microwave Atmospheric Sounder                                 was designed for global atmospheric temperature and humidity
(AMAS), calibration accuracy, Feng Yun satellite, thermal vac-                       observation in all-weather conditions and for the monitoring of
uum (T/V) calibration, 118.75 GHz.                                                   severe weather systems such as typhoons and rainstorms.

                            I. I NTRODUCTION
                                                                                                II. G ENERAL D ESCRIPTION OF AMAS

F     ENG YUN 3 (FY-3) is the second-generation sun-
      synchronous satellite from China [1]. The first two satel-
lites FY-3(A/B) in its series were successfully launched on
                                                                                     A. Schematic of AMAS
                                                                                        AMAS consists of three units: antenna and receiver unit,
May 27, 2008 and November 9, 2011, respectively. The Ad-                             power supply unit, and electronic unit. The schematic diagram
vanced Microwave Atmospheric Sounder (AMAS) onboard the                              of the AMAS system is shown in Fig. 1. Compared to MWHS
FY-3(C/D) satellite was designed in the Key Laboratory of                            onboard FY-3A/B [5], it adopts two separated antennas and
Microwave Remote Sensing, Center for Space Science and                               polarizing grids to realize both polarization and multifrequency
Applied Research, Chinese Academy of Sciences [2], [3]. Data                         receivers. The antenna and receiver unit collects emission
assimilation of the Microwave Humidity Sounder (MWHS) is                             from the atmosphere. The received signal is focused to the
demonstrated to improve the analysis of numerical weather pre-                       feed horn and the first element of the high-frequency front
diction [4]. Based on sounding channels operated between 89                          end and then down-converted by a double sideband mixer to
and 191 GHz (horizontal and vertical polarizations), the AMAS                        intermediate frequency (IF). The IF signal is then detected and
will be operated in cross-track scanning mode and will be used                       integrated. The electronic unit digitizes the LF signal, controls
                                                                                     the scanning mechanism and measures the physical temperature
                                                                                     of the onboard hot target for calibration, and communicates
   Manuscript received June 19, 2013; revised November 22, 2013,                     with the satellite through a 1553B data bus. The power supply
February 20, 2014, and April 8, 2014; accepted April 11, 2014. This work was         unit performs dc/dc conversion, distributes the dc lines to the
supported in part by the U.S. Department of Commerce under Grant BS123456.
   The authors are with the Key Laboratory of Microwave Remote Sensing,              various subassemblies, and switches between the nominal and
Center for Space Science and Applied Research, Chinese Academy of Sciences,          the redundant unit. Table I lists the characteristics of AMAS
Beijing 100190, China.                                                               channels, including center frequency, polarization, bandwidth,
   Color versions of one or more of the figures in this paper are available online
at http://ieeexplore.ieee.org.                                                       N EΔT , local oscillator (LO) precision, calibration resolution,
   Digital Object Identifier 10.1109/TGRS.2014.2324173                               3-dB beamwidth, and dynamic range.
                           0196-2892 © 2014 IEEE. Personal use is permitted, but republication/redistribution requires IEEE permission.
                               See http://www.ieee.org/publications_standards/publications/rights/index.html for more information.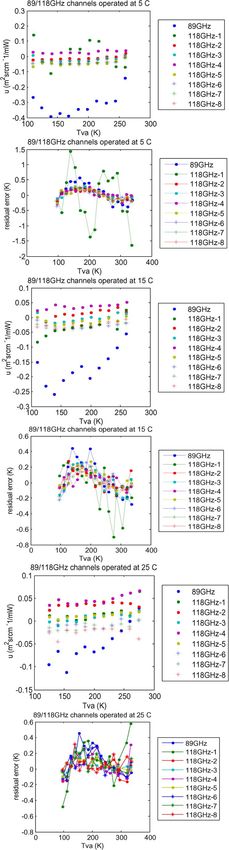
482                                                        IEEE TRANSACTIONS ON GEOSCIENCE AND REMOTE SENSING, VOL. 53, NO. 1, JANUARY 2015

                            TABLE I
          C HANNEL C HARACTERISTICS OF AMAS R ECEIVERS

                                                                           Fig. 4. Time and velocity distribution in different scanning angles in a
                                                                           calibration period.

                                                                           Fig. 5.   Structure of hot calibration target.

Fig. 2. Scanning mechanism and offset parabolic antenna.

                                                                           Fig. 6. Front end of receiver. (a) Front end of 89/118.75 GHz. (b) Front end
                                                                           of 150/183.31 GHz.

                                                                           period. For calibration, three samples are taken for warm and
                                                                           cold targets per scan. The calibration process is implemented
                                                                           by observing a built-in hot target and the background emission
                                                                           of the cold sky. Time and velocity distribution for a complete
                                                                           scan cycle is shown in Fig. 4. The hot calibration target consists
                                                                           of the microwave absorber, shown in Fig. 5. The temperature of
                                                                           the target and its shield are monitored.
                                                                              2) Receiver: The receiver consists of radio frequency (RF)
                                                                           front end, IF, and video frequency (VF) components. The
Fig. 3. Scanning mode and observing geometry of AMAS.                      RF front end consists of feed, mix frequency, LO, and low
                                                                           noise amplifier and is made by the RPG company (http://www/
                                                                           radiometer-physics.de/rpg/hml/home); the IF and VF signal
B. Key Technologies
                                                                           chain consists of the IF amplifier, filter, detector, and inte-
   1) Antenna and Scanning: Fig. 2 shows the drive mech-                   grator. The front end of 89/118.75 GHz and 150/183.31 GHz
anism and offset parabolic antenna, and Fig. 3 shows the                   is shown in Fig. 6 which is the key part of the receiver and
scanning mode and observing geometry of channels operated at               determines the channel characteristics of AMAS. The schemat-
183 and 150 GHz of AMAS. For 118 and 89 GHz, the angular                   ics of the 89/118.75-GHz receiver and 150/183.31-GHz
resolution is 2◦ . Two separated reflectors are driven by one              receiver are shown in Fig. 7. In the receivers, the polarized
motor for 15 channels, which realizes vertical and horizontal              grid is used to produce two orthogonally polarized beams with
polarizations with a polarizing grid, respectively. The scanning           the same frequency, and a dichroic plate would perform fre-
period is 2.667 s. Main beams of the antenna scan over the ob-             quency separation coverage to realize the frequency separation.
serving swath (±53.35◦ from nadir) in the cross-track direction            Then, the RF signal mixes with LO to become the IF signal,
at a constant time of 1.71 s. There are 98 pixels sampled per              through amplifying and filtering, and the signal is detected
scan during 1.71 s, and each sample has the same integration               by the detector and sent to the data processing unit, where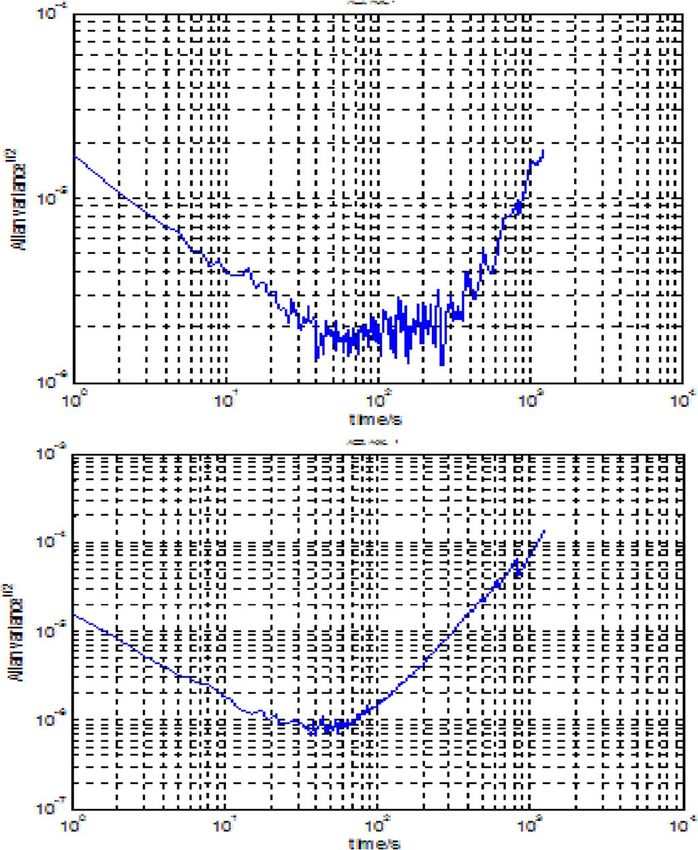
JIEYING et al.: AMAS CHANNEL SPECIFICATIONS AND T/V CALIBRATION RESULTS ON FY-3C SATELLITE                                                  483

                                                                                                        TABLE II
                                                                             C HARACTERISTICS OF N INE C HANNELS N EAR 118.75 GHz FOR AMAS

                                                                                                         TABLE III
                                                                              C HARACTERISTICS OF S IX C HANNELS N EAR 183.31 GHz FOR AMAS

Fig. 7. Schematic diagram of receiver. (a) Schematic diagram of
89/118.75-GHz receiver. (b) Schematic diagram of 150/183.31-GHz receiver.

118.75- and 183.31-GHz receivers use an IF n-way multiplexer
to realize multifrequency and multichannel simultaneously,
respectively.

  III. S ELECTION AND A NALYSIS OF AMAS C HANNELS
   On Chen and Lin’s research on atmospheric retrieval algo-
rithms at microwave frequencies [6], they have used data from
radiometers in the 50–70-GHz range, and they are interested
in the observing data from other oxygen absorbing lines. So
far, no payloads onboard polar-orbiting operational meteoro-
logical satellites have been launched which use channels near
118.75 GHz. Compared with the relatively mature technology
of 50–70 GHz, the channels operating at 118.75 GHz will be
affected by cloud contamination and with a worse vertical res-
olution, but they can avoid using large antennas and can further            Fig. 8. Atmospheric absorption coefficients at 118.75 GHz.
improve the spatial resolution [7]. Therefore, the analysis of
sounding characteristics, including the selection of frequency              of eight channels near 118.75 GHz and window frequencies
and bandwidth near 118.75 GHz, and retrieval results from                   for the new-generation MWHS. The criteria of frequency and
simulating data are necessary to design and improve microwave               bandwidth selection are based on atmospheric absorption lines
radiometers.                                                                and difference of observing brightness temperatures. A detailed
   In the selection of appropriate channels, the following points           selection of channels centered at 118.75 GHz is shown in
can be considered: 1) selecting channels with similar radiances             Fig. 8. Also, the polarization, sensitivity, and resolution of each
and weighting functions over a wide range of frequencies;                   channel are listed in both tables. All these specifications have
2) whether using double sideband measurements is appropriate                been tested and validated in simulations.
or not [8]; 3) avoiding interfering ozone lines as best as possi-              Adopting the U.S. standard atmosphere in 1976 which con-
ble; and 4) selecting the optimum bandwidth in order to achieve             tains the profiles of water vapor, nitrogen, and liquid water
low noise while keeping weighting functions narrow.                         contributions, the atmospheric temperature weighting function
   Considering the development level of hardware while                      can be calculated [9]–[11]. The weighting functions and bright-
keeping the retrieval accuracies satisfied, the authors deter-              ness temperatures in different frequencies and bandwidths near
mined the frequencies and bandwidths of the new-generation                  118.75 GHz, 183.31 GHz, and window frequencies are shown
MWHS—AMAS. Tables II and III show the characteristics                       in Fig. 9. The assumed observing angle is 0◦ , and the ground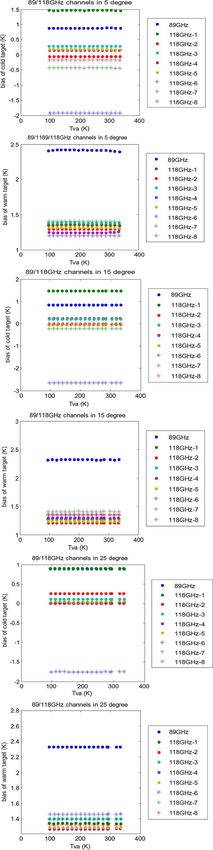
484                                                     IEEE TRANSACTIONS ON GEOSCIENCE AND REMOTE SENSING, VOL. 53, NO. 1, JANUARY 2015

                                                                           Fig. 10.   Schematic of T/V calibration data for AMAS.

                                                                                                        TABLE IV
                                                                                        C HARACTERISTICS OF VARIABLE T EMPERATURE
                                                                                           TARGET AND C OLD TARGET IN T/V T ESTS

                                                                           satellite [12]. Fig. 10 shows the schematic diagram of T/V
                                                                           calibration in a vacuum chamber. For instrument temperatures
Fig. 9. Diagram of temperature and water vapor weighting function of
the AMAS with the distribution of atmospheric pressure. (a) Midlatitude.   of 278 K, 288 K, and 298 K, the variable temperature target
(b) Tropical.                                                              was observed by both radiometers while its temperature was
                                                                           swept from 95 K to 335 K. Table IV lists the characteristics of
surface type is land, with a surface emissivity of 0.95. It                the variable temperature target in T/V tests. In every cycle, we
shows that the microwave temperature and water vapor weight-               recorded the data for more than 20 min. After the T/V tests,
ing function changes with the pressure values for the new                  the basic parameters such as receiver nonlinearity, sensitivity,
generation of 15-channel MWHS. The left one shows the                      and calibration accuracy were obtained considering data quality
temperature weighting function near 118.75 and 89 GHz, and                 control, cold and warm calibration target bias, variable tem-
the right one shows the water vapor weighting function near                perature target bias, and bandwidth correction. In this paper,
183.31 and 150 GHz.                                                        the authors mainly discuss the channels near 118 GHz which
   Different from the currently operating microwave radiometer             are to be used for the first time for satellite instruments and
MWHSs, the new-generation MWHS adopts eight channels                       will provide reference for designing other sounders in the
near 118.75 GHz which are temperature sensitive and including              future.
more cloud and water information. Also, AMAS adds two
channels near 183.31 GHz. Therefore, the weighting function                A. Quality Control of T/V Calibration Data
peaks are distributed in a more balanced manner from surface
to high altitude layers. This provides more sensitivity to the                Quality control of T/V calibration data is a key element
retrieval of atmospheric temperature and moisture.                         to ensure the AMAS calibration accuracy. It includes thermal
   Here, we use a set of radiosonde profiles from Beijing                  platinum resistance (PRT) measurements of the warm target,
(54511, 116.28E, and 39.93N) and PKMJ station (91376,                      positions and views of the cold and warm targets, the receiver
171.38E, and 7.08N) at 00Z and 12Z of 1 year (2012).                       temperature, etc. Also, the monitoring of auto gain control is
                                                                           necessary and must be stable for each channel. If any gain is
                                                                           changed, the T/V test will be restarted, and the T/V calibra-
                  IV. T/V C ALIBRATION T EST
                                                                           tion data are considered as trustless [13]. In T/V calibration
  To determine AMAS radiometric characteristics, the thermal               tests, five samples of PRTs in the warm target and seven
vacuum (T/V) tests were completed before the launch of the                 samples of PRTs in the cold target are used to calculate the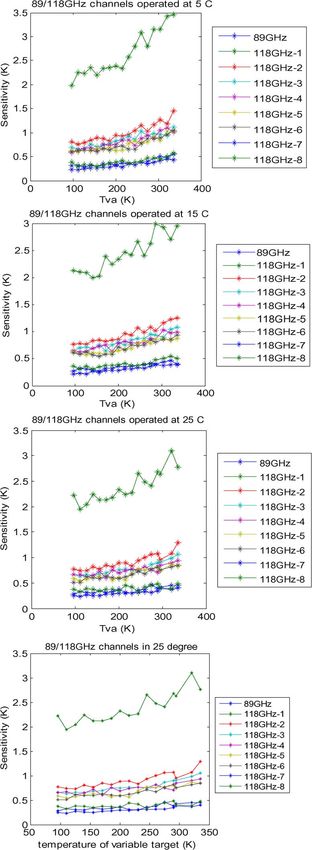
JIEYING et al.: AMAS CHANNEL SPECIFICATIONS AND T/V CALIBRATION RESULTS ON FY-3C SATELLITE 485
Fig. 12. Temperature difference between variable target and PRT
measurements.
brating values of the variable temperature target and measuring
values from PRTs, and the horizontal axis Tva denotes the
temperature of the variable temperature target. Among different
lines, the difference represents the temperature stability of the
variable temperature target.
B. Primary Analysis of Calibration Bias
The temperature of the internal warm target is measured
by five PRTs in each scan period for AMAS. For each PRT,
the counts are converted to temperatures by (1). The average
temperature of the warm target is derived through weighting
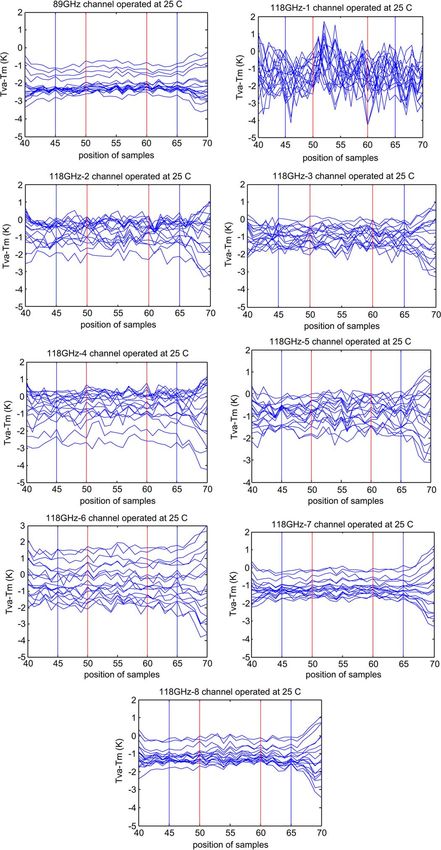
Fig. 11. Sample positions of observing variable target. Note: Red line denotes all the PRTs in each scan period by (2). Fig. 12 shows the
the chosen samples for T/V calibration for this paper; Blue line denotes the average temperature range of the warm target at 118 GHz,
stable range of samples.
where the vertical axis denotes the temperature difference be-
tween the variable target and measurements of PRTs and the
radiometric temperature, and their voltage values are coming
horizontal axis denotes the temperature of the variable target.
from the position samples of internal warm target views and
The warm target temperature shows that it reaches a thermal
space views (three times during a scan period, respectively).
equilibrium condition or dynamic heat balance, and the voltages
After the AMAS reaches thermal balance, the samples in the
are stable with the variation less than 0.1 K in the adjacent
cold or warm target should be consistent in count. Therefore, in
scanning line
data processing, each count must be checked. If the samples do
not meet the requirement, the scan data should be considered T = aV 2 + bV + c (1)
as failing data. For variable temperature target setting in the
position of Earth observation, the samples should be consistent where V denotes the voltage with the unit of volts and given
near the center. In these T/V data, considering the data stability by PRT measurements. Coefficients a, b, and c are shown in
and actual scanning position, the authors use samples numbered Table V, which are the second-, first-, and constant terms of
50–60 for channels near 118 GHz, as shown in Fig. 11. The polynomial of temperature conversion and are regressed by
vertical axis denotes the temperature difference between cali- testing and experiments in different temperatures.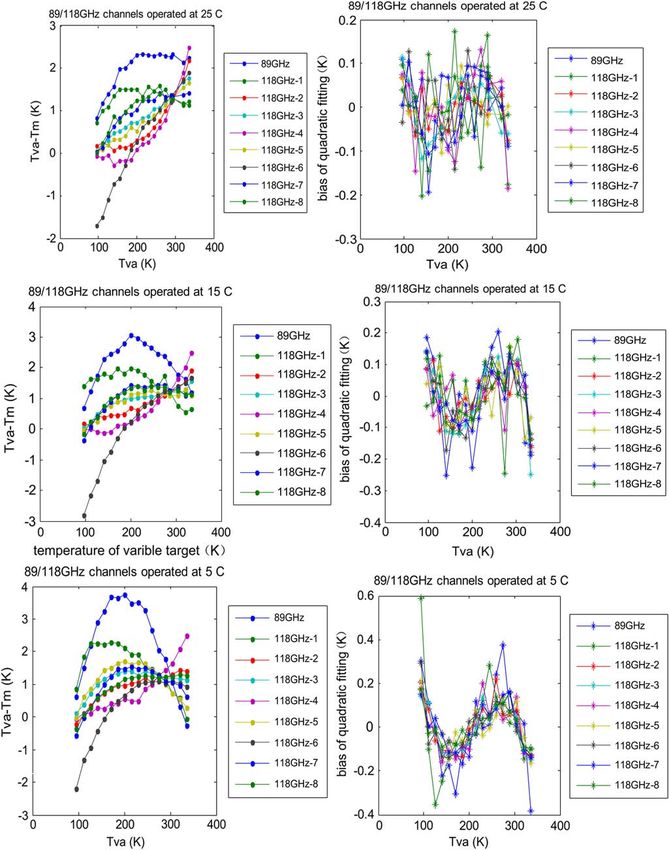
486                                                IEEE TRANSACTIONS ON GEOSCIENCE AND REMOTE SENSING, VOL. 53, NO. 1, JANUARY 2015

                            TABLE V
  PRTS’ C ALIBRATION C OEFFICIENTS OF T EMPERATURE C ONVERSION

                                                                    Fig. 13. Quadratic curve contribution of calibration bias by subtracting the
                                                                    third term.

                                                                                               TABLE VI
  The average temperature of the internal warm target in a scan        C ORRECTION C OEFFICIENTS OF VARIABLE T EMPERATURE TARGET
can be expressed as

                           m
                               wij Tij
                           j=1
                  Tb,i =
                             m           + ΔTw               (2)
                                  wij
                            j=1

where Tb,i is for the average temperature of the internal warm
target in a scan and wij is for the weighting coefficient. In the
T/V data processing of AMAS, m = 5 is the number of PRTs
after the quality control, and wij = 1 for all the valid PRTs.
Each of the PRTs is noted as Tij . If the temperature difference
of the PRTs is over 0.1 K, the data are considered abnormal and
are not used in the temperature average. Because of that, m is
equal or less than 5. If the temperature difference between the
current scan Tb,i and previous scan Tb,i−1 is over 0.1 K, Tb,i
is also considered abnormal, and Tb,i−1 is used for the warm
target mean temperature of the current scan. Fig. 12 shows
the primary analysis of calibration bias, where the correction      Fig. 14.   Compensation curve of variable temperature target.
factor ΔTw for the internal target temperature is considered as
0. In order to reduce the calibration bias, Section IV-C shows
the correction values based on the thermal T/V calibration data     nonlinearity part is assumed as the contribution of the variable
analysis.                                                           temperature target; 2) in the T/V calibration test, we set the
                                                                    temperature of the variable target equal to that of the cold target
                                                                    and warm target, and the bias is less than 1 K. Then, according
C. Variable Temperature Target Bias Correction                      to the bias (−4 K to 1 K), the correction coefficients v2, v3,
  The bias correction of the variable temperature target can be     and v4 of the variable target are obtained by quadratic fitting
considered as a third-order polynomial. The correction can be       method using these data and subtracting the contribution of
expressed as                                                        the third term. The correction coefficients v2, v3, and v4 of
                                                                    the variable target are processed as Fig. 13, and the results
             ΔTvar = v1 T 3 + v2 T 2 + v3 T + v4             (3)    are listed in Table VI. Finally, considering the contribution of
                                                                    v1, v2, v3, and v4, the compensation of the variable target
where v1 is the third-order coefficient, determined by the cubic    is shown in Fig. 14, where the range of correction values is
fitting coefficients of the primary bias in Section IV-B. Then,     0.2 K–1.8 K.
the third-order coefficient is calculated by means of all the
third-order coefficients for channels near 118 GHz. The other
                                                                    D. Warm and Cold Calibration Target Bias
coefficients v2, v3, and v4 can be calculated as follows: 1) As
the temperature of the variable target equals to that of the cold      Here, we assumed that no error exists for the variable tem-
target and warm target, assume that the receiver is in linear       perature target. In a given and stable temperature environment,
response well without nonlinearity effects and the bias of the      the nonlinearity of the system does not vary and is not affected
cold target and the warm target temperature is small enough         by other elements. Using the temperature bias between actual
compared to the bias of the variable temperature target, so the     and measurement values, the nonlinearity curve can be given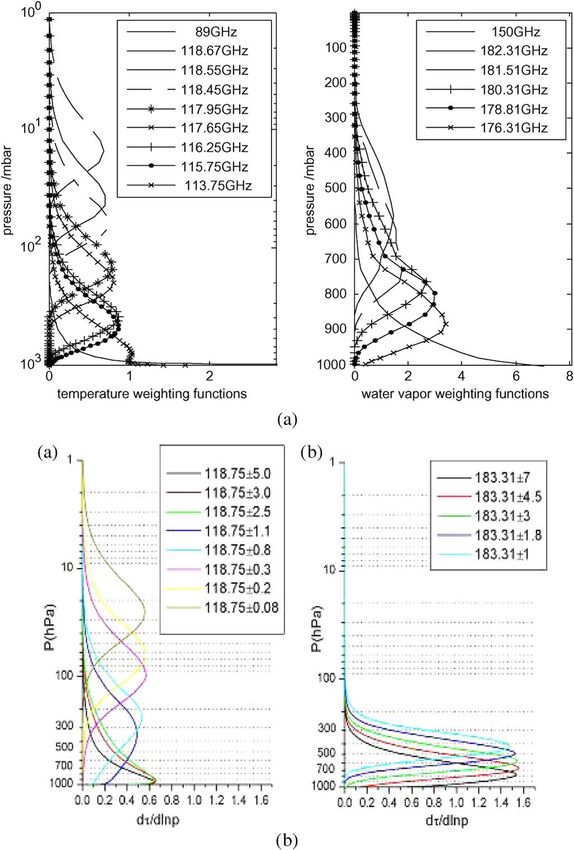
JIEYING et al.: AMAS CHANNEL SPECIFICATIONS AND T/V CALIBRATION RESULTS ON FY-3C SATELLITE                                             487

with quadratic fitting, and then, the warm and cold calibration
target bias can be derived.
   System nonlinearity Q can be derived as

              Q = u(CA − CH )(CA − CC )/G2 .                   (4)

For a given temperature, u is constant. When the observing
temperature values are near the cold and warm targets, the
system nonlinearity will be considered as 0. If the nonlinearity
is not equal to 0, the bias can be affected by the temperature
uncertainty of the cold and warm targets. Fig. 13 shows the
cold and the warm target bias in the range of the variable
temperature at about 278 K, 288 K, and 298 K. From Fig. 15,
it can be seen that the cold and the warm target bias are
not affected by the variable temperature target and cannot be
neglected. Table VII includes the cold and the warm target
bias at different instrument temperatures (which vary with the
temperature of the variable temperature target), where the bias
is the measurement temperature of the cold target minus the
calibrating values of the variable temperature target.
   The calibration bias mainly comes from the surface gra-
dients of the calibration target, and the gradients depend on
the temperature difference between the calibration target and
background. The emissivity of the calibration blackbody is
better than 0.999, and the maximum of the testing error is 0.001.
The scene temperature is smaller than 100 K, so the uncertainty
of the scene is less than 0.1 K. Table V lists the bias values, and
it can be seen that the warm target bias is relevant with the IF
temperature and in relation with the direct ratio, while as the
IF temperature becomes larger gradually, the cold target bias is
changed as the inverse ratio changes. Because the background
is nearly at 100 K and the cold target temperature is 95 K, the
cold target bias is small and consistent as the temperature of the
variable temperature target changes.

E. Bandwidth Correction
   Due to the obvious difference between the actual band and
calculating band of the channels operated at 118.75 GHz for
AMAS and due to the fact that the bands are too broad to meet
the criterion of monochromatic light, the band correction is of
importance and directly affects the calibration accuracy. First,
we integrated the radiation in the actual passband of AMAS and
the ideal rectangle passband, respectively. Then, the correction
method is realized by using a linear fitting between these two
values, as shown in (5). Finally, we obtained the exchanging
coefficients b0 and b1

                         T m = b0 + b 1 T                      (5)

where T denotes the temperature of the blackbody. Tm is the
temperature after band correction. The band-correction results
are shown in Tables VIII and IX. The relation between radiance
and physical temperature of the blackbody can be expressed as

                             2hv 5    1
               Rw (ch) = e           hv     .                (6)    Fig. 15. Bias of warm and cold targets at 89/118-GHz channels in the
                              c3 exp kT    −1                         condition of 5/15/25 ◦ C.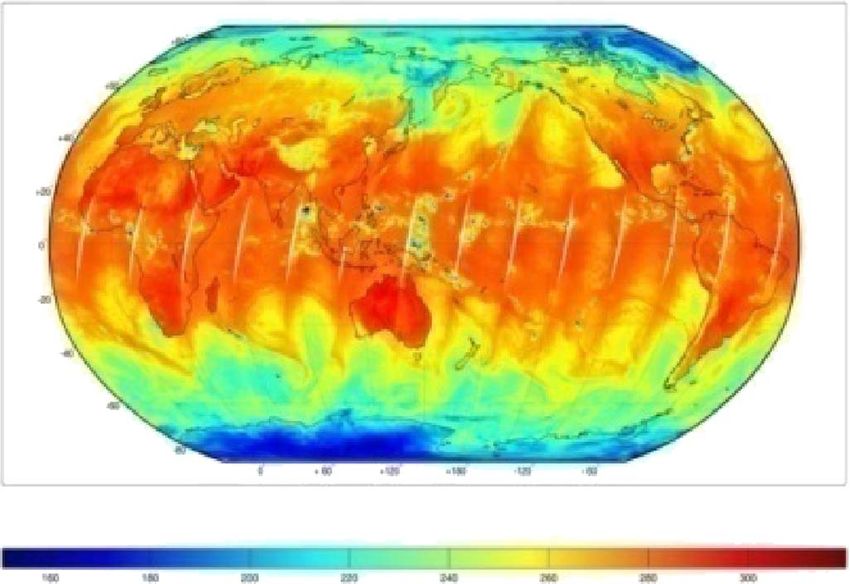
488                                                 IEEE TRANSACTIONS ON GEOSCIENCE AND REMOTE SENSING, VOL. 53, NO. 1, JANUARY 2015

                            TABLE VII                                                         TABLE VIII
 (a) B IAS OF WARM AND C OLD TARGETS AT 89/118-GHz C HANNELS IN               BAND C ORRECTION OF C HANNELS N EAR 118.75 GHz
THE C ONDITION OF 5/15/25 ◦ C. (b) B IAS OF WARM AND C OLD TARGETS
     AT 150/183-GHz C HANNELS IN THE C ONDITION OF 5/15/25 ◦ C

                                                                                               TABLE IX
                                                                        M EAN AND S TANDARD E RROR OF U FOR 89/118-GHz C HANNELS

                                                                     where RA denotes the radiance value, CA denotes the voltage
                                                                     value, and a0 , a1 , a2 are the calibration coefficients which can
                                                                     be derived according to the measurements of cold cosmic space
                                                                     and built-in blackbody and considering the contribution of the
                                                                     nonlinearity term, bias correction, and band correction

                                                                                   a0 = RH − CH /G + uCH CC /G2                    (8)
                                                                                   a1 = 1/G − u(CH + CC )/G       2
                                                                                                                                   (9)
                V. S YSTEM S PECIFICATIONS
                                                                                   a2 = u/G2 .                                    (10)
A. Nonlinearity Correction and Residual Error
                                                                     Here, the nonlinear factor u can be expressed as
   According to the calibration data and characteristic of
AMAS, the calibration equation on orbit can be determined as                         G = (CH − CC )/(RH − RC ).                   (11)
follows:
                                                                     RH and RC are the radiation temperatures of the warm and cold
                                          2
                RA (C) = a0 + a1 CA + a2 CA                    (7)   targets, CH and CC are the measuring voltages of the warm and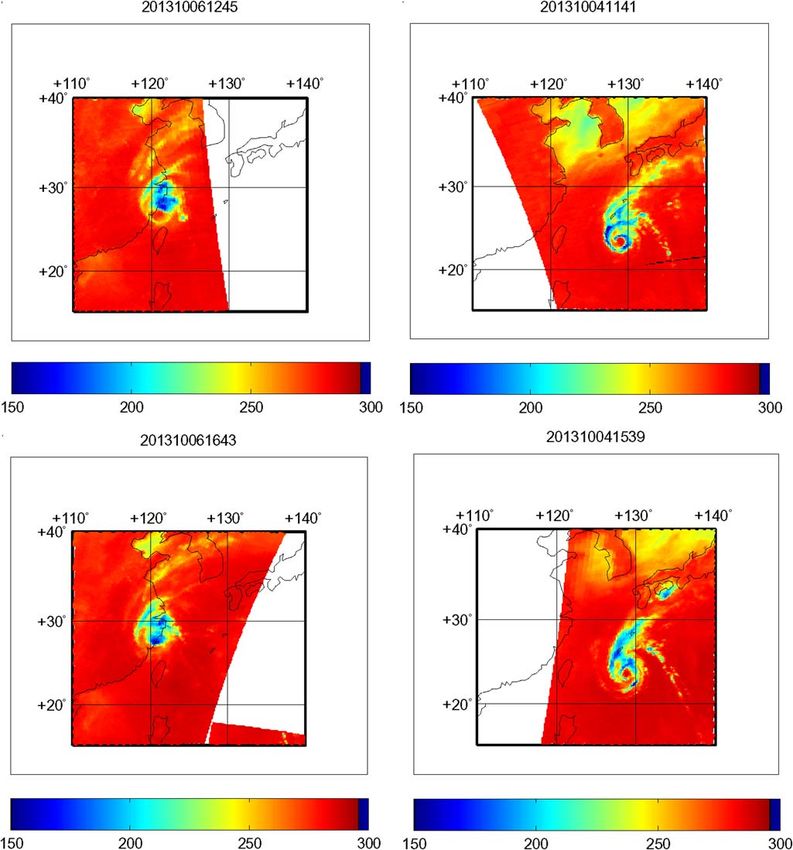
JIEYING et al.: AMAS CHANNEL SPECIFICATIONS AND T/V CALIBRATION RESULTS ON FY-3C SATELLITE                                                       489

cold targets, and G is the system gain. Q is the nonlinear term
and can also be expressed as the difference between measuring
radiation Rr calculated by two-point calibration procession and
actual radiation Rm obtained from PRTs

                           Q = Rr − Rm .                        (12)

Therefore, the values of u can be derived from the above
equations for all channels near 118 GHz. Fig. 16 shows the
values of u in different channels with different environment
temperatures and residual errors of calibration with different
instrument temperature values, with the variable temperature
from 110 K to 260 K. In Fig. 16, the horizontal axis denotes the
temperature of the variable target, and the vertical axis denotes
the nonlinear factor u for all left panels and residual error for
all right panels.

B. Linearity of Channels for AMAS at 89/118 GHz
   The linearity coefficient R can be used to express the linearity
of the system
                     N

                              i
                            Vout − V out (Ti − T )
                     i=1
           R=                                                  (13)
                    N
                                           2
                                               N
                             i
                           Vout   − V out          (Ti − T )2
                   i=1                       i=1

where N is the observing number and T and V out denote the
mean of T and the mean of Vout , respectively. By setting the
temperature of the variable target at the range of 95 K–335 K
with an increase of 15 K, the linearity of each channel can be
calculated as Table X shows.
   Since the linearity coefficient is not 1, the nonlinear term in
calibration calculation cannot be neglected. After the correction
of the cold and warm targets, i.e., nonlinear correction, the error
caused by nonlinear uncertainty is calculated using T/V data
and included in Table XI, where the influence of random noise
has been eliminated.

C. F Sensitivity of Channels for AMAS at 89/118 GHz
  The sensitivity of the receiver (N EΔT ) is the smallest
measurable change in scene temperature. It is a function of
system noise and affected by electronic components, system
gain, and calibration data

         N EΔT = ST D(PP RT,i − RAM AS,i )i=1:N                 (14)

where RP RT,i is the radiance according to the measurements of
PRTs and RAM AS,i is the calibrated radiance of each channel
for AMAS. N is the number of scanning lines to calculate the
sensitivity, and in this paper, N = 40. The sensitivity is related
to the integral time, bandwidth, and stability of the system gain.
Fig. 17 shows the variable target observing the sensitivity of
the channels near 89/118 GHz. For the smallest bandwidth of
20 MHz, the sensitivity of 118 GHz-1 is worse than that of other
channels and varied larger gradually with the temperature of the       Fig. 16. Values of nonlinearity factor u in different environment temperatures
variable target.                                                       at 89/118 GHz.
490                                           IEEE TRANSACTIONS ON GEOSCIENCE AND REMOTE SENSING, VOL. 53, NO. 1, JANUARY 2015

                         TABLE X
      L INEARITY OF C HANNELS FOR AMAS AT 89/118 GHz

                        TABLE XI
        E RROR C AUSED BY N ONLINEAR U NCERTAINTY

                                                              Fig. 17. Sensitivity of AMAS observing variable target for different channels.

                                                                For the T/V tests, the count number of 400 is considered
                                                              valid and without noise signal influence, but not for 118 GHz-1.
                                                              Fig. 15 shows that, for the 118 GHz-1 channel, it is also affected
                                                              by system noise and has not been stable among 400 counts.
                                                              System stability can be demonstrated by the Allan variance and
                                                              expressed as

                                                                             2
                                                                            σA (k) = E [Ri (k) − Ri+1 (k)]2

                                                              where Ri (k) = E{Xi...i+k } and Ri+1 (k) = E{Xi+k+1...i+2k }
                                                              is the mean of samples with the number of 0 to k, with i =
                                                              1 . . . ns /k. ns is the total number of test samples, and σA
                                                                                                                            2
                                                                                                                              is
                                                              the Allan variance.
JIEYING et al.: AMAS CHANNEL SPECIFICATIONS AND T/V CALIBRATION RESULTS ON FY-3C SATELLITE 491
TABLE XII
P RIMARY C ALIBRATION R ESULTS OF AMAS
where ΔTW is the uncertainty of the blackbody as warm
target, ΔTC is uncertainty of the blackbody as cold target,
ΔTNL is the uncertainty of the nonlinear term, ΔTSYS is the
uncertainty of system random noise temperature TSYS which
can be expressed as TSYS = T0 + TR, and TR = (F − 1)T0.
F is the noise factor of the receiver. TS is the radiation of the scene
X = (TS − TC )/(TW − TC ). (16)
According to the bias calculations and error corrections about
the cold and warm targets, variable target, nonlinearity error,
and system random noise, the primary calibration results can
be derived in Table XII, which meet the requirements of design
Fig. 18. Allan variances for all channels near 118.75 GHz.
and development of AMAS onboard the FY-C satellite. To
For channels operated at 118 GHz of AMAS, the integral demonstrate that system requirements are appropriate and can
time is 10 ms, and the sample cycle is 2.667 s, so the au- be met, in Section VI, this paper provides the analysis of
thors choose 400 counts (about 17 min) to calculate the Allan brightness temperatures through calibration process and profile
variance. Fig. 18 shows the Allan variance for channels near retrievals using the observing data of AMAS.
118 GHz-1 and 118 GHz-2, and the optical integral time is
250 and 30 s. VI. A NALYSIS OF B RIGHTNESS T EMPERATURE OF AMAS
From the Allan variance, it can be seen that the 118 GHz-
The AMAS was launched on September 23, 2013 and be-
1 channel needs more digital statistical time to filter the noise
came operational on September 30, 2013. This is the first time
influence. Therefore, all the results in this paper for channel
that a 118-GHz sounder has been deployed on an international
118 GHz-1 is worse than ideal specifications which is a short-
polar-orbit meteorological satellite. Now, the instrument has
coming for these T/V calibration tests, but for other channels,
collected much data in all weather and all day, particularly
the counts of 17 min are enough to do the T/V calibration work.
in extreme climate. Fig. 19 shows the brightness temperature
The comments below Fig. 18 state that 118 GHz-1 needs
sounding by MWHS onboard FY-3A/B. Fig. 20 shows the
more integration time than other channels to compensate for
sounding results by AMAS onboard FY-3C. Fig. 21 shows the
the impact of gain variations. The plots show a minimum Allan
global distribution of brightness temperature for FY-3C AMAS.
time, after which variance increases. For 1/f noise, the plot
Using the processing data from AMAS shows that the instru-
would not rise after the minimum. These data indicates that
ment plays an important role in monitoring extreme climate,
the noise must be more like 1/f2 in nature, and increasing the
particularly for typhoon “Fitow,” including its evolution growth
integration time will not reduce the noise.
and weakening, and is very helpful in the work of numerical
weather forecasting and real-time data. Because the data from
D. Calibration Accuracy of Channels for AMAS at AMAS are limited, the conclusion of retrieving resolution
89/118 GHz may be not typical. More work needs to be done for AMAS,
The calibration accuracy consists of contributions distributed including comparisons with AMSU-A and AMSU-B onboard
in four parts: the uncertainty of the cold target, warm target, the NOAA series which will be done in the near future.
nonlinear term, and random noise of the receiver. Equation (15)
shows the expression of calibration accuracy VII. C ONCLUSION
ΔTCAL = [XΔTW ]2 + [(1 − X)ΔTC ]2 The MWHS is one of the primary payloads onboard the
1/2 polar-orbiting meteorological satellite FY-3A/B and is mainly
2
+ 4(X − X 2 )ΔTN L + [ΔTSY S ]2 (15) used to sound atmospheric humidity profiles and monitor492 IEEE TRANSACTIONS ON GEOSCIENCE AND REMOTE SENSING, VOL. 53, NO. 1, JANUARY 2015
tropical cyclones, typhoons, and rainfall rates. Currently, the
main microwave temperature sounders onboard the polar-
orbiting meteorological satellite use channels in the 50–70-GHz
oxygen absorption band to sound atmospheric temperature
profiles, while operational temperature sounding using the
118.75-GHz oxygen band is still in the development stage.
This paper discusses the AMAS channel characteristics and
analyzes eight oxygen channels near 118.75 GHz as well as
window channels at 89 GHz for surface information, utilized
onboard the FY-3C. Descriptions of the weighting function
for each channel were provided. In contrast to the currently
operated MWHS and AMSU-B, the weighting functions of
AMAS described in this paper distribute more broadly and
comprehensively, so they are potentially more accurate in de-
tecting the atmospheric temperature and humidity profiles from
surface to high altitude. Specifics of the prelaunch ground T/V
calibration testing, whose purpose is to test the system response
characteristics and set up the quantitative relations between in-
put parameters and AMAS outputs in a T/V chamber condition,
were presented. The main content includes performance test-
ing before vacuum calibration, vacuum calibration experiment,
calibration error analysis, and determining the prime technical
specification in different environment temperatures such as
Fig. 19. Typhoon “Fitow” sounding by FY-3A/B MWHS. AMAS nonlinearity correction coefficients and will be demon-
strated by the on-orbit calibration. By the T/V tests and data
processing and analysis, the AMAS nonlinearity parameters
are obtained, and nonlinear error correction as a consideration
is redefined through on-orbit calibration. Therefore, this paper
will play an important role in the design and development of
following meteorological satellites.
ACKNOWLEDGMENT
The authors would like to thank the anonymous reviewers
for their helpful comments and suggestions. The authors would
also like to thank the No. 509 Institute of the Shanghai
Academy of Space Flight Technology for providing the T/V
calibration testing environment.
Fig. 20. Typhoon “Fitow” sounding by FY-3C AMAS. R EFERENCES
[1] C. Dong et al., “An overview of a new Chinese weather satellite FY-3A,”
Bull. Amer. Meteorol. Soc., vol. 90, no. 10, pp. 1531–1544, Oct. 2009.
[2] S. W. Zhang et al., “Microwave humidity sounder (MWHS) of Chinese
meteorological satellite FY-3,” presented at the Proc. Microwave Technol-
ogy Techniques Workshop-Enabling Future Space Systems, Noordwijk,
The Netherlands, May 15–16, 2006, ESA SP-632.
[3] S. W. Zhang, J. Li, and Z. Z. Wang, “Design of the second generation
microwave humidity sounder (MWHS-II) for Chinese meteorological
satellite FY-3,” in Proc. IEEE IGARSS, Munich, Germany, Jul. 22–27,
2012, pp. 4672–4675.
[4] Q. Lu, W. Bell, P. Bauer, N. Bormann, and C. Peubey, “An evaluation of
FY-3A satellite data for numerical weather prediction,” Q. J. R. Meteorol.
Soc, vol. 137, no. 658, pp. 1298–1311, Jul. 2011.
[5] J. Li, S. W. Zhang, J. S. Jiang, and X. L. Dong, “In-orbit perfor-
mance of Microwave Humidity Sounder (MWHS) of the Chinese FY-3
meteorological satellite,” in Proc. IEEE IGARRS, Honolulu, HI, USA,
Jul. 25–30, 2010, pp. 574–577.
[6] H. B. Chen and L. F. Lin, “Numerical simulation of temperature pro-
file retrievals from the brightness temperatures in 6 channels near
118.75 GHz,” Atmos. Sci., vol. 27, no. 6, pp. 894–900, 2003.
[7] Z. G. Yao and H. B. Chen, “Retrieval of atmospheric temperature profiles
with neural network inversion of microwave radiometer data in 6 channels
Fig. 21. Global distribution of brightness temperature for FY-3C AMAS. near 118.75 GHz,” Meteorol. Sci., vol. 26, no. 3, pp. 252–259, 2006.JIEYING et al.: AMAS CHANNEL SPECIFICATIONS AND T/V CALIBRATION RESULTS ON FY-3C SATELLITE 493
[8] X. B. Wu, C. L. Qi, and L. Hui, “FY-3 Satellite Ground Application Zhang Shengwei was born in Shandong in 1963. He
System Engineering R & D Technical Report,” Nat. Satellite Meteorol. received the M.S. degree in the field of electronic
Center, Beijing, China, 2007. engineering from the Chinese Academy of Sciences,
[9] P. W. Rosenkranz, Atmospheric Remote Sensing by Microwave Radiome- Changchun Institute of Geography, Changchun,
try, J. Ma, Ed. New York, NY, USA: Wiley, 1993, ch. 2. China, in 1991 and the M.S degree in Jilin Univer-
[10] P. W. Rosenkranz and C. D. Barnet, “Microwave radiative transfer sity, Changchun, in 1985.
model validation and computer science,” Massachusetts Inst. Technol., From 2001 to 2014, he was a Researcher with
Cambridge, MA, USA, 2004. the Center for Space Science and Applied Research,
[11] H. J. Liebe, “MPM—An atmospheric millimeter-wave propagation Chinese Academy of Science, Beijing, China. He
model,” Int. J. Infrared Millimeter Waves, vol. 10, no. 6, pp. 631–650, hosted and participated in more than ten major
Jun. 1989. national research projects. He engaged in passive
[12] S. Y. Gu, Y. Guo, Z. Z. Wang, and N. Lu, “Calibration analysis for sound- microwave remote sensing technology and applied research work, including
ing channels of MWHS onboard FY-3A,” IEEE Trans. Geosci. Remote foundations and airborne and spaceborne microwave radiometer system design
Sens., vol. 50, no. 12, pp. 4885–4891, Dec. 2012. and development. At present, his main research areas are spaceborne mi-
[13] J. Y. He et al., “Analysis of the system linearity caused by gain variation crowave radiometer and applied research atmosphere interferometric synthetic
of satellite-borne microwave radiometer,” J. Space Sci., vol. 32, no. 3, aperture imaging detection of passive microwave remote sensing technology
pp. 449–454, 2012. and its applications. His research interests include the mechanism of passive mi-
crowave remote sensing detection and imaging studies, new microwave remote
sensing system design and development, microwave radiometric calibration,
and algorithm simulation.
Wang Zhenzhan was born in December 1969. He
He Jieying received the B.S. degree in computer received the Ph.D. degree in computer science and
science and applied research from Xidian University, applied research from the Chinese Academy of Sci-
Xi’an, China, in 2007 and the M.S. degree in com- ence, Beijing, China, in 2005.
puter science and applied research from the Chinese From 2005 to 2014, he was a Researcher with
Academy of Science, Beijing, China, in 2012. She the Center for Space Science and Applied Research,
is currently working toward the Ph.D. degree in the Chinese Academy of Science. He hosted and par-
Center for Space Science and Applied Research, ticipated in more than ten major national research
Chinese Academy of Science. projects: He participated in the “Shenzhou” on the
From 2012 to 2014, she was a Research Assistant 4th, the “Shenzhou” on the 3rd, the situation on
with the Center for Space Science and Applied Re- the 3rd, and the Chang E One satellite and other
search, Chinese Academy of Science. Her research satellite microwave and optical remote sensor calibration/inspection and
interest includes the development of atmospheric temperature and humidity applied research tasks. He principally engaged in the research of new tech-
retrievals based on the FY-3 satellite (A/B) and ground-based microwave ra- nologies and applications of microwave remote sensing technology, includ-
diometer; atmospheric temperature and humidity retrievals on extreme climate; ing polarimetric microwave radiometry technology research, applied research
atmospheric radiative transfer model; microwave radiometer calibration and inversion, microwave remote sensor calibration parameters of the marine
analysis; and submillimeter wave channel selection for the polar-orbiting and atmosphere/inspection technology research, and terahertz detection mechanism
geostationary microwave radiometer. of atmospheric research.You can also read