Feasibility Analysis: Using Artificial Intelligence to Match Photographed Lateral Ridges of Gray Whales - OCS Study BOEM 2021-059
←
→
Page content transcription
If your browser does not render page correctly, please read the page content below
OCS Study
                                    BOEM 2021-059

Feasibility Analysis: Using Artificial
Intelligence to Match Photographed
Lateral Ridges of Gray Whales

U.S. Department of the Interior
Bureau of Ocean Energy Management
Pacific OCS Region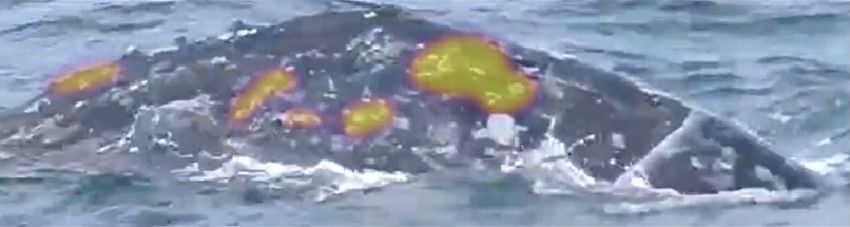
OCS Study
                                        BOEM 2021-059

Feasibility Analysis: Using Artificial
Intelligence to Match Photographed
Lateral Ridges of Gray Whales

August 2021

Authors:
Jason A. Holmberg
Jason R. Parham
Andrew Blount

Prepared under Contract 140M0120P0023
By
Wild Me
1726 N Terry Street
Portland, OR 97217

U.S. Department of the Interior
Bureau of Ocean Energy Management
Pacific OCS Region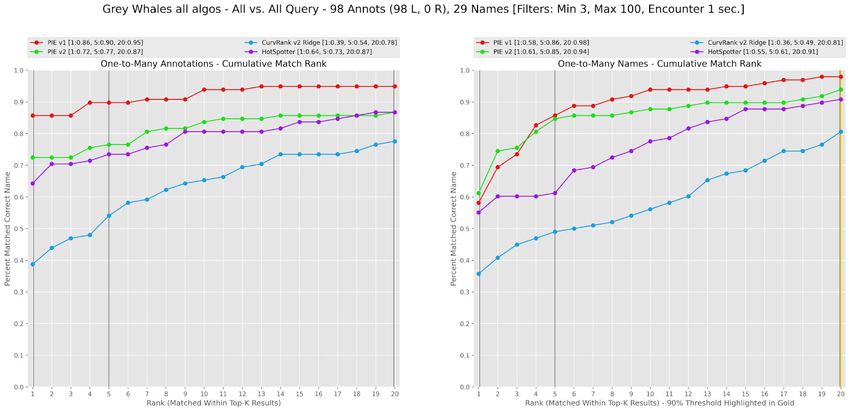
DISCLAIMER
Study concept, oversight, and funding were provided by the U.S. Department of the Interior, Bureau of
Ocean Energy Management (BOEM), Pacific OCS Region, Camarillo, CA, under Contract Number
140M0120P0023. This report has been technically reviewed by BOEM, and it has been approved for
publication. The views and conclusions contained in this document are those of the authors and should
not be interpreted as representing the opinions or policies of BOEM, nor does mention of trade names or
commercial products constitute endorsement or recommendation for use.

                                   REPORT AVAILABILITY
To download a PDF file of this report, go to the U.S. Department of the Interior, Bureau of Ocean Energy
Management Recently Completed Environmental & Technical Studies – Pacific webpage
(https://www.boem.gov/Pacific-Completed-Studies/), and click on the link for 2021-059.

                                             CITATION
Holmberg JA, Parham JR, Blount A. 2021. Feasibility Analysis: Using Artificial Intelligence to Match
   Photographed Lateral Ridges of Gray Whales. Camarillo (CA): US Department of the Interior,
   Bureau of Ocean Energy Management, Pacific OCS Region. OCS Study BOEM 2021-059. 29 p.

                                     ABOUT THE COVER
Cover photos display example visualizations of corresponding texture patterns in lateral photographs of a
previously matched gray whale resighted several years later.

                                    ACKNOWLEDGMENTS

This report acknowledges additional support from the National Oceanic and Atmospheric
Administration’s National Marine Fisheries Service, Southwest Fisheries Science Center under Contract
Number 1305M320PNFFR0479.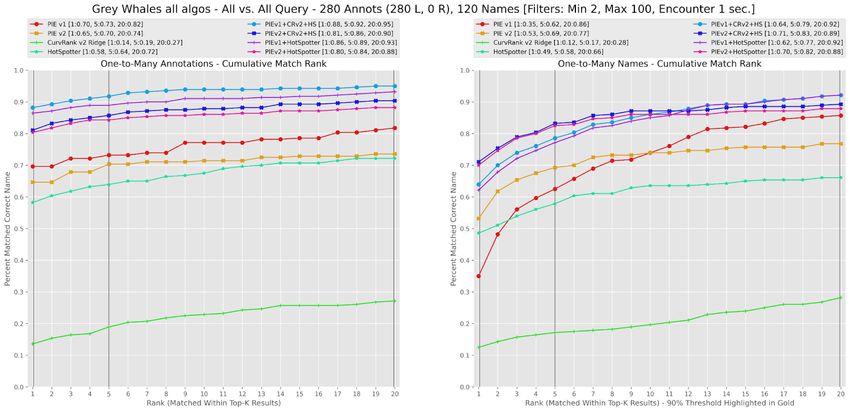
Contents
List of Figures ................................................................................................................................................ ii

List of Tables ................................................................................................................................................. ii

List of Abbreviations and Acronyms.............................................................................................................. ii

1      Executive Summary .............................................................................................................................. 1

    1.1        Completed Task Summary Table.................................................................................................. 1

    1.2        CurvRank v2, PIE, and Combined Performance Results ............................................................. 3

       1.2.1          Adding CurvRank v2 ............................................................................................................. 3

       1.2.2          Evaluating PIE v2 .................................................................................................................. 4

       1.2.3          Standardized Performance Review Across Algorithms......................................................... 5

       1.2.4          Recommended Algorithm Deployment in Flukebook.org ...................................................... 6

    1.3        Opportunities for Further Development ......................................................................................... 7

       1.3.1          Improving CurvRank v2 ......................................................................................................... 7

       1.3.2          Surveying time delta impacts on matchability ....................................................................... 7

2      References ............................................................................................................................................ 7

Appendix A: AI for Gray Whales Q1 2021 Progress Report ......................................................................... 9

Appendix B: Gray Whale Pose Invariant Embeddings (PIE v1) Results .................................................... 11

Appendix C: AI for Gray Whales Q4 Progress Report ................................................................................ 19

                                                                                 i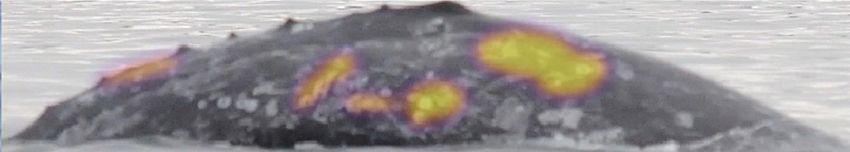
List of Figures
Figure 1.      An automatically-extracted curve from our gray whale model .................................................... 4

Figure 2.      CurvRank v2 top-N ID matching performance ............................................................................ 4

Figure 3.      Combined top-N accuracy for all evaluated ID algorithms ......................................................... 5

Figure 4.      Top-n accuracy for all ID matching algorithms evaluated as well as their combined
               performance ................................................................................................................................ 6

Figure A1. PIE vs. HotSpotter initial evaluation.......................................................................................... 10

Figure B1. Match rank vs. time between sightings ..................................................................................... 13

Figure B2. Visual review of patterning changes with time .......................................................................... 15

Figure B3. An example match result in Flukebook ..................................................................................... 17

Figure C1. Machine learning detector performance visualization .............................................................. 22

List of Tables
Table 1. Completed Tasks Summary ............................................................................................................ 1

List of Abbreviations and Acronyms

AI                    Artificial intelligence
BOEM                  Bureau of Ocean Energy Management
ML                    Machine learning
PIE                   Pose Invariant Embeddings

                                                                            ii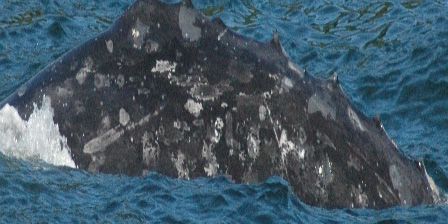
1 Executive Summary
Wild Me (wildme.org) completed all tasks for BOEM Award 140M0120P0023 and NOAA Award
1305M320PNFFR0479 (collectively the “AI for Gray Whales” project) and is submitting this final report
to complete the project. Wild Me evaluated four distinct computer vision approaches to reliably reidentify
gray whales (Eschrichtius robustus) from lateral photos.

Among the evaluated techniques, the HotSpotter and PIE algorithms provided the most overall matching
power with an additive performance of top-1 rank of 70% and top-12 of 92%, depending on their chosen
configuration and the selection of test data. All developed and tested machine learning models and ID
algorithms evaluated under these awards are now available in Flukebook.org for evaluation and use.

1.1 Completed Task Summary Table
The following tasks were completed under both awards, summarized as “NOAA”
(1305M320PNFFR0479) and “BOEM” (140M0120P0023).
Table 1. Completed Tasks Summary

            Task                 Computer                          Status                         Award
                                  Vision
                                Techniques

 Import 2000-3000 NOAA-                         COMPLETE:                                         NOAA
 provided gray whale photos                     Wild Me imported over 2100 of the most
 for annotation and labeling                    diverse photos available (from multiple
 in the IBEIS interface.                        contributors, multiple lighting and sea state
 Diversity in data is most                      conditions, etc.) of gray whale lateral photos.
 important here.

 Annotation lateral photos of                   COMPLETE:                                         NOAA
 gray whales for bounding                       Wild Me drew bounding boxes around
 box and viewpoint                              imported photos. Example video used for
                                                annotation:
                                                https://youtu.be/rS5lmQKjceE

                                                2085 images were annotated from across
                                                the data sets provided. 2182 annotations
                                                (bounding boxes) were made, representing
                                                some photos with >1 whale.

                                                    1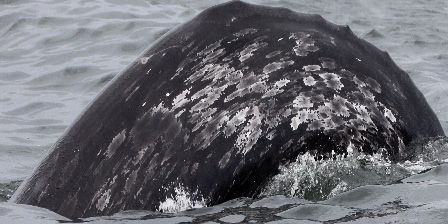
Task                 Computer                         Status                        Award
                                  Vision
                                Techniques

Detection model training        Deep           COMPLETE:                                        NOAA
                                Learning       Wild Me created a deep learning model that
                                [A, B]         allowed future photos to be curated without
                                               human intervention (finding the animal in the
                                               image, removing background pixels,
                                               predicting viewpoint). This model is the
                                               precursor to second-stage individual ID with
                                               algorithms and machine learning. Examples
                                               of detector output have been zipped up
                                               here:
                                               https://drive.google.com/file/d/18ElLvknV3v7
                                               9JcxxffAz8y7En1bUP7zJ/view?usp=sharing

                                               Detector model performance results are
                                               summarized below in the “AI for Gray
                                               Whales Q4 Progress Report”.

Data blending of legacy                        COMPLETE:                                        NOAA
data, linking at least photos                  Wild Me blended legacy data sets for gray
to IDs                                         whales into the Wildbook standard import
                                               format.

Import blended data into                       COMPLETE:                                        NOAA
Flukebook.org                                  Blended historical data was imported into
                                               Flukebook.org where it is secured for private
                                               access and wherein matching algorithms
                                               can be run.

Run detection machine           Deep           COMPLETE:                                        NOAA
learning model on imported      Learning [A]   The machine learning model created above
Flukebook data, creating                       was run on the historical data to create
annotations with associated                    “Annotations”, which denote animals in
IDs for matching                               images with labeled viewpoints and
comparison                                     assigned IDs. Annotations are the units of
                                               matching in Wildbook and Flukebook.

                                               In conjunction with Cascadia Research
                                               Collective, Wild Me also completed an ID
                                               review, ensuring that all annotations
                                               assigned to an ID belonged to that ID,
                                               ensuring a high quality training data set. The
                                               resulting spreadsheet can be found here:
                                               https://docs.google.com/spreadsheets/d/1eS
                                               _ACzY-
                                               4BrEOp8KGp6lV_CCjrj6Rr08bdURL9NulZQ
                                               /edit?usp=sharing

                                                   2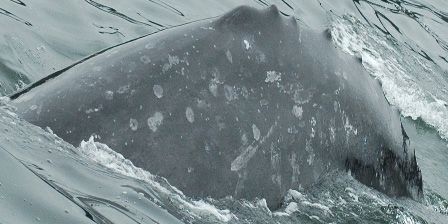
Task                 Computer                           Status                        Award
                                   Vision
                                 Techniques

 Evaluate the HotSpotter         HotSpotter      COMPLETE:                                        BOEM
 algorithm performance on        [C]             Annotations were compared to determine
 matching lateral gray whales                    the % accuracy when used to compare the
 (e.g., top-1 % correct match,                   same individuals’ photos against a catalog of
 top-5%, etc.). Generated                        other individuals.
 require reports and project
 summaries.

 Evaluate finFindR or            CurvRank v2     COMPLETE:                                        NOAA
 CurvRank algorithm              [E]             CurvRank v2 was chosen after
 performance on matching                         demonstrating its superior performance over
 lateral gray whales (e.g.,                      the current generation of finFindR for
 top-1 % correct match, top-                     multiple species in the “AI for MAPS” BOEM
 5%, etc.). The algorithm                        project. CurvRank v2 was retrained on over
 chosen for full evaluation                      2000 hand-traced dorsal ridges to ensure
 will be decided after a                         maximum performance for the gray whale
 literature and functional                       use case.
 review.
                                                 With the gray whale CurvRank v2 model
                                                 created, annotations were compared to
                                                 determine the % accuracy when used to
                                                 compare the same individuals’ photos
                                                 against a catalog of other individuals.

 Retrain and evaluate right      PIE [D]         COMPLETE:                                        NOAA
 whale lateral matching                          Annotations were compared to determine
 performance developed in                        the % accuracy when used to compare the
 NOAA contract                                   same individuals’ photos against a catalog of
 1333MF19PNFFM0139 on                            other individuals.
 matching lateral gray whales
 (e.g., top-1 % correct match,
 top-5%, etc.)

 Generate a final report of                      COMPLETE:                                        NOAA
 matching performance for                        Wild Me staff collaborated to generate this
 NOAA and suggest avenues                        summary report of all work and its
 forward.                                        outcomes.

1.2 CurvRank v2, PIE, and Combined Performance Results
1.2.1   Adding CurvRank v2

From April to May 2021, Wild Me Machine Learning Engineer Drew Blount re-trained CurvRank v2 [5].
Prior to this retraining, Wild Me’s annotation team completed the precursor dorsal ridge tracing of 2182
annotations that were used in the training. A zip file of the visualizations of the tracings for that can be
found here:
https://drive.google.com/file/d/1scJUhkTthQl964R1c0JHNBO31obbdmUl/view?usp=sharing

We performed a number of training experiments, including different techniques for mirroring right-side
images to have a left-like appearance, and exploring the parameter space of the CurvRank v2 training

                                                     3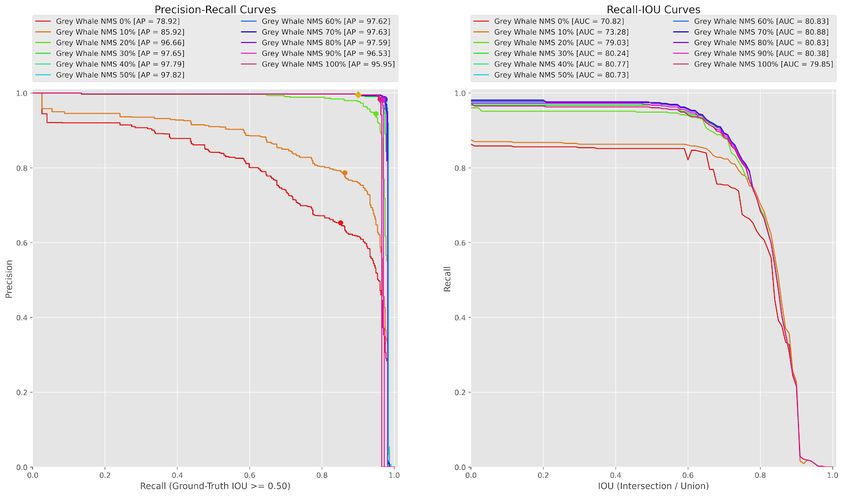
pipeline by modifying the learning rate, training time, or image resolution. We also tried swapping out
components of the gray whale model with components from a CurvRank v2 model trained on dolphin and
baleen whale dorsal fins: CurvRank v2 has three distinct models which operate in series, and we tried
various combinations of those trained on gray whales, and those trained on dorsal fins. Our most accurate
model did not use any of these dolphin-trained components.

Figure 1. An automatically-extracted curve from our gray whale model. The errors on the ends are
consistent with CurvRank’s behavior on dolphin dorsal fins, where matching is significantly more
accurate.

Despite showing a consistent ability to extract the edges of gray whale dorsal ridges, though with some
errors (pictured above), CurvRank v2 was not very effective at matching these edges, with a top-1
accuracy of 20%, rising to a top-20 accuracy still shy of 50% --- in fact, 43.5% on our test dataset with a
minimum of 2 sightings per individual, charted below. We are not certain why accuracy is so low, but a
large variety of experiments we performed with CurvRank v2 and this data produced similar results, so
we believe it may simply be a poor fit by the algorithm when computing the visual features.

Figure 2. CurvRank v2 top-N ID matching performance

1.2.2    Evaluating PIE v2

During the course of this project, PIE’s original developer Olga Moskvyak developed a second generation
of the algorithm in the context of a separate project with Wild Me to modernize whale shark (Rhincodon
typus) photo ID on whaleshark.org. PIE v2 significantly outperformed PIE v1 in that context and
provided a more maintainable technical foundation with a switch from TensorFlow to PyTorch at its core

                                                     4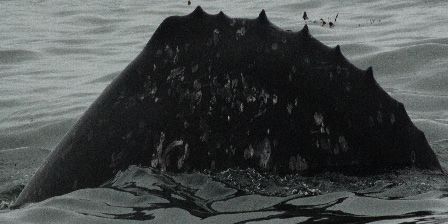
(i.e. PIE v2 requires less computational resources and runs a more stable codebase), and we chose to go
above and beyond our contracted obligation and also evaluate PIE v2 on gray whale flanks. Olga reported
an independent performance of the following for gray whales with PIE v2 (training on the right sides and
testing on the left with min 3 images per name):

    •   Top-1 : 69.0%
    •   Top-5 : 81.4%
    •   Top-12 : 86.7%

We evaluated PIE v2 independently and achieved the following comparative plot. Note that this plot
assumes a minimum of three annotations (min-3) of a side per individual.

Figure 3. Combined top-N accuracy for all evaluated ID algorithms

Our review showed slightly lower Top-1 performance for PIE v2 but higher top-5 and top-12
performance than reported by Moskvyak. This discrepancy is explained by differing test setups and slight
changes in experimental environments between Moskvyak and Wild Me. An interesting caveat of our
reanalysis using min-3 sighting data significantly improved PIE v1 and HotSpotter performance, and
especially CurvRank v2 performance, which more than doubles compared to the min-2 plot earlier in this
report. The discrepancy is explained purely by the data used to make each plot: min-2 sightings or min-3,
where the number 2 or 3 indicates the minimum number of photos per individual in the test set. Min-3
data has more photos per individual, and a smaller set of candidate individuals because of that filtering,
than min-2 data. Previously reported Hotspotter and PIE v1 results from our report “Gray Whale Pose
Invariant Embeddings (PIE v1) Results” on 3/11/21 were performed on a min-2 sighting basis versus the
min-3 sighting results presented above. Our algorithms consistently perform better on min-3 sighting
data, showing how (unlike manual matching that is often based on a single exemplar image) having more
examples of an individual gives the computer vision system more information and greater ability to make
the correct match. This pattern is not unique to gray whales or any of these particular models.

1.2.3   Standardized Performance Review Across Algorithms

Because Flukebook contains a multi-species, multi-feature, and multi-algorithm technical foundation [D],
more than one algorithm can be run in parallel when trying to identify the individual animal in a photo.

                                                    5
Therefore across PIE v1, PIE v2, HotSpotter, and CurvRank v2, we created a standardized min-2 test set*
(i.e. each individual considered need only have two annotations of a side) evaluated and plotted all
algorithms and their combinations to suggest an optimal algorithm combination for deployment in
Flukebook.org.
*
The PIE training process needs min-3 photos per individual for algorithm training. However, for testing algorithm
performance in general, only min-2 data are needed to ensure that every query image has at least one other image it
could correctly match against. This also allows for more individuals to be considered for a more exhaustive top-N
analysis because invariably more individuals are sighted at least twice than are sighted at least three times.
Figure 4. Top-n accuracy for all ID matching algorithms evaluated as well as their combined
performance.
1.2.4 Recommended Algorithm Deployment in Flukebook.org
Based on the comparative results presented above, we recommend a minimum, default deployment
configuration of PIE v2 and Hotspotter. PIE and HotSpotter offer significant complementary performance
(i.e. each can significantly catch matches missed by the other) of top-1 71% and top-12 89%, while
CurvRank v2 offered a minimal improvement to their results. While Wild Me is pleased that its own work
with PIE v1 produced a model that modestly outperforms PIE v2 for gray whales in many cases, the
technical compatibility of PIE v2 (PyTorch-based) provides a support incentive (i.e. PyTorch is much
better at RAM management than TensorFlow, reducing overall support time and costs) and likely worth
the trade-off in top-12 performance overall. However, PIE v1 and CurvRank v2 can also be available as
selectable but non-default algorithms for the near future for evaluation and as a selectable, maximized
configuration of PIE v1+Hotspotter+CurvRank v2 (top 1 70%, top-12 92%).
61.3 Opportunities for Further Development
1.3.1 Improving CurvRank v2
We were somewhat underwhelmed by the accuracy of the CurvRank v2 dorsal ridge matcher. As we see
in the charts above, not only is it the poorest-performing matching algorithm we’ve deployed for gray
whales, but it provides very little additional accuracy when combined with results from PIE and
HotSpotter. Before this analysis was complete we had proposed further investment in CurvRank v2, but
we now conclude that development resources would be better spent on other algorithms for this species.
1.3.2 Surveying time delta impacts on matchability
One striking feature of gray whale patterns is their gradual change over time, with new scars and
markings appearing as the animals age. We work on pattern-based automated ID for a large number of
species, and gray whales might be those whose patterns change the most; they contrast with e.g. zebras,
whale sharks, or humpback whale flukes where identifiable pigmentation is more constant throughout the
animal’s life. This work with gray whales has inspired us to take change over time into account,
investigating how the date of each sighting might be utilized to increase matching accuracy.
We would like to perform a number of experiments comparing temporality and matchability. To begin,
we would investigate limiting match-against sets to photos taken within N years of each query photo. We
suspect that, for the right value of N, matchers could be more accurate because we are not comparing
temporally-distant photos where the same individual has significantly different patterns. We would
therefore experiment to find if there exists an N where, by limiting matching sets in this way, we can get a
more-accurate gray whale matcher. This would then be used in a match-against filter we would
implement on Flukebook, so for example users could choose when starting a match if they are comparing
all gray whales or only sightings within (for example) 5 years. Keeping both options available means we
don’t preclude matching for whales with large gaps between sightings.
If successful, this temporal filtering strategy would apply not only to PIE or HotSpotter (and CurvRank),
but any matching algorithm, and other species as well as gray whales. By setting the aforementioned N-
year filtering cutoff experimentally rather than a priori, we could account for different visual features
changing at different rates, or even the sensitivity of different algorithms to that change. We could also re-
compute that N after more datasets or new populations are added to Flukebook.
There are other temporal experiments that we have discussed internally, including incorporating each
photo’s timestamp as part of the input of a learning algorithm such as PIE. We will be raising this topic
with our collaborator Professor Chuck Stewart at Rensselaer Polytechnic Institute, as it would make for a
good subject of graduate research or a focused engagement by the Wild Me machine learning staff. And
as is often the case, further avenues of investigation may present themselves as we do this work.
However, for the scope of the next development investment we think this is a good starting point.
2 References
[A] Parham J, Stewart C, Crall JP, Rubenstein D, Holmberg J, and Berger-Wolf T. 2018. An Animal
Detection Pipeline for Identification. 1075-1083. 10.1109/WACV.2018.00123.
[B] Wildbook Image Analysis (WBIA) Pipeline: https://docs.wildme.org/docs/researchers/ia_pipeline
[C] Crall JP, Stewart CV, Berger-Wolf TY, Rubenstein DI, and Sundaresan SR. 2013. HotSpotter-
Patterned species instance recognition. In 2013 IEEE Workshop on Applications of Computer Vision,
7WACV 2013 (p. 230-237). [6475023] (Proceedings of IEEE Workshop on Applications of Computer
Vision). https://doi.org/10.1109/WACV.2013.6475023
[D] Moskvyak O, et al. 2019. Robust Re-identification of Manta Rays from Natural Markings by
Learning Pose Invariant Embeddings. https://arxiv.org/pdf/1902.10847.pdf
[E] Weideman HJ, Jablons ZM, Holmberg J, Flynn K, Calambokidis J, Tyson RB, Allen JB, Wells RS,
Hupman K, Urian K, and Stewart CV. 2017. Integral Curvature Representation and Matching
Algorithms for Identification of Dolphins and Whales. doi: 10.1002/ar.2365
8Appendix A: AI for Gray Whales Q1 2021 Progress Report
Prepared for BOEM and NOAA
Wild Me made good progress in Q1 2021 toward the goals of the AI for Gray Whales project
(Award 140M0120P0023).
A.1 Major Accomplishments (January-March 2021)
• Wild Me trained and evaluated PIE [4] machine learning individual ID model. Results are
summarized below and covered exhaustively in this document. This task is now
complete, and the model is fully available in the Flukebook.org platform.
• Wild Me’s annotation team also recently completed the precursor dorsal ridge tracing
that will be used to train CurvRank v2 [5]. A zip file of the visualizations of the tracings
for that can be found here:
https://drive.google.com/file/d/1scJUhkTthQl964R1c0JHNBO31obbdmUl/view?usp=shari
ng
A.2 PIE v1 Accuracy
The accuracy achieved on PIE v1 [1] for gray whales was:
• top-1: 43.0%
• top-5: 69.5%
• top-12: 81.6%.
This is validation accuracy, meaning that the validation data included no photos used during
training.
A.3 PIE Comparison with HotSpotter pattern matcher
Used on humpback whales and many other species, the HotSpotter algorithm [3] differs from
PIE in that it is a general, visual texture pattern matcher that is not trained or specialized for
particular species. We compared the accuracy of HotSpotter to PIE on our left-side, 3-sighting
gray whale validation images.
Results are summarized and further analyzed in this document.
9Figure A1. PIE vs. HotSpotter initial evaluation
A.4 Next Up: CurvRank v2
With both PIE and HotSpotter now deployed on Flukebook, our focus will shift to training the
CurvRank v2 algorithm on traced dorsal ridges and evaluating its predictive accuracy on CRC
data. Dorsal ridge tracing has already been completed.
10Appendix B: Gray Whale Pose Invariant Embeddings (PIE v1) Results
3/11/2021
B.1 Training Data
The training data was provided by Cascadia Research Collective and represents their gray
whale catalog. Only IDs and photos were consistently provided. At our request, prior to training
they did a manual review of the IDs to minimize possible labeling errors, where a researcher
reviewed every photo for every name to confirm an accurate ID label. Filtering for only the
whales with at least 3 sightings (a requirement for PIE training and validation), we had 2,012
right-side and 1,878 left-side photos of 359 identified individuals.
When PIE is used on lateral views, we mirror every right-side image so that each picture PIE
sees looks like a left-side image, ensuring the model is always seeing a standard orientation.
During matching, viewpoints are already labeled and we do not compare rights to lefts or vice
versa. This gives us several options for how to handle rights versus lefts in training. We
explored training on all 3,890 right- and left-images in one go, splitting each individual into a
right-name and a left-name so that the system does not confuse the two sides, but this did not
improve validation accuracy over models trained on only one side. A possible reason for this is
that the edge contour, which unlike the patterning is shared by both sides, is influencing PIE’s
match rankings. We ultimately trained our model on all the right-side photos, leaving out the left-
side photos from training to provide the robust validation accuracy numbers reported here.
B.2 PIE v1 Accuracy
The accuracy achieved on PIE v1 [1] for gray whales was:
• top-1: 43.0%
• top-5: 69.5%
• top-12: 81.6%.
This is validation accuracy, meaning that the validation data included no photos used during
training.
Because these figures are lower than our preconceived expectations of matchability with PIE v1
(i.e. lower than was seen with this algorithm on right whale laterals but comparable to orca
laterals), we investigated several hypotheses for why this species/data is more challenging.
Pattern change over time
Since the matchable patterns are heavily scar-based, we suspected that their change over time
could explain this lower accuracy. Our investigations showed mixed support for this hypothesis.
Looking at 1329 timestamped validation photos of 273 individuals (each individual has at least 3
photos in this set), we looked at two data points: the time delta between a query photo and its
(temporally) nearest correct candidate match, which we will call min_tdelta; and the mean time
delta between a query photo and all of its correct candidate matches, which we will call
mean_tdelta.
11For the 1329 timestamped validation photos, we divided them into two sets: the 1221 photos that were matched with rank
Figure B1. Match rank vs. time between sightings

These two results are contraindicative. Photos that are not matchable generally have higher
tdeltas than those that are matchable, but this does not appear to affect at what rank a correct
match appears (a rough measure of “how matchable” a matchable photo is). We believe that
change over time is a significant explanation for the PIE accuracy we are seeing, though it is not
a perfect or complete explanation.

Pattern variability vs. ridge contour consistency

We have heard from researchers at Cascadia Research Collective that the dorsal ridges,
posterior of the dorsal fin, are more effective than patterns for matching these animals. We
noticed several supporting examples of these among the unmatched validation images
(examples below). Two things we notice are how distinct the ridges are and how variable the
patterns are, making it difficult for a human (and we believe PIE as well) to identify which parts
of the pattern are useful for matching.
The large image is a query that failed to match any candidates; the three smaller images are the
correct candidates of the same individual that PIE failed to identify. The ridge seems more
distinctive than the changing patterns.

                                                13
The example below highlights how gray whales show a lot of visual pattern, but that pattern can
vary greatly from encounter to encounter. The distinctive patterning in the smaller photos is not
shared in the larger photo that failed to match with PIE. We believe PIE is struggling to
distinguish between relevant and irrelevant patterns for matching purposes. The dorsal ridge
seems the more effective way to match this individual.
14Figure B2. Visual review of patterning changes with time
Subsequent experiments with the CurvRank edge-contour matching algorithm will show how
much this improves the overall matching system alongside this PIE algorithm.
B.3 Comparison with HotSpotter pattern matcher
Used on humpback whales and many other species, the HotSpotter algorithm [2] differs from
PIE in that it is a general, visual texture pattern matcher that is not trained or specialized for
particular species. We compared the accuracy of HotSpotter to PIE on our left-side, 3-sighting
gray whale validation images.
We see that HotSpotter has a higher rank-1 accuracy of 62% and lower accuracy at ranks 5 and
above compared to PIE. HotSpotter has remarkably consistent matching, and on this data it
either finds a match correctly at rank 1 or it fails to find a match at any rank. We have seen
HotSpotter behave this way on many several species including orcas. In contrast, PIE has a
15more intuitive shape of the accuracy-rank curve and can find matches at every rank, with fewer
matches at each higher rank, but of course higher cumulative accuracy.
Both HotSpotter and PIE are now available for use on Flukebook and can be started
concurrently for any gray whale query image.
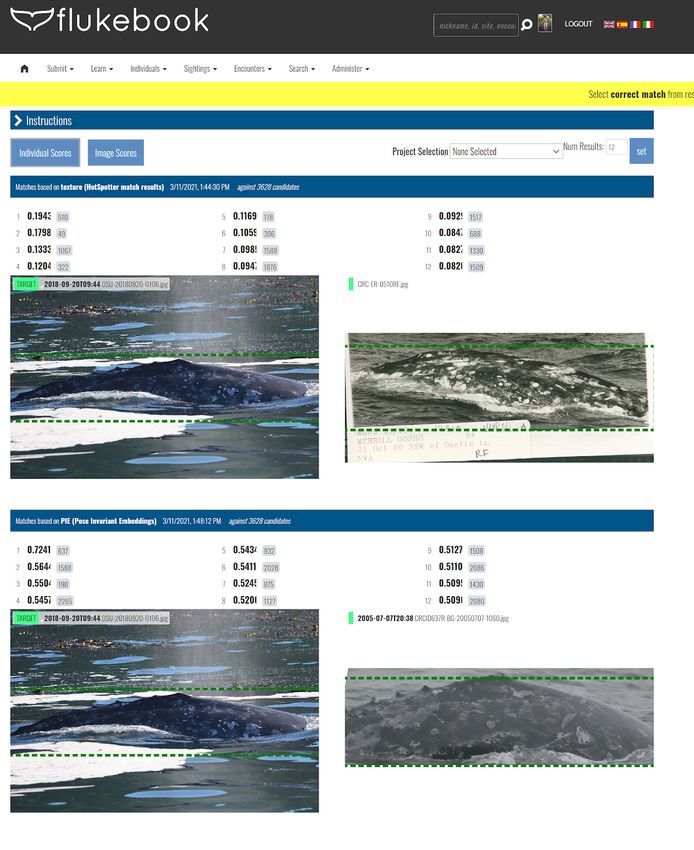
16Figure B3. An example match result in Flukebook. Both HotSpotter and PIE have been deployed
and can be run in tandem. In this example, PIE successfully predicts the correct match in rank 1
while HotSpotter does not find. Link to result.
17B.4 Next Up: CurvRank v2
With both PIE and HotSpotter now deployed on Flukebook, our focus will shift to training the
CurvRank v2 algorithm [3] on traced dorsal ridges and evaluating its predictive accuracy on
CRC data. Dorsal ridge tracing has already been completed.
B.5 Potential: PIE v2
In our ongoing work on other species with Olga Moskvyak, we learned that a second generation
PIE v2 algorithm has been developed. It has already proven to exceed PIE v1 significantly for
another species. Wild Me has already begun integration of PIE v2. While a new PIE v2 model is
not promised under this contract, we do anticipate re-evaluating these PIE results in the near
future and presenting the revised results.
18Appendix C: AI for Gray Whales Q4 Progress Report
Prepared for BOEM and NOAA
Wild Me made good progress in Q4 2020 toward the goals of the AI for Gray Whales project
(Award 140M0120P0023).
C.1 Major Accomplishments (Sept-Dec 2020)
The following major accomplishments occurred in Q4 2020:
• Project post-award meeting occurred on 9/15/2020. Meeting summary follows this
report.
• Wild Me attended and presented at a Project Kick-off Meeting on September 30th.
• Discussions around data and data sharing were conducted at two gray whale working
group meetings on Oct. 5th and 30th, which included a broader array of project
participants. Project notes are included with this report.
• Wild Me received the following data sets and incorporated subsets into our annotation
interface machine learning detector training:
o CRC gray whale catalog, including photos and IDs. Metadata (where/when) was
incomplete but unnecessary for this project.
o Sample photos representing field conditions during data collection by the Makah
Tribe
o Data from Sergio at LSIESP
• Wild Me hand annotated 2085 images from across the data sets provided. 2182
annotations (bounding boxes) were made, representing some photos with >1 whale. A
video of the process can be found at: https://youtu.be/rS5lmQKjceE
• Wild Me started training the machine learning-based detector model that will run in the
Wildbook Image Analysis pipeline [1][2].
C.2 Major Accomplishments (January 2020)
• Wild Me completed detector model training on January 14th. Precision and recall curves
are visualized here.
1920
21
Figure C1. Machine learning detector performance visualization

       We have provided visualizations of the training, which includes a background masking
       ML stage. Here is a zip with rich examples:
       https://drive.google.com/file/d/18ElLvknV3v79JcxxffAz8y7En1bUP7zJ/view?usp=sharing

   •   On January 25, 2021, Wild Me completed detector model integration into Flukebook.org
       and imported the CRC catalog of IDs and photos, running the detector to create
       Annotations (i.e. bounding boxes) for each whale in each photo. With this integration, the
       HotSpotter [3] algorithm was primed (texture features extracted) and is now available for
       matching in Flukebook.org. A video demonstrates this progress:
       https://youtu.be/YFRJlRWsbQ4.

                                               22
• Trevor Joyce (NOAA), CRC staff, and Jake Levenson (BOEM) have been provided with
access to review data and HotSpotter matching.
• CRC staff and NOAA personnel were provided with a data review interface to ensure
accurate data is used for subsequent project ML training with PIE [4] and CurvRank v2
[5]: https://docs.google.com/spreadsheets/d/1eS_ACzY-
4BrEOp8KGp6lV_CCjrj6Rr08bdURL9NulZQ/edit?usp=sharing
C.3 Upcoming Developments
• Wild Me will start PIE training February 8, 2021.
• CurvRank v2 training is expected to start early March 2021.
C.4 Contact Information
For additional questions and clarifications, please contact:
Jason Holmberg
Executive Director, Wild Me
503-545-7745
jason@wildme.org
C.5 References
[1] Parham, Jason & Stewart, Charles & Crall, J.P. & Rubenstein, Daniel & Holmberg, Jason &
Berger-Wolf, Tanya. (2018). An Animal Detection Pipeline for Identification. 1075-1083.
10.1109/WACV.2018.00123.
[2] Wildbook Image Analysis (WBIA) Pipeline:
https://docs.wildme.org/docs/researchers/ia_pipeline
[3] Crall, J. P., Stewart, C. V., Berger-Wolf, T. Y., Rubenstein, D. I., & Sundaresan, S. R. (2013).
HotSpotter-Patterned species instance recognition. In 2013 IEEE Workshop on Applications
of Computer Vision, WACV 2013 (pp. 230-237). [6475023] (Proceedings of IEEE Workshop
on Applications of Computer Vision). https://doi.org/10.1109/WACV.2013.6475023
[4] Moskvyak O. et al. 2019 Robust Re-identification of Manta Rays from
Natural Markings by Learning Pose Invariant Embeddings. https://arxiv.org/pdf/1902.10847.pdf
[5] Weideman, H.J, Z.M. Jablons, J. Holmberg, K. Flynn, J. Calambokidis, R. B. Tyson, J.B.
Allen, R.S. Wells, K. Hupman, K. Urian, C.V. Stewart. 2017. Integral Curvature
Representation and Matching Algorithms for Identification of Dolphins and Whales. doi:
10.1002/ar.2365
23Department of the Interior (DOI) The Department of the Interior protects and manages the Nation's natural resources and cultural heritage; provides scientific and other information about those resources; and honors the Nation’s trust responsibilities or special commitments to American Indians, Alaska Natives, and affiliated island communities. Bureau of Ocean Energy Management (BOEM) The mission of the Bureau of Ocean Energy Management is to manage development of U.S. Outer Continental Shelf energy and mineral resources in an environmentally and economically responsible way. BOEM Environmental Studies Program The mission of the Environmental Studies Program is to provide the information needed to predict, assess, and manage impacts from offshore energy and marine mineral exploration, development, and production activities on human, marine, and coastal environments. The proposal, selection, research, review, collaboration, production, and dissemination of each of BOEM’s Environmental Studies follows the DOI Code of Scientific and Scholarly Conduct, in support of a culture of scientific and professional integrity, as set out in the DOI Departmental Manual (305 DM 3).
You can also read


