A Data Integration and Analysis System for Safe Route Planning
←
→
Page content transcription
If your browser does not render page correctly, please read the page content below

Int'l Conf. Information and Knowledge Engineering | IKE'18 |                                                                         111

        A Data Integration and Analysis System for Safe Route
                              Planning
                                          Reza Sarraf, Michael P. McGuire
                 Department of Computer and Information Sciences, Towson University, Towson, MD, USA

                                                                       month, hour, weather conditions, and light conditions. The
 Abstract - This paper is an essential approach to design a robust
                                                                       evaluation of the Safe Route Planner showed promising results,
 Safe Route Planner that can result in saving lives of drivers.
                                                                       and it detected and ignored some high-risk roads. In this paper,
 Some roads are more prone to car crashes, it can be due to their
                                                                       the authors aim at improving the accuracy and precision of the
 geometric characteristics, poor visibility, road surface, road
                                                                       Safe Route Planner and add some new capabilities, such as
 lightening, higher speed limit, traffic volume, or crossing
                                                                       avoiding roads with high curvature and residential roads.
 animals. The use of big data can help us to detect hidden
 patterns, such as identifying road segments with high crash risk.         This paper proposes a Safe Route Planner that uses historical
 In this research, we aim at designing a robust Safe Route             crash data and an open source map to find safest roads to a given
 Planner that is a fully automated approach to direct drivers to       destination. The manual and physical road assessment using
 drive on roads with lower risk of accidents and to minimize the       high-end technologies and trained personnel is more accurate;
 occurrence of road accidents.                                         however, it takes a long time to evaluate the roads. The purpose
                                                                       of this study is to extend the capabilities of a previously
 Keywords: safety level; OpenStreetMap; routing algorithms;            designed Safe Route Planner, and improve its accuracy by
 traffic crashes                                                       incorporating different crash types namely, property damage,
                                                                       injury, fatal, and real-time crashes.
 1    Introduction
                                                                          The main contributions of this paper are as follows:
       With all the improvements in car technologies, traffic
                                                                           • This paper presents a more robust approach to design a
 laws, and road infrastructure advancements, motor vehicle
                                                                           Safe Route Planner that incorporates real crash data, an
 fatalities are still too high. The National Vital Statistics Report
                                                                           open source map, and a state of the art routing algorithm to
 (NVSR) reported 37,757 motor vehicle fatalities in the United
                                                                           find the safest path to a given destination;
 States in 2015. That is 6.7 percent up from 2013 [1]. The
 National Safety Council estimated 40,200 motor vehicle                    • Improving the accuracy and precision of the Safe
 fatalities in 2016 which is six percent upward trend from 2015            Route Planner which was limited to fatal crashes by adding
 [2]. These numbers clearly show that there needs to be more               injury crashes, property damage crashes and real-time
 done to reduce the number of crashes and fatalities.                      crashes;
     Drivers usually have a preferred daily commute path that is           • A new weight calculation method for the Safe Route
 not necessarily the shortest. The preferred path is chosen due to         Planner is presented;
 the drivers’ familiarity with the area, traffic and physical road
 conditions. Drivers tend to avoid roads with high anomalies, like         • The Safe Route Planner not only presents the safest
 potholes or unsafe roads. There is a hidden fact about roads, and         route to a given destination, but it also uses color coding
 that is the number of crashes on the roads which cannot be                system to demonstrate the safety level of each segment of
 observed. However, we can rely on historic crash records to               the road.
 detect high-risk roads. Considering how many people rely on               • Estimating the average annual daily traffic counts for
 technology to navigate while driving, there needs to be an                all roads;
 approach that allows a driver to choose the safest path to a
 destination. Moreover, research has shown the willingness of              • A residential avoidance method is proposed to keep
 professional drivers to take the safest routes [3].                       residential roads safe for residents, while suggesting the
                                                                           safest path to the drivers. Furthermore, the authors present
      The authors previously presented the Safe Route Planner              a method to prevent roads with high curvature that results
 that was a fully automated method to find the safest route to a           in higher safety for drivers.
 given destination by incorporating fatal accidents, an open
 source map, and a routing algorithm [4]. The system allowed the           • The Safe Route Planner validated and was compared
 users to detect deadly roads in Maryland and suggest an                   with directions from Waze and Google Maps.
 alternative path. Furthermore, the Safe Route Planner could
 filter historical accident data based on parameters such as year,

                                               ISBN: 1-60132-484-7, CSREA Press ©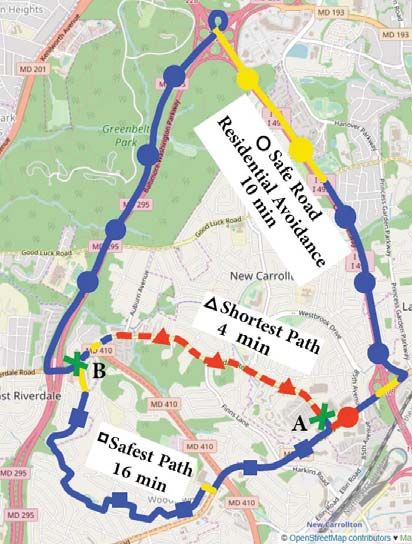
112                                                                   Int'l Conf. Information and Knowledge Engineering | IKE'18 |

 2    Literature review                                                 3       Methodology
       The traditional routing method that is offered by most                 The required elements to design a Safe Route Planner are
 applications such as Google Maps and Waze are based on fastest         historical crash data, traffic counts, a routing algorithm, and an
 route or shortest path. Some publications present dynamic traffic      open source map. In the dataset section, two different crash
 routing that considers some other factors while suggesting a path      datasets, a traffic count dataset, and an open source map data are
 to a given destination. For instance in [5] the use of dynamic         described. In the architecture section, the overall architecture of
 routing in severe weather conditions is demonstrated to avoid          the system is explained. In the weight calculation section, the
 areas with severe weather conditions like tornadoes. Another           method to calculate the weights of each road is presented.
 dynamic routing system that can avoid blocked areas due to a
 natural disaster such as a flood is presented in [6]. Shah, Bao,       3.1      Datasets
 Lu, and Chen [7] designed a safe route recommender,                         In this section, four different datasets which are used in the
 CROWDSAFE, which suggests safe routes based on a historical            design of the Safe Route Planner are presented.
 crime dataset to avoid high crime rate areas.
     Some researchers focused on designing risk maps or heat            3.1.1    Fatality Analysis Reporting System (FARS)
 maps namely, Incident Cluster Explorer (ICE) [8], Saferoadmap                The United States Fatality Analysis Reporting System
 [9], EuroRap and usRap [10] based on real historic crash data.         (FARS) was developed in 1975 by the National Center for
 In these tools, different colors are utilized to represent crash       Statistics and Analysis (NCSA) which is a part of the U.S.
 density or the risk of crash on roads. Having these risk maps are      Department of Transportation National Highway Traffic Safety
 necessary, but not sufficient.                                         Administration (NHTSA) and covers fatal crashes within the 50
                                                                        states, the District of Columbia, and Puerto Rico [16]. To be
     The above-mentioned risk maps must be manually                     included in FARS, the crash must result in a death of a person,
 interpreted to find the safest routes; this process is time            occupant or non-occupant, within 30 days of the crash. The
 consuming, and can be complex for drivers that results in              required element to use FARS dataset in the Safe Route Planner
 ignoring them. A fully automated approach is desired to                is the availability of longitude and latitude in the dataset. Any
 interpret the maps and suggest the safest route to a given             FARS datasets prior to 2001 are missing the coordinate
 destination.                                                           information. The proposed system in this research is using
     Another area of research is preventing crashes on horizontal       FARS data from 2001 to 2016. There are 8,217 fatal records in
 curves. Horizontal curve refers to a bend to the left or right of      Maryland during the given time period.
 the roadway while vertical curve refers to the changes in the
 elevation of a roadway. Roads with high horizontal curvature           3.1.2   Statewide Crash Data (SWC)
 (high departure from straightness) are another source of high                The Department of Maryland State Police quarterly
 crash risk. Particularly, the accident rates on mainly straight        publishes Maryland Statewide Vehicle Crashes; crash data for
 roads with few sudden curves are around three times higher than        11 quarters were obtained that covers the crashes from January
 roads with many curves [11]. The National Cooperative                  2015 through September 2017 [17]. The datasets include fatal
 Highway Research Program (NCHRP) developed A Guide for                 crashes, injury crashes, and property damage accidents. The
 Reducing Collisions on Horizontal Curves to provide strategies         datasets consist of information about the accident, person,
 to reduce the frequency and severity of crashes on horizontal          vehicle, emergency, medical services, road condition and
 curves [12]. The Federal Highway Administration also                   weather condition. In total there are 311,025 records, of which
 developed Low-Cost Treatments for Horizontal Curve Safety in           218,849 of them are property damage accidents, 90,921 records
 2006 and issued an update to the document in 2016 [13].                are accidents with injury and 1,255 are fatal accidents.
     Hummer [14] studied characteristics of horizontal curve            3.1.3    Traffic data
 collisions by comparing more than 51,000 crashes from 2003 to
                                                                            The Maryland State Highway Administration (MD SHA)
 2005 on two-lane road curves in North Carolina with all two-
                                                                        publishes Annual Average Daily Traffic (AADT) data annually
 lane roads and more than 91,000 crashes on all roads. The study
                                                                        [18]. The AADT shows the number of vehicles expected to pass
 shows fatal and disabling injury collision rates in two-lane curve
                                                                        a given location for both direction in an average day of the year.
 roads are twice as in all two-lane and all statewide roads.
                                                                        The data is collected from over 8700 program count stations and
     A study [15] reported a strong relationship between crash          91 continuous automatic traffic recorders (ATRs). While the
 rates and horizontal curvatures. The crash rate is higher for          program count data is collected either at three or six year
 restrictive curves with limited sight distance and/or small radii      intervals the ATR data is collected continuously. The
 followed by non-restrictive curves and finally tangent segments        intermediary years for program count data are calculated based
 have the lowest crash rate. The investigation was conducted on         on growth factor.
 a 15.7 miles stretch of the US-191 highway in southwest
                                                                           There are two different types of Annual Average Daily
 Montana with many sharp turns. Every tenth of a mile was
                                                                        Traffic data available: lines and points. The points’ dataset is of
 considered as a segment for investigation and ten years of crash
                                                                        no use since there is not enough information to reconstruct roads
 data that includes 356 crashes were obtained for the study
                                                                        and map all the available road sections to OpenSteetMap ways.
 corridor.

                                              ISBN: 1-60132-484-7, CSREA Press ©
Int'l Conf. Information and Knowledge Engineering | IKE'18 | 113
The lines dataset was selected due to the availability of data sinuosity of the road segment. This can result in capturing a high
points that form the ways, it allows to reconstruct each road curvature that is neutralized due to a long tangent.
section which is described later.
Another required element to enhance the Safe Route Planner
3.1.4 OpenStreetMap is the ability of the planner to receive real-time crash data and
calculate the safety level of the roads in real-time. The real-time
OpenStreetMap (OSM) is an open source map with free
crash monitoring module is connected to MapQuest’s traffic
access to a street map of the world [19]. OSM raw geographic
API to receive real-time traffic incident information every 20
data is stored in .osm files which are in Extensible Markup
seconds [22]. The module stores the unique ID, date, time, and
Language (XML) format. OSM files are pure text that are
longitude and latitude of each crash to be utilized in the weight
readable by both human and machine [20].
calculations.
3.2 Architecture For the purpose of navigation, an open source application
Figure 1 depicts the overall architecture of the Safe Route that uses Dijkstra’s algorithm and A* search were used [21]. A
Planner. The OSM Way ID Finder module sends longitude and road network is a representation of a directed graph G = (V, E),
latitude of each record in the FARS and State Wide Crash data where V is a set of nodes corresponding to road intersections,
files to an online reverse geocoder. The reverse geocoder and E is a set of edges corresponding to road segments between
receives the requests and sends back an XML file per request intersections. The direction of an edge represents the traffic
that contains road name, county, state, zip code, OSM id, etc. direction, and the weight of it represents the distance between
The OSM id that is the way id for the given coordinate is saved its endpoints. In a road network, the weight can be either the
along with each accident record. Next, all the datasets namely distance or the travel time. The shortest path or shortest time
FARS, SWC, AADT, and OSM map are fed to the uploader from a source to a destination is where the sum of all the edge
software to build the necessary databases and matrices. First, the costs in the chosen path is minimum. Dijkstra is the shortest path
file parser module extracts all the information from the data files algorithm that works on a weighted graph with non-negative
and creates appropriate data tables. The Routing Matrix Builder edges to solve the single source shortest path problem. An
module creates data tables for routing purposes such as road overview of route planning algorithms in transportation
names table, weight table, and intersection table. networks can be found in [23, 24].
The AADT spatial join module is designed to spatial join 3.3 Weight calculation
AADT counts with OSM data, this module finds the associated
The weight of an edge determines whether it can be on the
traffic count for every way ID in OSM. The spatial join in
shortest path or not. The lower the weight the more likely to be
ArcGIS and QGIS were examined to map the traffic count data
selected if it is on the path from the source to the destination.
to OpenStreetMap ways. However, the result was not
Increasing the weight of an edge can prevent the edge to be
acceptable, the spatial join in both software failed to map the
selected. Dijkstra and A* algorithms are used to find the shortest
data correctly for all the roads.
path. If the weight of the edges represent the distances the
There are many roads with no traffic count data. It is crucial algorithms find the shortest path, and if the edges represent the
to estimate missing traffic count for all the roads to minimize travel time the algorithms find the fastest path. The goal of the
the effect of incomplete data on the Safe Route Planner. The Safe Route Planner is to change the weight of edges to reflect
Missing AADT Calculator module divides the entire map of both the level of the safety and the travel time.
Maryland into a grid of 15*10 cells, each cell covers
The weight of a road is determined by dividing the distance
approximately the area of 1420 meters, and then for each cell,
of the road section by the maximum speed of the road to
the average of available AADT data is calculated for different
calculate how many seconds it takes to drive from node i to node
road types and speed limits. Finally, for each region, roads are
j. OSMUploader calculates the actual weight (AW) of each road
classified by road type, and the calculated average traffic count
segment, as shown in equation (1).
is assigned to the roads with missing traffic counts.
ݐݏ݅ܦ൫݊ ǡ ݊ ൯ ൈ ͵ͲͲ
Measuring the deviation of a road from the direct path is ܹܣൌ ቆ ቇ (1)
possible by calculating the sinuosity index (SI). The sinuosity ܵ
index is calculated by dividing the actual distance between two where n is the node, and S is the speed in km/hour.
points by the air distance. The index for straight roads equals to
one and for roads with high sinuosity it is above one. The The former version of the Safe Route Planner was limited to
sinuosity calculator module calculates the sinuosity index for only fatal crashes. The number of fatal crashes is limited, we
these road types: motorway, trunk, primary, secondary, and came up with only 7,289 fatality records in Maryland and
tertiary. A way in OSM is an ordered list of nodes with Washington D.C. from 2001 to 2013. Obviously, not every road
coordinates that allows us to calculate the sinuosity index has a fatal accident; therefore, there was no information to
between any two nodes on a road segment. The module calculate the safety level for many roads with no fatal accidents.
calculates the sinuosity index for a road segment every 500 The method as shown in equation (2) was used in the former
meters. The highest calculated value will be considered as the Safe Route Planner to calculate the weight.
ISBN: 1-60132-484-7, CSREA Press ©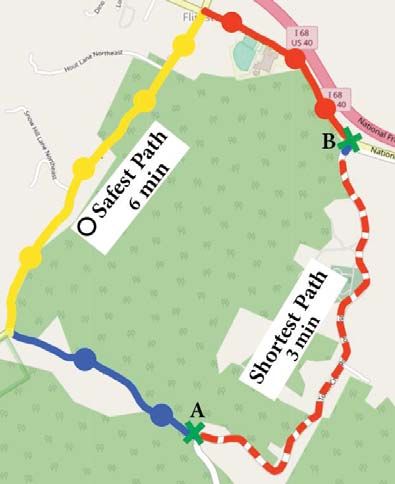
114 Int'l Conf. Information and Knowledge Engineering | IKE'18 |
Fig. 1. Overall architecture of the Safe Route Planner.
ܹ݄݁݅݃ ݐൌ ܹܣൈ ʹܯ൫݊ ǡ ݊ ൯ (2) ܹܵ൫݊ ǡ ݊ ൯ ൌ ܹܣ൫݊ ǡ ݊ ൯ ൈ ܹܴܥ൫݊ ǡ ݊ ൯ (4)
where M is the number of accidents, n is the node. To make the Safe Route Planner more interactive and
effective, curve avoidance and residential avoidance features are
To overcome the problem mentioned earlier, and in order to added that can help users to find a more suitable path. There are
increase the accuracy of the Safe Route Planner, it is essential to four sinuosity avoidance and residential avoidance levels,
gather and use more crash records. For this reason, in the current namely, none, low, medium and high with weights of 1, 2, 4,
version of the Safe Route Planner all different types of crashes, and 16, respectively.
namely property damage crashes, injury crashes, fatal crashes,
and real-time crashes are included. The Safe Route Planner in Any roads with a sinuosity index higher than 1.6 are
this paper calculates the Weighted Crash Rate (WCR) for each considered as roads with high degree of curvature. For these
road segment. Clearly, not all the crashes are the same; roads, the calculated safety weight (SW) of the road segment is
therefore, different crash types must be treated differently based multiplied by the sinuosity avoidance level to increase the
on their severity. A weight of 2 is assigned to every real-time weight of that road segment. Increasing the weight of the road
(RTime) crash since the severity is currently unknown, 5 is leads to avoiding the curvy road by the algorithm.
assigned to every property damage only (PDO), 15 to injury Residential roads are in general safer to drive due to the
(Inj) and 30 to fatal crashes. These weights are assigned based lower speed limit and less traffic volume. There are usually
on the experiment to get the best results. For every road fewer or no accidents on residential roads; consequently, it is
segment, the frequency of each crash type is multiplied by its more likely a Safe Route Planner suggests a path that is through
relevant weight and summed to find the crash rate. The result is residential areas. This results in increasing the traffic volume in
first multiplied by 100,000 vehicles traveled, then divided by the residential roads and reducing livability for residents. This is not
number of vehicles that passed the road segment in a year. The an acceptable behavior for a Safe Route Planner that threatens
WCR is calculated as shown in equation (3). the safety of residents. In order to mitigate this problem the
൫݈ܽݐܽܨ൫݊ ǡ ݊ ൯ ൈ ͵Ͳ൯ proposed system uses residential avoidance level and residential
ۇ൫݆݊ܫ൫݊ ǡ ݊ ൯ ൈ ͳͷ൯ ۊ
tolerance level.
ۈ൫ܱܲܦ൫݊ ǡ ݊ ൯ ൈ ͷ൯ ۋൈ ͳͲͲͲͲͲ (3) The path from a source to a destination is divided into three
ۉ൫ܴܶ݅݉݁൫݊ ǡ ݊ ൯ ൈ ʹ൯ ی
parts, beginning, middle and end. The middle part of a path
ܹܴܥ൫݊ ǡ ݊ ൯ ൌ ͳ which is the longest part should be only through primary roads,
ܶܦܣܣൈ ͵ͷ
and no residential roads should be allowed. In contrast, driving
The WCR is always a number greater than or equal to one. on the residential roads should be allowed at the beginning and
For roads with no accidents, the WCR equals one, and roads ending of the path. The Safe Route Planner first calculates the
with just a few accidents will be between one and two. A higher direct distance from the source to the destination, next based on
number of accidents on a road results in greater WCR weight the residential tolerance radius, the weights of all the residential
which ultimately results in increasing the weight of the road roads on the first and last 10%, 15%, 20% or 25% of the path
segment and ignoring that path. Considering two different roads would be protected, and the weight of all the residential roads in
with the same crash types and the same number of the crashes, the middle part are multiplied by the residential avoidance level.
the road with a higher traffic count will be considered safer. If the source and the destinations are too far away the 10% can
Finally, the actual weight of the road segment which is the be a large region such as an entire city; therefore, the system
distance in seconds is multiplied by WCR of the road segment limits the first and last parts to the minimum of the selected
to find the safety weight (SW) as in (4). radius or 3 miles.
ISBN: 1-60132-484-7, CSREA Press ©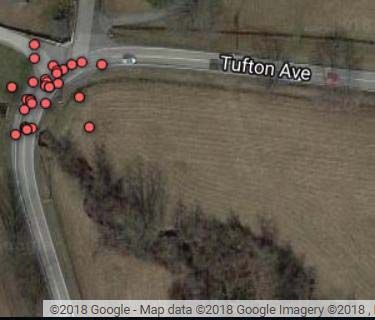
Int'l Conf. Information and Knowledge Engineering | IKE'18 |                                                                                       115

                                                   Fig. 2. Safe Route Planner’s user interface.

 4    Results                                                              crash frequency from January 2015 through September 2017.
                                                                           The highest calculated weighted crash rate for the shortest path
       In this section, first, the user interface is presented, and        is 18.91 for the road segment shown with red dashed-line in
 following that, the results of using the Safe Route Planner are           Figure 3 which confirms that this is an extremely high-risk path.
 presented. The Safe Route Planner’s user interface is shown in            Figure 3 additionally demonstrates an alternative safe path by
 Figure 2. The user has the option to either select the fastest path       the Safe Route Planner that is similar to the second and the third
 or the safest path. It is possible to limit the dataset to specific       suggested paths by Google Maps and Waze, respectively. The
 years, months, days of the week, hours, weather conditions (all           highest weighted crash rate for the suggested safe route is 4.1
 conditions, normal, rain, snow or hail), light conditions                 for the road segment shown with a yellow solid line, which is
 (daylight or dark), accidents with pedestrians or animals. The            clearly safer than the first suggested path by Waze and Google
 user has the option to adjust the Safe Route Planner so that it           Maps.
 avoids curvy roads or residential roads. The residential tolerance
 presents the radius in percentage in which the planner can
 suggest a residential road at the beginning and end of the path.
     A color coding system is used to represent the safety level of
 each road segment based on weighted crash rate. Blue color
 shows the road is safe meaning that either there were no
 accidents or there were a few accident that can be neglected due
 to high traffic volume. Yellow indicates a medium level of
 safety, and red represents a high crash rate and high risk of an
 accident.
     The first evaluation of the Safe Route Planner is based on a
 use case where the user intends to travel from Woodholme
 Avenue, Pikesville in Maryland (Point A, Figure 3) to Painters
 Mill Road, Garrison in Maryland (Point B, Figure 3). If the user
 uses a common map routing application such as Waze or Google
 Maps the path would take the user through a high risk road. The
 first suggested path by Waze and Google Maps are similar to the
 shortest path shown in Figure 3 using a dashed-line. The shortest
 path poses a high risk to the drivers due to high crash rate on                Fig. 3. Shortest and safest suggested routes from Woodholme Avenue (A)
 Reisterstown Road. Reisterstown Road has the second highest                                           to Painters Mill Road (B)

                                               ISBN: 1-60132-484-7, CSREA Press ©
116 Int'l Conf. Information and Knowledge Engineering | IKE'18 |
The second evaluation of the Safe Route Planner illustrates
the ability of the application to avoid residential roads. Figure 4
shows the shortest and safest paths from 7810 Riverdale Road,
New Carrollton in Maryland (Point A) to 67th Court, New
Carrollton in Maryland (Point B). The shortest path is similar to
the suggested path by Waze and Google Maps. The shortest path
is too risky, the calculated WCR for a road segment on the
shortest path shown with a red dashed-line is 16.58 due to a high
crash rate. Figure 4 also shows an alternative safe path using the
Safe Route Planner. Since the residential roads are usually safer,
the application suggests a path that is through residential areas,
the highest calculated WCR for this path is 5.6. Using the Fig. 5. Percentage of vehicles involved in single- and two-vehicle fatal
residential avoidance feature set to medium avoidance, the Safe crashes.
Route Planner suggests an alternative safe path with the highest
calculated WCR of 6.3 to avoid residential roads as shown in
Figure 4.
Fig. 6. Accidents on high curvature road - Tufton Ave.
Fig. 4. Shortest, safest, and a safe path using residential avoidance
suggested routes from 7810 Riverdale Road (A) to 67th Court (B)
The last evaluation of the Safe Route Planner illustrates the
curve avoidance feature. The line graph shown in Figure 5
shows the percentage of vehicles involved in single- and two-
vehicle fatal crashes based on drivers’ maneuver just prior to the
crash. The most common vehicle maneuver of single- and two- Fig. 7. A safe route using curve avoidance from Warm Springs Road
vehicle fatal crashes is going straight and the second most (A) to National Pike (B)
common vehicle maneuver is negotiating a curve. It can clearly
dashed-line from Warm Springs Road, Flintstone in Maryland
be seen that while the total number of vehicles involved in fatal
(Point A) to National Pike, Flintstone in Maryland (Point B).
crashes decreased in 2010, the number of fatal accidents on
The shortest path that is a road with high sinuosity has an
curved roads dramatically increased. The fatalities on curved
extremely high risk of accidents with a calculated weighted
roads are increasing while the fatalities on straight paths are
crash rate of 187.8. The alternative suggested path with
decreasing; therefore, there needs to be a feature of the Safe
maximum curve avoidance avoids the road with high sinuosity
Route Planner to detect curved roads and bypass them. Figure 6
and suggests a straight and safer path. The highest calculated
shows locations of accidents from January 2015 through
WCR along the safest path is 10.03 for a part of the road segment
September 2017 on Tufton Ave, Reisterstown in Maryland that
which is shown with a red solid-line.
has a high curvature. Figure 7 shows the shortest path with a red
ISBN: 1-60132-484-7, CSREA Press ©Int'l Conf. Information and Knowledge Engineering | IKE'18 | 117
datasets. In Proceedings of the IEEE International Conference on
5 Conclusions Information Reuse & Integration (IRI) (pp. 200–205).
doi:10.1109/IRI.2009.5211551
In this paper, the authors presented an enhanced version of
the Safe Route Planner [4]. One of the limitations of the former [9] Hilton, B. N., Horan, T. A., & Schooley, B. (2009). Making
version was the use of only fatal crashes, and the limited fatal Traffic Safety Personal: Visualization and Customization of
National Traffic Fatalities.
records made it difficult to calculate the safety level for all the
roads. In this research, different crash types namely, fatality, [10] Harwood, D. W., Gilmore, D. K., Bauer, K. M., Souleyrette, R.,
& Hans, Z. N. (2010, May). United States Road Assessment
injury, property damage, real-time and a new weighting method Program (usRAP) Pilot Program — Phase III Final Report.
are used to increase the accuracy and precision of the Safe Route
[11] Elvik, R., Høye, A., Vaa, T., & Sørensen, M. (2009). The
Planner. Moreover, the Safe Route Planner uses color codes to Handbook of Road Safety Measures 2nd edition. Emerald Group
show the safety level of each road segment. Publishing Limited.
A Safe Route Planner is very likely to suggest a safe path [12] Torbic, Darren J., Douglas W. Harwood, David K. Gilmore,
through residential roads due to fewer accidents on local roads. Ronald Pfefer, Timothy R. Neuman, Kevin L. Slack, and Kelly K.
However, this is not an acceptable behavior that threatens the Hardy. NCHRP Report 500: Guidance for Implementation of the
AASHTO Strategic Highway Safety Plan. Volume 7: A Guide for
safety of residents and reduces the livability for residents. The Reducing Collisions on Horizontal Curves. Transportation
authors presented residential avoidance feature to overcome this Research Board of the National Academies, Washington, DC,
issue and help both drivers and residents. 2004.
[13] McGee, Hugh W., and Fred R. Hanscom. Low-Cost Treatments
In the future studies, the authors are planning to add a for Horizontal Curve Safety. Report No. FHWA-SA-07-002,
decision making algorithm to the system. Users will be provided Federal Highway Administration, Washington, DC, 2006.
with a set of questions for choosing a route, then the decision
[14] Hummer, J. E., Rasdorf, W., Findley, D. J., Zegeer, C. V., &
making algorithm will analyze the answers and decide what path Sundstrom, C. A. (2010). Curve collisions: Road and collision
is best for the user. Another improvement can be the use of a characteristics and countermeasures. Journal of Transportation
more robust AADT calculation, for this reason, the Betweenness Safety and Security, 2(3), 203–220.
Centrality approach can be used to better predict the missing [15] Watson, D. C., Al-kaisy, A., & Anderson, N. D. (2014).
traffic counts. Examining the effect of speed, roadside features, and roadway
geometry on crash experience along a rural corridor. Journal of
6 References Modern Transportation, 22(2), 84–95.
[16] National Highway Traffic Safety Administration (NHTSA).
[1] Murphy, S. L., Xu, J., Kochanek, K. D., Curtin, S. C., & Arias, E. (2014). FARS Analytical User’s Manual 1975 to 2016, National
(2017). Deaths: Final Data for 2015. National Vital Statistics Center for Statistics and Analysis, National Highway Traffic
Reports, 66(6). National Center for Health Statistics, Hyattsville, Safety Administration, US Department of Transportation,
MD. Retrieved March 21, 2018 from Washington, DC. Retrieved from
https://www.cdc.gov/nchs/data/nvsr/nvsr66/nvsr66_06.pdf ftp://ftp.nhtsa.dot.gov/fars/FARS-DOC/
[2] National Safety Council. (2017). NSC Motor Vehicle Fatality [17] Department of Maryland State Police. Retrieved from
Estimates. National Safety Council (NSC). Retrieved from https://data.maryland.gov/Public-Safety/Maryland-Statewide-
http://www.nsc.org/NewsDocuments/2017/12-month- Vehicle-Crashes-CY2015-Quarter-/x8nz-kacb
estimates.pdf
[18] Annual Average Daily Traffic - SHA Statewide AADT Lines.
[3] Bie, J., van Arem, B., & Igamberdiev, M. (2010). Using Economic Retrieved from
Incentives to Influence Drivers’ Route Choices for Safety http://data.imap.maryland.gov/datasets/3f4b959826c34480be3e4
Enhancement: A cost-benefit analysis and the results from an 740e4ee025f_1?geometry=-87.723%2C37.336%2C-
empirical study. In Proceedings of the 89th Annual Meeting of 71.002%2C40.331
Transportation Research Board (TRB), Washington DC, January
10-14. [19] OpenStreetMap License. (n. d.). Retrieved from
http://www.openstreetmap.org/copyright
[4] Sarraf, R., & McGuire, M. P. (2018). A Data Driven Approach for
Safe Route Planning. International Journal of Applied Geospatial [20] OpenStreetMap Wiki. (2015). Retrieved from
Research, 9(1), 1–18. http://doi.org/10.4018/IJAGR.2018010101 https://wiki.openstreetmap.org/
[5] Li, Y., George, S., Apfelbeck, C., Hendawi, A. M., Hazel, D., [21] Laurent, D. (2012, January 24). Practical map routing from
Teredesai, A., & Ali, M. (2014). Routing Service With Real World geospatial database in SQLite uploaded from OpenStreetMap.
Severe Weather. In Proceedings of the 22nd ACM SIGSPATIAL Retrieved from http://www.dupuis.me/node/27
International Conference on Advances in Geographic Information
Systems (pp. 585-588). doi:10.1145/2666310.2666375 [22] MapQuest Traffic API. Retrieved from
https://business.mapquest.com/products/traffic-api/
[6] Choosumrong, S., Raghavan, V., Delucchi, L., Yoshida, D., &
Vinayaraj, P. (2014). Implementation of Dynamic Routing as a [23] Delling, D., Sanders, P., Schultes, D., & Wagner, D. (2009).
Web Service for Emergency Routing Decision Planning. Engineering Route Planning Algorithms. In J. Lerner, D. Wagner,
International Journal of Geoinformatics, 10(2), 13–20. & K. A. Zweig (Eds.), Algorithmics of Large and Complex
Networks, LNCS (Vol. 5515, pp. 117–139). Springer.
[7] Shah, S., Bao, F., Lu, C.-T., & Chen, I.-R. (2011). CROWDSAFE: doi:10.1007/978-3-642-02094-0_7
crowd sourcing of crime incidents and safe routing on mobile
devices. In Proceedings of the 19th ACM SIGSPATIAL [24] Bast, H., Delling, D., Goldberg, A. V., Pajor, T., Müller-
International Conference on Advances in Geographic Information hannemann, M., Wagner, D., & Werneck, R. F. (2014, January).
Systems (pp. 521–524). doi:10.1145/2093973.2094064. Route Planning in Transportation Networks (Technical report
MSR-TR-2014-4). Microsoft Research.
[8] Pack, M. L., Wongsuphasawat, K., VanDaniker, M., & Filippova,
D. (2009). ICE--visual analytics for transportation incident
ISBN: 1-60132-484-7, CSREA Press ©You can also read