An experimental study of removing impurity from a quartz ore by microbial flotation-acid leaching
←
→
Page content transcription
If your browser does not render page correctly, please read the page content below
Physicochem. Probl. Miner. Process., 57(1), 2021, 18-28    Physicochemical Problems of Mineral Processing

                                                                            ISSN 1643-1049
        http://www.journalssystem.com/ppmp
                                                              © Wroclaw University of Science and Technology

                         Received August 13, 2020; reviewed; accepted October 06, 2020

    An experimental study of removing impurity from a quartz ore by
                   microbial flotation-acid leaching
Jujian Zhu, Shujuan Dai, Pengcheng Li, Shuyong Yang
School of Mining Engineering, University of Science and Technology Liaoning, Anshan 114051, China

Corresponding author: shujuandai@163.com (Shujuan Dai)

Abstract: The purity of a quartz ore is relatively low at a SiO2 content of 97.18%, and the main impurity
in the ore is Fe, Al, and Ca bearing minerals. The main component in an industrial waste bacteria (WJ)
is polysaccharides, which may be used as depressors for inhibiting iron minerals in quartz flotation.
Moreover, WJ belongs to microbial inhibitors because it is mainly composed of bacteria. As a result of
this study, a concentrate grade of 99.88% at recovery over 80% was obtained under the condition of 2000
g/Mg WJ dosage, a grinding fineness of 70% -0.074 mm, pH 11.7, 400 g/Mg CaCl2, and 800 g/Mg NaOL
in the flotation experiments for the quartz ore. Moreover, a SiO2 grade of 99.97% at a recovery of 68.85%
was obtained at an acid dosage of 40 kg/Mg by using mixed acid of H2SO4, HCl, HNO3, and HF in mass
ratios of 20%, 30%, 20%, and 30%, respectively, in subsequent acid leaching of the quartz flotation
concentrate. Zeta potential analysis before and after the interaction of quartz and hematite with WJ
showed that WJ increased the zeta potential of hematite significantly but had little impact on the zeta
potential of quartz, indicating stronger adsorption of WJ on hematite than on quartz. FTIR analysis
showed that there exist not only –COOH, –CH2–, and –CH3, which are the functional groups of starch
but also NH2 and –C=O-NH– in WJ. The NH2 and –C=O-NH– in WJ are the important groups for
adsorption, so the depressing effect on hematite was better for WJ than starch.

Keywords: quartz purification, flotation, acid leaching, waste bacteria

1. Introduction
Quartz is one of the most widely distributed minerals on the earth's crust. Its physical and chemical
properties are stable, and it is an important raw mineral material for human development and
utilization. Quartz ore is mainly composed of SiO2 with a little amount of aluminum, iron, magnesium,
calcium, sodium, and potassium. The impurity minerals bearing aluminum in quartz ore are mainly
feldspar, mica, kaolin, while the impurity minerals bearing iron are mainly hematite and goethite
(Potapine, 1954; Guo and Guo, 1975).
    The SiO2 grade of ordinary quartz sand is 96%-99%, the impurity content of Fe2O3 is less than 0.5%,
and the content of Al2O3 is less than 2.0%. It is mainly used for glass products, ceramic products,
mechanical casting, cement products, chemical industry, and industrial fillers. The SiO2 content of high-
purity quartz sand is more than 99.95%, which is mainly used in aerospace, bioengineering, high-
frequency technology, electronic technology, optical fiber communication, and military industry.
Research on quartz ore purification has been widely concerned in the industry for less reserves of high-
grade quartz ore in nature and rapid development of global optical fiber communication and
semiconductor industry (Yang, 2004).
    In the quartz ores, the gangue minerals are feldspar, mica, chlorite, clay, and iron minerals. The
flotation is the most common method for quartz purification (Liu et al., 2019), and it is mainly adopted
to remove the disseminated iron and aluminum. Also, flotation can remove the secondary pig iron
which is mixed by crushing and grinding (Liu, 1993; Li and Xu, 1995). The results of a series of micro-
flotation experiments showed that the longer the QAS carbon chain, the stronger the collection capacity

DOI: 10.37190/ppmp/128183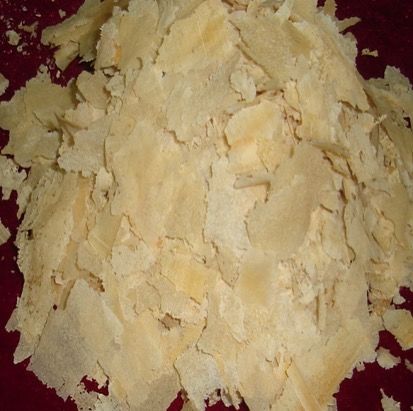
19                                                       Physicochem. Probl. Miner. Process., 57(1), 2021, 18-28

on quartz (Jiang et al., 2019). Besides, silicate bacteria were used to pretreat quartz for 3 days based on
the metabolites of microorganisms, organic acids and polysaccharides dissolve quartz. With the
increase of the surface dissolution area of quartz, the binding sites of quartz and dodecylamine
increased, thereby improving the collection effect of dodecylamine (Teng and Wang, 2020). Some
research on inhibitors of hematite and quartz were reported. For example, a new type of hematite
macromolecular inhibitor was synthesized with multiple carboxyl groups and amino groups-
polymaleic anhydride-triethylenetetramine (PMTA), and it exhibits a good depression performance
compared to starch (Zhang et al., 2017). Besides, maizena, soluble starch, amidex, and amylose were
used as inhibitors in the nano-emulsion system for micro-flotation of quartz and hematite. High
performance of hematite depression was obtained for all inhibitors (80%-90% depression), and all
depressants introduced into the nano-emulsion systems were efficient to promote depression of
hematite (Paula et al., 2019). Other studies suggested that the interaction between the Saccharomyces
cerevisiae (S.c.) with quartz and hematite caused obvious surface chemical changes. S.c. exhibited a
higher surface affinity toward hematite when compared to quartz. S.c. cell adhesion was significantly
higher on hematite, and quartz was rendered more hydrophobic, while hematite was more hydrophilic,
after biotreatment (Natarajan and Padukone, 2012). Meanwhile, magnetic separation is mainly used to
remove iron minerals in quartz ore and secondary pig iron mixed in crushing and grinding to improve
the quality of quartz sand (Zhao et al., 2005). In Zivko’s study, a high-gradient magnetic separation
process for removing Fe2O3 carriers from quartz raw materials was summarized through an
electromagnetic separator (magnetic field strength of 1120 kA/m) (Zivko et al., 2017). In Lv’s research,
pulsating high gradient magnetic separation (PHGMS) was used to effectively remove iron impurities
in quartz ore, and the iron removal rate is 89.82% (Lv et al., 2017). Since quartz is insoluble in acid
(except HF), acid leaching is often used to remove the iron film on the surface of quartz particles and
iron impurities. The dissolving speed of mica and feldspar is higher than quartz in HF solution,
therefore, HF can be used as the main chemical leaching agent for quartz purification (Zhou, 2005).
Research by Larsen et al (2019) showed that the purification of quartz in solutions containing mineral
acids (such as H2SO4) and sodium fluoride (NaF) was similar to the results of studies using hydrofluoric
acid (HF), and combining separate H and F sources instead of using HF alone enables lower fluorine
concentration. Li’s study proposed to replace the outdated industrial strong acid with a mixture
containing non-toxic renewable acid and very dilute HCl to simultaneously remove iron and aluminum
impurities in quartz sand, with the best removal rates reaching 79.1% and 42.3%, respectively (Li et al.,
2016). In a study by Tuncuk and Akcil (2014), the chemical leaching tests with different acids were
carried out to remove iron impurities from quartz ore, with the highest removal rate of 86.6%.
    With the over-exploitation and utilization of mineral resources, the reserves of high-grade quartz
ores in nature are drying up, and the demand for high-grade quartz is growing because of the progress
of science and technology, rapid development of high-tech industries such as optical communication,
thin-film materials, optical power supply, electronic industry, laser, aerospace, large-scale and ultra-
large-scale integrated circuits, military industry (Sun and Yin, 2001; Li, 2002). It is of great significance
to study the purification of low-grade quartz ores. There are many gangue minerals and some silicate
minerals in low-grade quartz ores, therefore the effect of removing impurity by magnetic separation
and conventional flotation methods with starch as depressant is poor, and it is difficult to achieve a
concentrate grade above 99%. Starch comes from food grain, and a lot of usage of starch has an
important impact on the national economy and people's livelihood. The acid leaching method has some
disadvantages such as high cost, serious equipment corrosion, and heating in some cases.
Microorganism has wide sources and is environmentally friendly. Using waste bacteria (WJ) as an
inhibitor of iron in silicon flotation is an effective and low cost, which can replace starch.
    In this study, the flotation experiments on a quartz ore obtained from Chaoyang City, Liaoning
Province, China was carried out to obtain an effective approach to purifying a low-grade quartz ore by
microbial flotation-acid leaching for comprehensive utilization of low-grade quartz resources.

2. Materials and methods
2.1. Materials
200 kg representative quartz ore sample of 0-300 mm was obtained from a mine in Chaoyang City, Liaoning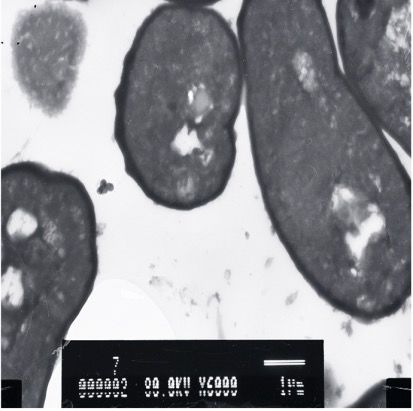
20 Physicochem. Probl. Miner. Process., 57(1), 2021, 18-28
Province, China. The sample was crushed in three stages. First, the sample was crushed using a jaw crusher
in an open circuit, and then, a roller crusher was used in a close-circuit. The crushed sample was well mixed
and subsampled for the chemical analysis as presented in Table 1.
Table 1. Chemical composition of quartz (wt%)
Composition SiO2 Fe2O3 Al2O3 CaO MgO TiO2 K2O Na2O
Content 97.18 1.80 0.34 0.28 0.04 0.09 0.16 0.11
As seen in Table 1, the main chemical composition in the quartz ore sample is SiO2 at 97.18%. The main
impurity composition is Fe2O3 with minor impurities of Al2O3, CaO, K2O, and Na2O. The main objective of
the experimental study was to remove iron and aluminum impurities and improve the content of SiO2 in the
quartz ore. Additionally, a representative sample of the quartz ore was selected to prepare for a light plate.
Typical images under a light microscope are shown in Fig. 1.
The main mineral in the ore was quartz accounting for about 97%, and a small amount of mica,
feldspar, pyroxene, and hematite existed in the ore. Quartz is often associated and inter-grown with
mica, feldspar, and hematite. There were some very small spots on the surface of quartz grains. Some
minerals dissipated in the quartz fracture, and some were embedded in the form of inclusions that
existed in the ore. It can be seen from Fig. 1 (b) that some minerals were mixed in the quartz fractures.
There are some connectives in the form of inclusions and gas-liquid intrusions of iron mineral (marked
with the letter C in red), which have adverse effects on removing from the quartz ore by flotation.
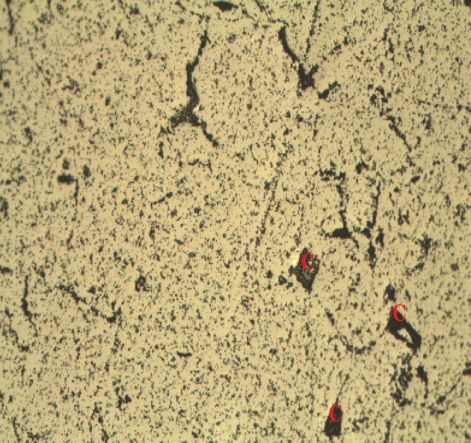
The industrial waste bacteria used in the test was taken from a beer factory in Shenyang and used as
a flotation inhibitor (WJ). Physical property and micromorphology are shown in Fig. 2.
It can be seen from Figs. 2 (c) and (d) that the WJ is oval, about 3 × 6 µm in size, and the cell wall is
visible, which is a microbial inhibitor. It was dead by testing.
Hydrochloric acid (HCl), sulfuric acid (H2SO4), nitric acid (HNO3), hydrofluoric acid (HF), Sodium
hydroxide (NaOH), and sodium oleate (NaOL) used in the experiments were purchased from the
reagent store. The name, specification, and manufacturer of the reagent are presented in Table 2
(a) (b)
Qz
C
Qz C
C
Fig. 1. Quartz ore images under a light microscope (a) the crystalloid structure of unequal granular and (b) enlarged
section in 400 magnification
(a) (b) (c) (d)
Fig. 2. The (a) macroscopic, (b) microscopic (at 1000 X), (c) scanning electron microscopy (SEM), and (d)
transmission electron microscopy (TEM) images of WJ21 Physicochem. Probl. Miner. Process., 57(1), 2021, 18-28
Table 2. Reagents used in the experiments
Chemical formula Specification Manufacturer
HCl Guarantee reagent (GR) Shenyang Xindong Reagent Factory, China
H2SO4 Guarantee reagent (GR) Shenyang Xindong Reagent Factory, China
HNO3 Guarantee reagent (GR) Sinopharm Chemical Reagent Co., Ltd.
HF Guarantee reagent (GR) Sinopharm Chemical Reagent Co., Ltd.
NaOH Analytical reagent (AR) Tianjin Hengxing Chemical Reagent Manufacturing Co., Ltd.
C18H33NaO2 Analytical reagent (AR) Tianjin Damao Chemical Reagent Factory, China
2.2. Methods
2.2.1. Flotation experiments
The combined process of flotation-acid leaching was used for the experiments. The flotation
experiments were performed using an XFD flotation machine with a 1000 cm3 flotation cell with a
stirring rate of 1800 rpm at room temperature. In the flotation experiments, 500 g sample was placed in
the cell with 800 cm3 tap water. The slurry was stirred for 1 min, and HCl and NaOH were used to
adjust the pH value of the suspension. Then, an additional stirring for 1 min, the adjuster was placed to
the cell and stirred for 5 min. The NaOL was added into the suspension, and it was agitated for 3 min,
and the flotation time was 3 min. After the flotation process, the products and tails were weighed and
laboratory analyzed after the filtering and drying processes, and the flotation recovery was calculated.
2.2.2. Leaching experiments
The acid leaching was performed using an XJT II leaching stir leaching machine with a 750 cm3 leaching
cell. The 400 g flotation concentrate was placed on the cell and adjusted the pulp concentration of 50%-
55% by adding tap water. The acid was placed and agitated 2 h. The flowsheet of the flotation and
leaching processes is shown in Fig. 3.
Fig. 3. Experimental flowsheet
2.2.3. Zeta potential measurements
The zeta potential measurements for the samples were carried out using the JS94H micro
electrophoresis instrument. First, the quartz and hematite samples were ground to -5 µm with a ZXM-
1 vibration mill. Second, about 0.5 g of the mineral sample was added into the WJ solution at desired
concentrations. Next, the pH value of the solution was adjusted with HCl or NaOH, and the suspension
was stirred for 5 min, and finally, then the measurements were performed. Each sample was measured
4-6 times, the interference number was removed, the remaining values were averaged.
2.2.4. X-ray photoelectron spectroscopy (XPS) analysis
X-ray photoelectron spectroscopy (XPS) analyses for the samples were performed at room temperature
in an ultra-high vacuum system with the surface analysis system (ESCALAB 250Xi/ThermoFisher). The22 Physicochem. Probl. Miner. Process., 57(1), 2021, 18-28 element distribution of WJ was analyzed by PHI Quantera SXM X-ray Photoelectron Spectroscopy (XPS) using an Ar+ sputtering gun at an acceleration voltage of 1 kV. 2.2.5. Scanning electron microscope (SEM) and Energy dispersive spectrum (EDS) analyses A small amount of powder WJ sample was taken and sprinkled it on the conductive glue of the clean Scanning electron microscope (SEM) sample stage, and Au was sprayed on the sample surface. The Zeiss-ΣIGMA HD scanning electron microscope of Germany was used for the analysis. When the sample was analyzed, the scanning voltage and current were adjusted according to the conductivity of the sample and Energy dispersive spectrum (EDS) spectrum. 2.2.6. Fourier transform infrared (FTIR) spectra First, the spectrally pure KBr background was collected, then the prepared sample was mixed to be with KBr in an appropriate ratio, pressed in the tablet, and put it into a Nicolet 380 FT-IR infrared spectrometer for the analysis. 3. Results and discussion The magnetic separation experiments were performed using an LHGC-500F Slon vertical ring high gradient Magnetic separator at a magnetic field intensity of 640 to 1600 kA/m due to the presence of hematite in the quartz ore. The content of Fe2O3 in the magnetic concentrate was 0.17% which was slightly lower than the content of Fe2O3 in the crude, indicating that the iron in the quartz ore was not effectively removed. The reason may be that the Fe2O3 in the ore was low, and the iron was closely associated with quartz. Therefore, the flotation experiments were carried out. 3.1. Flotation experiments The flotation process of quartz ore is similar to the reverse flotation of iron ore by depressing iron and floating silica. NaOL is commonly used as a collector of magnesite in the separation flotation of Mg and Ca, Si of magnesite ore, and the collector of quartz in the separation flotation of Fe and Si of iron ores or silica ores (Hao et al., 2018; Sun et al., 2020). CaCl2 is usually used as an activator for the separation flotation of iron and silica (Liu et al., 2013; Hao et al., 2018). Causticized starch is commonly used as an inhibitor for iron minerals in the separation flotation of iron and silica (Hao et al., 2018). The impurities in the quartz ore cannot be effectively removed by using many kinds of starch and many steps. The SiO2 grade of the concentrate is below 99% regardless of low recovery. The depressing effect of starch was dependent upon the carbon chain length, and the effect of amylopectin was better than that of amylose (Ma et al., 2006). The polysaccharides are the main composition of WJ, the molecular weight of polysaccharides in microbial is larger than that of starch in its complex structure, and contains more polar groups with inhibitory effect on iron minerals than starch (Bernard and Jack, 2005). Therefore, the industrial waste bacteria WJ was used as the depressant to iron in quartz flotation to improve the grade of quartz by removing impurities, which conclusion was similar to that of Natarajan et al (2012). 3.1.1. Effect of grinding fineness The influence of grinding fineness was investigated under the condition of pH 10, 2000 g/Mg WJ, 400 g/Mg CaCl2 as the activator, and 800 g/Mg NaOL as the collector. The results are shown in Fig. 4. As shown in Fig. 4, the SiO2 grade of the quartz concentrate increased initially and then decreased, the recovery decreased at first and then increased with the increase of grinding fineness. The optimum grinding fineness was 70% passing -0.074 mm in consideration of concentrate grade and recovery. 3.1.2. Effect of pulp pH 5% NaOH was used to adjust the pH value of pulp. The effect of pH was investigated under the condition of grinding fineness of 70%-0.074 mm, WJ dosage of 2000 g/Mg, CaCl2 dosage of 400 g/Mg, and NaOL dosage of 800 g/Mg. The results are shown in Fig. 5. As seen in Figure 5 that the concentrate grade increased at first and then decreased with the increasing pH. The concentrate grade was 99.87%
contains more polar groups with inhibitory effect on iron minerals than starch ( Bernard and Jack ,
2005). Therefore, WJ was used as the depressant of iron minerals to study the flotation purification of
23 Physicochem. Probl. Miner. Process., 57(1), 2021, 18-28
the quartz ore.
when the pH in pulp was 11.7. The recovery decreased slowly when the pH increased from 4 to 12. The
3.1.1 Testoptimum
of grinding fineness
pH was to be 11.7.
The influence of grinding
3.1.3. Effect of NaOLfinen ess was investigated under the condition of pH 10, 2000 g/t WJ, 400
dosage
g/t CaCl2The
as an activator,
effect and 800
of NaOL dosage wasg/t NaOL. under
investigated The results are shown
the condition in Fig.
of grinding 4. of -0.074 mm 70%,
fineness
pH 10, WJ dosage of 2000 g/Mg, and CaCl2 dosage of 400 g/Mg. The results are shown in Fig. 6. The
than that of concentrate
amylose grade
(Ma et al., 2006).
increased 100.0The
with polysaccharides
the increasing is the
NaOL dosage main
in the composition
range of WJ,
84 of 400-800 g/Mg, andmolecular
the
concentrate grade decreased
weight of polysaccharides with aisfurther
in microbial largerincrease
than of NaOL
that of dosage
starch over 800 complex
in its g/Mg. Thes recovery
tructure, and
always increased with the increasing NaOL dosage. The concentrate recovery
83 increased slowly when
contains more polardosage
the NaOL groupswaswith inhibitory
over 800 effect
g/Mg. The
99.5 on NaOL
optimum iron minerals
dosage wasthan starch
to be as ( Bernard and Jack ,
800 g/Mg.
2005). Therefore, WJ was used as the depressant of iron minerals to study
82
the flotation purification of
3.1.4. Effect of WJ dosage
Recovery/%
Grade/%
the quartz ore. 99.0
The effect of WJ dosage was investigated under the condition of grinding fineness of 70% -0.074 mm,
81
pH 10, CaCl2 dosage of 400 g/Mg, and NaOL dosage of 800 g/Mg. The results are shown in Fig. 7. As
3.1.1 Test ofshown
grinding fineness
in Fig. 7, the concentrate grade increased and the recovery decreased with the increasing WJ
98.5
dosage in the range of 500-2000 g/Mg. The concentrateGrade grade increased slightly,
80 while the recovery
The influence of grinding
decreased greatly finen essWJwas
with the dosageinvestigated under
over 2000 g/Mg. the condition
Recovery
Therefore, the optimum of dosage
pH 10,of2000
WJ wasg/t
2000WJ, 400
g/t CaCl2 asg/Mg, at this point, the concentrate grade was 99.88%, the yield was 85.74%, and the recovery was
an activator, and 800 g/t 98.0NaOL. The results are shown in Fig.79 4.
80.12%. The impurity removal rate55of flotation
60 65 was
70 96.33%.
75 80 85 90 95
Grinding fineness/(-0.074mm %)
100.0 84
Fig. 4. Influence of grinding fineness on quartz flotation
83
99.5
As shown in Fig. 4, the SiO2 grade of the quartz concentrate increased
82
initially and then decreased, Recovery/%
Grade/%
the recovery decreased at first and
99.0 then increased with the increase of grinding fineness. The optimum
grinding fineness was 70% passing -0.074 mm in consideration of concentrate
81 grade and recovery.
98.5
3.1.2 Test of pH in pulp Grade
Recovery
80
5% NaOH was used to adjust pH
98.0
55
value
60
of pulp.
65 70 75
The
80
influence
85 90
of
95
79 pH was investigated under the
condition of grinding fineness of 70%-0.074Grinding
mm, WJ dosage
fineness/(-0.074mm %) of 2000 g/t, CaCl 2 dosage of 400 g/t, and
NaOL dosage of 800 g/t. The results are shown
Fig. 4. Influence in Fig.
of grinding 5. on quartz flotation
fineness
Fig. 4. Influence of grinding fineness on quartz flotation
100.0 81.0
As shown in Fig. 4, the SiO2 grade of the quartz concentrate increased initially and then decreased,
99.5 80.5
the recovery decreased at first and then increased with the increase of grinding fineness. The optimum
grinding fineness was 70% passing99.0
-0.074 mm in consideration of concentrate
80.0
grade and recovery.
Recovery/%
Grade/%
98.5 79.5
3.1.2 Test of pH in pulp
98.0 79.0
5% NaOH was used to adjust pH value of pulp. The influence of pH was investigated under the
Grade
condition of grinding fineness of 70%-0.074
97.5
mm, WJ dosage
Recovery of 2000 g/t, CaCl 2 dosage of 400 g/t, and
78.5
NaOL dosage of 800 g/t. The results
97.0are shown in Fig. 5. 78.0
4 5 6 7 8 9 10 11 12 13 14
pH
100.0 81.0
Fig. 5. Influence of pH on flotation results
99.5 Fig. 5. Influence of pH on flotation
80.5results
99.0 80.0
Recovery/%
Grade/%
98.5 79.53.1.3 Test of NaOL dosage 98.5
Grade 77
Recovery
The influence of NaOL dosage was investigated under the condition of grinding fin eness of -0.074 mm
24 98.0
Physicochem. Probl.76Miner. Process., 57(1), 2021, 18-28
70%, pH 10, WJ dosage of 2000 g/t, and CaCl
400 2 dosage
600 of 400
800 g/t. The
1000 results are shown in Fig. 6.
Dosage of NaOL/(g/t)
100.0 81
Fig. 6. Influence of dosage of NaOL on quartz flotation
80
99.5
The concentrate grade increased with increasing NaOL dosage in the range of 400-800 g/t, and the
79
Recovery/%
concentrate grade decreased with further increase of NaOL dosage over 800 g/t. Th e recovery always
Grade/%
99.0
increased with increasing NaOL dosage. The concentrate recovery increased
78 slowly when the NaOL
dosage was over 800 g/t. The optimum NaOL dosage was 800 g/t.
98.5
Grade 77
Recovery
3.1.4 Test of WJ dosage
98.0 76
400 600 800 1000
The influence of WJ dosage was investigated under th e condition of grinding fineness of 70% -0.074
Dosage of NaOL/(g/t)
mm, pH 10, CaCl 2 dosage of 400 g/t, and
Fig. 6. NaOL
Influence dosage
of dosage of 800
of NaOL g/t. The
on quartz results are shown in Fig. 7.
flotation
Fig. 6. Influence of dosage of NaOL on quartz flotation
100.0 83
The concentrate grade increased with increasing NaOL dosage in the
82
range of 400-800 g/t, and the
concentrate grade decreased with further
99.5
increase of NaOL dosage over
81
800 g/t. Th e recovery always
increased with increasing NaOL dosage. The concentrate recovery increased
80 slowly when the NaOL
Recovery/%
Grade/%
dosage was over 800 g/t. The optimum
99.0 NaOL dosage was 800 g/t. 79
78
3.1.4 Test of WJ dosage 98.5 77
Grade
Recovery
The influence of WJ dosage was investigated under th e condition of grinding
76
fineness of 70% -0.074
mm, pH 10, CaCl 2 dosage of 400 g/t,
98.0
and500NaOL
1000dosage
1500 of 800
2000 g/t.2500
The 75results are shown in Fig. 7.
Dosage of inhibitor/(g/t)
100.0 83
Fig. 7. Influence of dosage of WJ on quartz flottion
Fig. 7. Influence of dosage of WJ on quartz flotation
82
3.2. Acid leaching experiments
99.5 81
As shownThe
in effect
Fig. 7,of removing impurity was better by flotation, but the concentrate grade was still lower than
th e concentrate grade increased and the recovery 80 decreased with increasing WJ
99.9%. The acid leaching experiment was performed under the condition of pulp concentration of 50%-
Recovery/%
Grade/%
dosage in the range
55%, of 500-2000
a temperature g/t.
of 80℃ using
99.0 The concentrate
a heating grade
jacket, the acid increased
leaching time79 of 2slightly,
h, and thewhile th e of
acid dosage recovery
40 kg/Mg
decreased greatly by the
with usingWJ
mixed acids over
dosage of H2SO4, HCl, HNO3, and HF in mass ratios of 20%, 30%, 20%, and
2000 g/t. Therefore, the optimum dosage of WJ was 2000
78
30% respectively. The sample after the leaching process was washed with water, filtered, and dried. The
results for the leaching process
98.5 on the quartz concentrate are presented in77Table 3. The concentrate grade
Grade
of quartz was 99.97%, and the recovery was 68.85%.Recovery The impurity removal rate of acid leaching was
76
2.93%.
98.0 75
500 1000 1500 2000 2500
Table 3. Chemical composition of quartz concentrate (wt%)
Dosage of inhibitor/(g/t)
Composition SiO2 Fe Al2O3
Content (%)Fig. 7. Influence of dosage of WJ on quartz
≥99.97 ≤0.01 flotation ≤0.01
Recovery (%) 68.85 — —
As shown in Fig. 7, th e concentrate grade increased and the recovery decreased with increasing WJ
3.3. Zeta potential measurements
dosage in the range of 500-2000 g/t. The concentrate grade increased slightly, while th e recovery
Zeta potentials of before and after the interaction between WJ and hematite or quartz were determined,
decreased greatly
and thewith
resultsthe
are WJ dosage
shown in Fig. over
8. 2000 g/t. Therefore, the optimum dosage of WJ was 200025 Physicochem. Probl. Miner. Process., 57(1), 2021, 18-28
The isoelectric point (IEP) of microorganisms reflects the charge balance between anionic and
cationic acid-alkali base groups, which is produced by cell surface components, such as lipopoly-
saccharide, lipoproteins, and bacterial surface proteins. According to the report of Bernard and Jack
(2005), the Point of Zero Charge (PZC) is pH=2.0-2.8 when the main component of the cell surface is
gluconic acid or other polysaccharides containing carboxy, while the PZC is pH≥3.2 when the main
compositions of cell surface are protein molecules rather than polysaccharides. As shown in Fig. 8, the
PZC of WJ was pH=2.6, the surface of WJ cells mainly consisted of gluconic acid or other
polysaccharides.
20
10
0
Zata potential /mV
-10
-20
-30
Hematite
-40
Hematite+WJ
-50 Quartz
-60 Quartz+WJ
WJ
-70
0 2 4 6 8 10 12 14
pH
Fig. 8. Zeta potential-pH profile of the hematite and quartz in the presence of WJ
The zeta potential of hematite increased in magnitude to a negative value with the increasing pH.
The IEP of hematite was 2.89, and the pH value was 10.49 when the negative value of the dynamic
potential of hematite was highest in magnitude. The zeta potential of hematite increased to a negative
value with the increasing pH after the interaction with WJ, and its IEP increased to pH=4.55. This
indicated that WJ could adsorb on the surface of hematite, and influence on the zeta potential of
hematite minerals.
The zeta potential on the surface of quartz increased to a negative value with the increasing pH. The
IEP of quartz was 1.81, and the pH value was 10.69 when the negative value of the zeta potential of
quartz was highest in magnitude. The zeta potential of quartz increased to a negative value with the
increasing pH after the interaction with WJ, and it's zero electric point marginally increased. As a result,
WJ showed no obvious effect on the zeta potential of quartz mineral. The adsorption function of
hematite-WJ was stronger than that of quartz-WJ.
3.4. Elemental composition, groups, and inhibition mechanism of WJ
The elemental composition of WJ was analyzed by X-ray photoelectron spectroscopy (XPS) and Energy
dispersive spectrometer (EDS), and the results are shown in Fig. 9 and Table 4. Additionally, the
chemical groups of WJ were analyzed by FTIR as shown in Fig. 10. According to Fig. 9(a), WJ surface
mainly consisted of C, N, O, Mg elements (also containing H element, which cannot be detected by
XPS), and a small amount of P and S. According to Fig. 9(b) and Table 4, WJ surface was mainly
composed of C, N, and O elements, and a small amount of P, S and Na elements (also containing H
element, which cannot be detected by EDS). K and Ca were detected in the suspension of WJ. The
elements of K and Ca cannot be detected by XPS and EDS for their small amount or distribution in the
cell.
As shown in Fig. 10, the broad strong peak at about 3417.6 cm-1 was assignable to the stretching
vibration absorption peak of the hydroxyl groups (a combination of OH and NH2 bands). Hydrogen
bond association existed in WJ because the peak of 3417.6 cm-1 was wider. The peaks at 2963.13 cm-1,
2926.29 cm-1, and 1454.36 cm-1 were CH3, CH2 stretching vibration absorption peak, and CH2 shearing
vibration absorption peak, and CH3 antisymmetric bending vibration absorption peak in the long
hydrocarbon chain, respectively. The absorption peak near 1654.36 cm-1 was the stretching vibration26 Physicochem. Probl. Miner. Process., 57(1), 2021, 18-28
peak of C=O and C-NH2 (amide I band). The peak near 1 540.7 cm-1 was the bending vibration peak of
band N-H and the stretching vibration peak of the C-N (amide II band). The peak near 1399.83 cm-1 was
the C-O stretching vibration of COOH in glucuronic acid and C-N-C stretching vibration of protein
(amide IV band). The peak at 1239.67 cm-1 would be the stretching vibration peak of C-N and P=O
stretching vibration (amide III band). The peak at 1041.7 cm-1 was C-O stretching vibration and S=O
stretching vibration peak in the sugar hydroxyl group. The peak at 567.36 cm-1 should be stretching
vibration absorption peak of thiophosphoryl P=, and stretching vibration absorption peak of P-O- (C)
(Wen et al., 2020).
80 600
[NewSamplel]
CKa
Mg2p
[Peak]
60 P2p 500
S2p
40 C1s
Atomic percent /%
400
N1s
20 O1s
Counts
300
6
200
4
PKa
MgKaNaKa
100
NKaOKa
SKa
2
0 0
0 100 200 300 400 500 600 0 2 4 6 8 10 12 14 16
Etch /s Energy /KeV
(a) (b)
Fig. 9. Elemental composition in WJ by (a) XPS and (b) EDS
Table 4. Elemental content in WJ by EDS (wt%)
Element C N O Na P S
Content (%) 43.067 25.803 26.649 1.009 2.097 1.374
8
0 3417.6,OH,NH2
1 2963.13,CH3,CH2
7 2 2926.29,CH3,CH2
3 1654.36,C=O,C-NH2
6 4 1540.70,N-H,C-N
5 1454.36,CH3,CH2
Transmittance /%
5 6 1399.83,C-O,COOH
7 1239.67,C-N,P=O
8 1041.70,C-O,S=O
4 9 567.36,P=,P-O-(C)
3
7
6
2 5
9
1 2
1 4 8
0 3
0
4000 3400 2800 2200 1600 1000 400
-1
Wavenumber /cm
Fig. 10. FTIR analysis of WJ
Caustic starch is the most commonly used inhibitor for iron minerals in the separation of iron and
silica by flotation. Starch is polymerized by a glucose molecule, that is, a polysaccharide. The main
elements in starch are C, H, and O. In general, the groups in causticized starch are C-O-C, CH2, COOH,
C=O, and OH (Zhu, 2005). Polysac-charide was the main component in WJ at a content of 50%-65%, and
the others were protein at a content of 20%-25%. WJ mainly consisted of the elements of C, H, O and N,
and Na, K, Ca, and Mg in traces. There were NH2, –C=O-NH–, P=O, and S=O in addition to groups of
C-O-C, CH2, COOH, C=O, and OH. FTIR results showed that NH2, –C=O-NH–, OH, and COOH
participated in the interaction of WJ with hematite, and NH2 was the strongest and COOH was the
weakest. The chemical interaction was the main action, and the hydrogen bond and static electricity
force existed (Liu et al., 2013).27 Physicochem. Probl. Miner. Process., 57(1), 2021, 18-28
4. Conclusions
The results obtained from this study indicated that WJ as industrial waste bacteria were an ideal
inhibitor for the quartz flotation to remove the impurities from a quartz ore. A concentrate grade of
99.88% at a recovery of more than 80% was achieved under the condition of the grinding fineness of
70% -0.074 mm, pH 11.7, CaCl2 dosage of 400 g/Mg, NaOL dosage of 800 g/Mg, and WJ dosage of 2000
g/Mg by one roughing flotation of rougher and two cleaning flotation on a quartz ore of 97.18% SiO2.
The concentrate grade of quartz was 99.97%, and the recovery was 68.85% after the acid leaching by
using mixed acid of H2SO4, HCl, HNO3, and HF in mass ratios of 20%, 30%, 20%, and 30%, respectively
under the condition of pulp concentration of 50%-55%, the temperature of 80℃, the acid leaching time
of 2 h, and the acid dosage of 40 kg/Mg in mixed acid as the leaching agent.
The zeta potential analysis showed that WJ showed good selectivity for hematite and quartz. SEM
and FTIR analysis of WJ showed that WJ was a microorganism, and its chemical composition was mainly
polysaccharide consisting of C-O-C, CH2, COOH, C=O, and OH groups as starch. Therefore, WJ could
be used as an inhibitor for iron in the separation of iron and silica flotation. WJ consisted of NH2, –C=O-
NH–, and other polar groups as well, therefore the inhibition effect of WJ in the iron minerals was
greater than that of starch. Additionally, WJ has more obvious advantages of abundance, low price, and
green compared with the starch because WJ is industrial waste, and starch comes from grain.
References
BERNARD, R.G., JACK, J.P., 2005. Molecular biotechnology. Chemical Industry Press, Beijing. 3.
GUO, J.S., GUO, C.S., 1975. Quartz glass. China Construction Industry Press, Beijing.
HAO, H.Q., LI, L.X., YUAN, Z.T., LIU, J.T., 2018. Molecular arrangement of starch, Ca2+ and oleate ions in the siderite-
hematite-quartz flotation system. Journal of Molecular Liquids. 254: 349-356.
JIANG, H., HAN, W.P., ZHAO, C., LUO, H.F., XIANG, G.Y., 2019. Adsorption behaviors and mechanisms of quaternary
ammonium salt collectors on quartz samples with different particle sizes. Colloids and Surfaces A: Physicochemical
and Engineering Aspects. 581.
LI, Y., XU, S., 1995. Mineral processing of quartzite and its deep process new technique. Conservation and Utilization of
Mineral Resources. (5), 23-26.
LIU, Y.C., 1993. Research on new technology and mechanism of flotation separation of feldspar and quartz. Northeastern
University, Shenyang. 85-95.
LI, H.P., 2002. Structure-performance of modified polymers and the mechanism for flotation of aluminum and silicate
minerals. Central South University, Changsha.
LIU, J.T., DAI, S.J., YANG, S.Y., LI, X.A., ZHOU, D.Q., 2013. Application of microorganism depressor in reverse flotation
of hematite ore for removal of silicate. Mining R & D. 33(5), 25-28.
LI, X.X., LI, T.H., GAO, J.X., HUANG, H.Q., LI, L.B., LI, J.S., 2016. A novel ‘‘green’’ solvent to deeply purify quartz sand
with high yields: A case study. Journal of Industrial and Engineering Chemistry. (35), 383-387.
LV, H.Z., PENG, Z., TONG, X., CHEN, L.Z., CHEN, Y.M., 2017. Pulsating high gradient magnetic separation for
purification of quartz. Physicochemical Problems of Mineral Processing. 53, 617-627.
LIU, W.B., LIU, W.G., WANG, B.Y., DUAN, H., PENG, X.Y., CHEN, X.D., ZHAO, Q., 2019. Novel hydroxy polyamine
surfactant N-(2-hydroxyethyl)-N-dodecyl-ethanediamine: Its synthesis and flotation performance study to quartz.
Minerals Engineering. 142, 105894.
LARSEN, E., KOWALCZUK, P.B., KLEIV, R.A., 2019. Non-HF collectorless flotation of quartz. Minerals Engineering.
133, 115-118.
MA, S.B., HAN, Y.X., YANG, X.SH., LI, Y.J., 2006. The effect of different kinds of starches on the flotability of hematite.
Nonferrous Mining and Metallurgy. 22(5), 23-25.
NATARAJAN, K.A., PADUKONE, S.U., 2012. Microbially induced separation of quartz from hematite using yeast cells
and metabolites. Minerals & Metallurgical Processing. 29(2), 81-87.
POTAPINE, C., 1954. Quartzite, vein quartz and sandstone. Geology Press, Beijing. 2-5.
PAULA, R.M.C.N., TEREZA, N.C.D., MOURA, M.C.P.A., ANTÔNIO, E.C.P., AFONSO, A.D.N., 2019. Depressants
in nanoemulsion systems applied to quartz and hematite microflotation. Journal of Materials Research and
Technology. 8(6), 5529-5535.
SUN, C.Y., YIN, W.Z., 2001. The principle of silicate mineral flotation. Science Press, Beijing, 312.
SUN, W.H., LIU, W.G., DAI, S.J., YANG, T., DUAN, H., LIU, W.B., 2020. Effect of Tween 80 on flotation separation of28 Physicochem. Probl. Miner. Process., 57(1), 2021, 18-28 magnesite and dolomite using NaOL as the collector. Journal of Molecular Liquids. 315, 113712, 1-8. TUNCUK, A., AKCIL, A., 2014. Removal of iron from quartz ore using different acids: A laboratory-scale reactor study. Mineral Processing & Extractive Metallurgy Review. 35(4), 217-228. TENG, Q., WANG, H., 2020. Effect of silicate bacteria on quartz flotation separation. Separation Science and Technology. (4), 1-9. WEN, Q.B., TENG, Q., YANG, Z.C., GUO, Y.J., LIU, S.Y., 2020. Effect and mechanism of causticized starch on flotation separation of magnetite and phlogopite. Conservation and utilization of mineral resources. 40(2), 62-69. ZHAO, H.L., ZHENG, S.Y., ZHANG, W.Q., 2005. Comparison of effects on removing iron from silica sand by different types of high magnetic intensity separators. Non-Metallic Mines. 28(3), 39-40. ZHOU, Y.H., 2005. Study on refining quartz powder by leaching in HF acid solution. Mineralogy and Petrology. 25(3), 23-26. ZHU, H.W., 2005. Spectrum analysis of organic molecule structure. Chemical Technical Press, Beijing. ZHANG, X.R., ZHU, Y.G., XIE, Y., SHANG, Y.B., ZHENG, G.B., 2017. A novel macromolecular depressant for reverse flotation: Synthesis and depressing mechanism in the separation of hematite and quartz. Separation & Purification Technology. 186, 175-181. ZIVKO, S., ZORAN, B., SLAVICA, M., MIROSLAV, I., LJUBINKO, S., VLADIMIR, J., DRAGANA, N., 2017. The choice of high gradient magnetic separation processes for removal of Fe2O3 carriers from quartz raw material. Gospodarka Surowcami Mineralnymi. 33(4), 93-106
You can also read