Coal quality prediction based on multi-feature fusion of flotation foam images
←
→
Page content transcription
If your browser does not render page correctly, please read the page content below
Coal quality prediction based on multi-feature fusion of flotation

                                         foam images
                                Yateng Bai and Xiaoping Ma
  School of Information and Control Engineering, China University of Mining and Technology,
                                    Xuzhou 221116, China
Abstract: Coal flotation monitoring cannot provide real-time feedback on the yield
and ash of coal preparation products because it is influenced by the subjective nature
of artificial judgment of coal preparation status and the lag of product quality testing
of coal preparation. This paper aims to extract the texture, colour and shape features
of floating foam images using various image processing methods, such as colour
space, wavelet transform, greyscale co-occurrence matrix and edge operator, and to
quantify the characterisation of various characteristic parameters on the basis of the
indicative effect of floating foam characteristics on the quality of coal preparation
products. The correlation between image features and the yield and ash of flotation
products is studied, and a regression prediction model of coal preparation yield and
ash was established by combining various image feature parameters using machine
learning methods. Experimental results show that the proposed method can realise the
real-time monitoring of coal mine flotation and effectively predict coal quality.

1. Research background
       Flotation foam is an indispensable intermediate state variable in coal preparation, and the
yield and ash of coal preparation products can be directly predicted by observing their shape,
colour and bubble size. With the rapid development of computer and image processing
technologies, flotation foam images can be automatically replaced with machine vision to monitor
the flotation in real time by extracting the characteristic parameters of foam image and to
accurately predict the yield and ash content of coal preparation products[1-3].
       In mineral processing, based on the analysis of the shortcomings of the existing flotation
production process, Hu et al.[4] proposed an optimization method of the flotation process based on
image processing, and described the main theories and solutions adopted by the academia in this
field through the research results of three specific processes, including image pre-processing, foam
feature extraction and production relationship model. Liang et al.[5] used the method of wavelet
change to extract the equivalent size feature, and then took the feature as the basis, used clustering
to classify the image, and improved the accuracy of the flotation foam image recognition. Liang X
M et al.[6] used the Canny edge detection to extract the parameters of the bubble edge coordinates.
According to the coordinate calculate parameters such as bubble area, perimeter, and centre
position and convert to physical parameters. Tian et al.[7] obtained a good segmentation effect on
coal slime flotation using a watershed algorithm. Chen et al.[8] applied a colour co-occurrence
matrix to the texture feature extraction of flotation foam image. Considering that making coal
slime flotation froth is frequently disturbed by different noises, Ning et al.[9] proposed an
open-close reconstruction area filtering method to increase the area of structural elements for
meeting the requirement of preserving image features during image segmentation.
       In the field test process, to extract the dynamic characteristics of the froth layer in mineral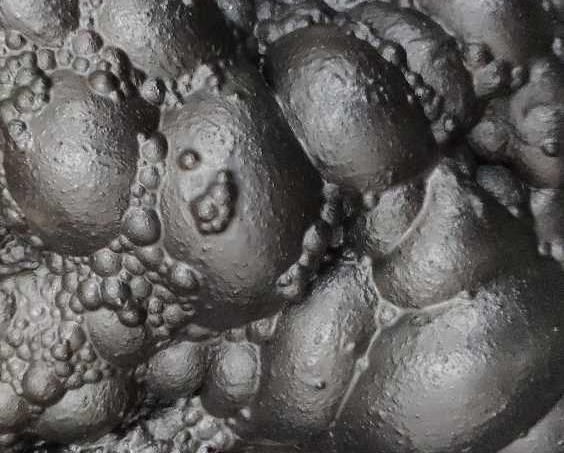
flotation process, a measuring method based on the change feature detection of the bubbles
regions between the adjacent frames was proposed by Chen et al.[10] . Support vector machine
(SVM) was introduced to make the measurement problem into a classification problem. The field
test results showed that the proposed method can detect the dynamic events of bubbles
successfully. The classifier can give judgments of bubble stability based on the feature variation
with quantitative measurement values. Xie Peihong et al.[11] proposed a segmentation model based
on machine vision to solve the noise interference and bubble adhesion problems frequently
encountered in foam images during coal slime flotation. Their proposed model has been applied to
laboratory research and has achieved good results. Hosseini et al.[12] combined image analysis
with neural network technology, established a characterisation model of the relationship between
flotation foam size and flotation performance, and proposed a watershed algorithm based on
adaptive markers, which is suitable for the segmentation of foam images and the measurement of
bubble size under different operating conditions. The experimental results showed that the average
size of bubbles immensely affects the system performance of flotation[12].
       Coal flotation increases the coal quality by adding flotation agents to the coal slurry, filling
the air and stirring to form a foam containing coal-powder particles. In the current flotation
process, the monitoring of floating operation status through artificial observation is susceptible to
subjective factors and the lag of coal preparation results cannot determine the flotation
performance in real time[13]. The texture, colour and shape of flotation foam image are strongly
related to the yield and ash of flotation products. This paper mainly studies the application of
image processing and machine learning methods in coal flotation, including automatic extraction
and quantification of foam image features, and establishes a correlation model between image
features and coal quality to realise real-time and effective monitoring of coal flotation.

2. Flotation foam image processing and prediction
      This method first extracts the three features of foam image, namely, texture, colour and
shape characteristics, uses regression methods in machine learning to train the coal prediction
model of the foam image, and inputs the flotation test image into the trained prediction model for
obtaining the corresponding yield and ash indicators, as shown in Figure 1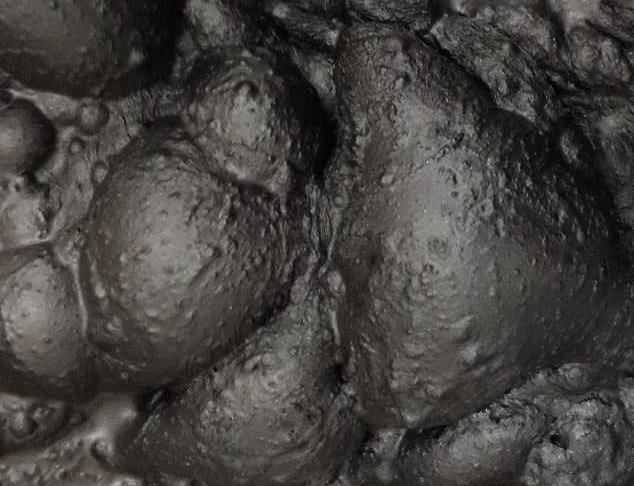
Texture                clean coal
                                   features             production/ash
                                                          M ea c hi n e
          Training                  Color
                                                          l ea r ni n g
           images                  features
                                                          t r a i ni n g
                                    Shape
         Training                  features
          phase

          Testing                  Texture
           phase                   features

                                    Color               Coal preparation        Coal quality
         Test images
                                   features             prediction model         prediction

                                    Shape
                                   features

                     Figure 1 The flowchart of foam image coal quality prediction

     2.1 Foam image feature description and extraction
      Considering the coal quality and its corresponding flotation foam image bubble size, foam
particle content, foam particle thickness degree, foam ash, foam viscosity and other factors, the
following correlations can be referenced in accordance with the experience of artificial flotation.
Foam ash content is related to the colour information, the thickness of particles in the foam is
related to the shape information, and foam viscosity is related to the texture information. This
paper uses the characteristics of colour, shape and texture to analyse the foam image. The overall
description of image features containing 72 features is shown in Table 1.
                                  Table 1 Image feature description
    Feature type          Feature name         dimension              Feature discription
                                                   5          Hue, saturation average and variance,
                        HSV characteristics
                                                                           and brightness
   Color features          Color richness          1                   Complexity of color
                                                   11           The proportion of 11 colors in the
                            Color name
                                                                               image
                         Wavelet transform         12                  Spatial granularity
                          Tamura features           3                   Image roughness
                                                   12             Contrast, correlation, energy,
                          GLCM features
                                                                uniformity of each HSV channel
  Texture features                                 24             Image naturalness, openness,
                           GIST features
                                                               roughness, dilation, and ruggedness
                         Gray distribution         1             Image entropy, measure image
                              entropy                                       uniformity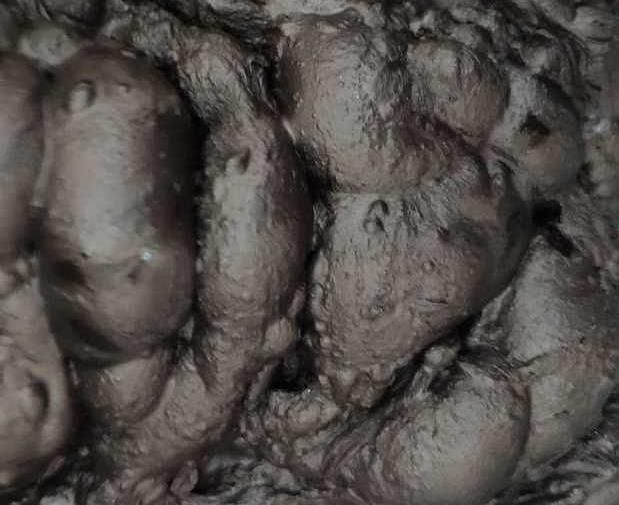
1        The proportion of border pixels on the
                            Border pixels
                                                                              image
                                                     1             Number of image areas after
   Shape features          Level of detail
                                                                           segmentation
                                                     1          The average size of the segmented
                            Average area
                                                                              image

2.1.1 Colour feature
      Colour feature is an important feature of foam images, and the colour change in foam image
reflects the content of ash although its colour information is relatively a single natural image. This
paper uses the three characteristics of hue, saturation and value (HSV) colour space statistical
features, colour richness and colour name to characterise the colour information of the foam.

                    High ( 0.48 )                                     Low ( 0.14 )
                                      (a) Colour brightness

                    High ( 0.19 )                                     Low ( 0.04 )

                                            (b) Color purity
                           Figure 2 Comparisons of image brightness and purity
     (1) Statistical features of HSV colours: The HSV colour space of an image consists of three
channels, namely, hue (H), saturation (S) and value (V). The information about the colour diversity
of an image can be obtained by extracting the circular variance of the H channel R[13], and the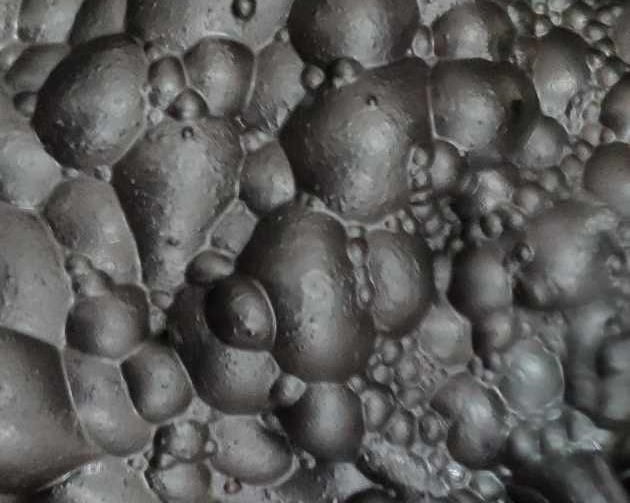
calculation process is expressed as:
                                                                                              (1)

                                                                                               (2)

where       indicates the pixel value of        in the position on the image H channel, and     and

   represent the image width and height, respectively. The average and standard deviation on the S
and V channels of the image are calculated. The average saturation represents the colour purity, the
average on the V channel is called the colour brightness, and the colour purity and brightness of
flotation foam image are highly correlated with the ash content of coal (as shown in Figure 2). The
average of hues is not calculated because the hue averages cannot be associated with intensity
attributes (low, high), and intensity attributes are measures of angle.

                 Low ( 0.14 )                                       High ( 0.17 )
                                           Color richness
                           Figure 3 Comparisons of the image color richness

      (2) Colour richness: This feature distinguishes a multicolour image from a monochrome,
dark grey and low-contrast image. According to literature [14], an image is firstly transformed into
the CIELUV colour space, the colour histogram of the image is calculated, and the resultant colour
histogram is compared with the colour histogram of an ideal image to obtain the colour richness
characteristics of the image, as shown in Figure 3. The colour in the ideal image is evenly
distributed, that is, each piece of data in its colour histogram is equal.
      (3) Colour name: Each pixel of an image can be classified into one of the following
categories through classification, including black, blue, brown, gray, green, orange, pink, purple,
red, white and yellow. The sum of pixels in the above categories illustrates the probability of
colours appearing in the image and the colour statistics in flotation foam images. This paper uses
the proposed method in literature [15] to classify each pixel in the bubble image, simulates the
manner in which human beings label colour information in the image, and obtains the ratio of the
number of pixels in each class with the total number of images as a colour name feature.

2.1.2 Texture feature
     Textures are spatial arrangements of intensity and colour in an image, where texture captures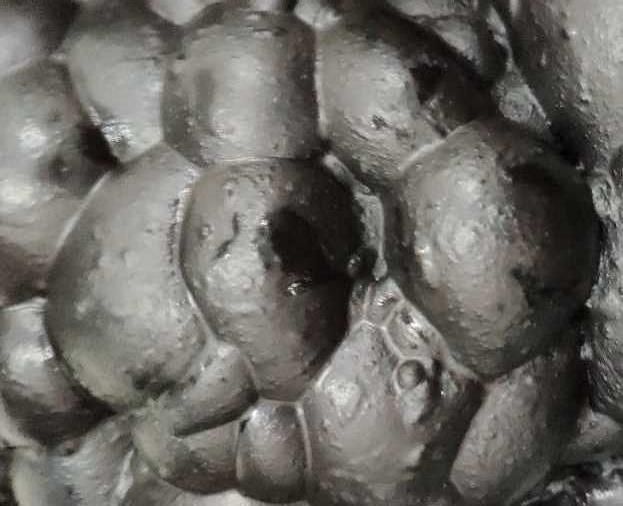
perception (such as more pronounced in sharp images than in blurred images) and provide
information about the subject of the image (such as the texture complexity and symmetry of the
image reflecting its content). The image texture complexity of flotation foam can reflect the
characteristics of foam size, roughness and viscosity, which is correlated with the flotation coal
quality index. Therefore, the texture characteristics of wavelet transform, Tamura feature,
grey-level co-occurrence (GLCM) feature, GIST feature and greyscale distribution entropy are
used to describe the texture characteristics of a foam image.

                                                                            LL1   LH1
                                         LL1         LH1                                  LH2
      Original                                                              HL1   HH1

       image
                                         HL1         HH1                      HL2         HH2

                      Figure 4 Wavelet transform decomposition process of image

       (1) Wavelet transform: Wavelet transform can measure the spatial smoothness and
granularity of images[16]. A 2D discrete wavelet transform (2D-DWT) is developed to analyse the
frequency components of the image, where the high-frequency portion can be intuitively linked to
high edge density. The output of 2D-DWT consists of multilevel wavelet transforms (as shown in
Figure 4), where each of them corresponds to a certain frequency of the original image. In the
first-level transform decomposition, the image is divided into four parts, each with a quarter of the
size of the original image, and the upper-left corner is marked as LL, indicating the low-pass part
of the image. The three remaining parts are marked as vertical LH, horizontal HL and diagonal
HH, representing the vertical, horizontal, and diagonal edge information of the image, respectively.
A deep transform feature can be obtained by performing wavelet transform again on the
decomposed LL part. In this paper, the three HSV channels of the foam image are three-level WT,
and each level takes three features to represent the edge of the image, which are         ,      and
    (           ), where          ,          and             represent the horizontal, vertical and
diagonal edge information of the image. Thus, the texture feature definition of WT shown in
Equation 3 includes nine features (three levels for each of the three HSV channels).

                                                                                                  (3)

      Considering the span of pixel            on a single     spatial domain and the space area of
     for a single channel, that is, WT for each colour space channel, the three other characteristics
are extracted by calculating the sum of average wavelet coefficients of each HSV channel at all
frequencies. A total of 12 features are obtained.
      (2) Tamura feature: Literature[15][17] presents the three important texture characteristics,
namely, roughness, contrast and directivity related to human visual perception. This paper extracts
the characteristics of the three aspects of the foam image.
      Suppose that            represents the greyscale portion of the foam image, the average in the
neighbourhood of each pixel is first calculated, with the field’s size being a power of two
(                                  ). The calculation formula is expressed as follows: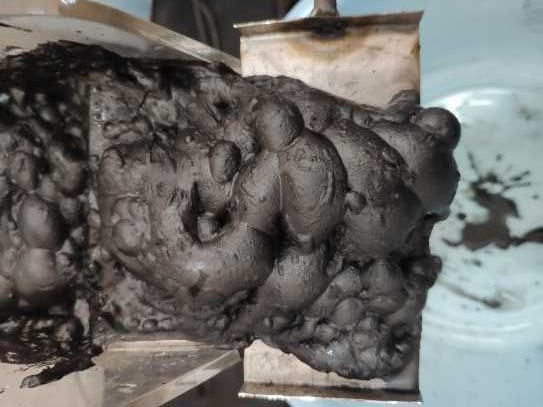
(4)

      Secondly, calculate the difference between the areas where the corresponding position of the
point does not overlap in the horizontal and vertical directions for each pixel         , and the
calculation formula is expressed as follows:
                                                                                               (5)
                                                                                               (6)
      Then, select the largest difference for each pixel:
                                                                                               (7)
      Finally, the roughness is calculated:

                                                                                               (8)

where      represent the width and height of image        , respectively.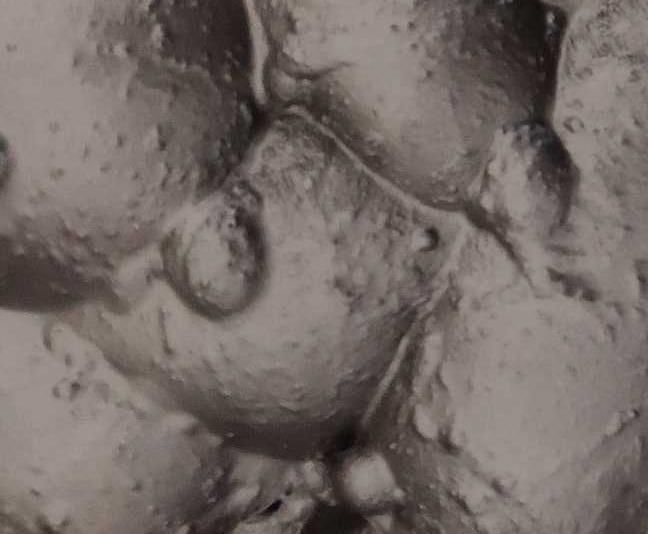
Low ( 4.13 ) High ( 4.79 )
(a) Roughness
Low ( 0.0038 ) High ( 0.0324 )
(b) Contrast
Low ( 0.2235 ) High ( 0.3156 )
(c) Directionality
Figure 5 Comparison of the image Tamura feature
The contrast of the image represents the texture quality, which is calculated as follows:
Fcon = ,4 = 4 (9)
42
4
where is the fourth-order of the average of image pixels ,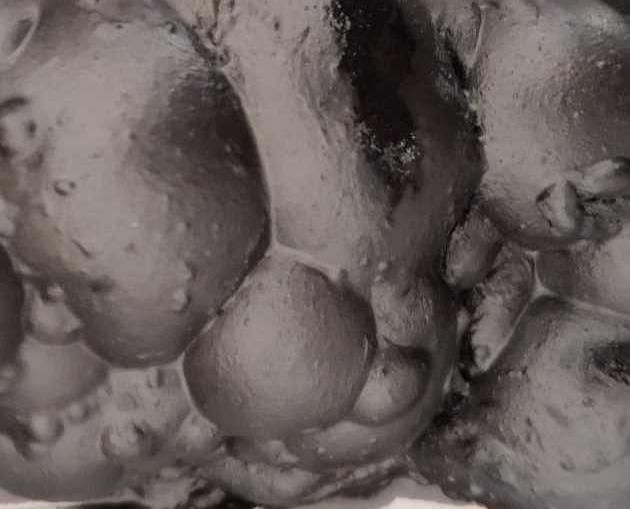
is the variance of image pixels, and     is the coefficient    . In practice, the contrast of the image is

affected by the greyscale range and the polarisation of the black-and-white distribution on the
greyscale histogram.
      The directivity of the image simulates the polarisation distribution in the edge direction, and
the high directivity represents the even texture in the edge direction, and vice versa. First, Entropy
   of all the edge pixel situ distribution stakes in the image is calculated, and then the
directionality of the image is obtained by                  . The edge of the image has a high
directionality along a single direction when          is zero . Conversely, the image has evenly
distributed direction and has a low orientation when        is one. Figure 5 shows a comparison of
the Tamura features of the image.

       Low (0.085)             High (0.264)                   Low (0.361)              High (0.862)
           (a) Contrast ( V channel )                             (b) Energy ( S channel )

      Low (0.835)              High (0.953)                   Low (0.928)              High (0.998)
         (c) Correlation ( H channel )                           (d) Uniformity ( H channel )
                         Figure 6 Comparison of GLCM features of images
      (3) GLCM Features: A GLCM is a matrix, where element              is the probability        of
positions and in the same region W. It is a broad texture analysis method used under the
premise that the spatial distribution relationship between the pixels in the image contains the
image texture information[18]. The four GLCM statistical characteristics of the HSV colour
channel for calculating the foam image are contrast, energy, correlation and uniformity.
      The darker the texture groove of the image is, the higher the clarity will be, and contrast is
expressed as:
                                                                                               (10)
where     indicates the number of pixels.
      The energy reflects the relationship between the uniformity of the greyscale distribution of
the image and texture thickness. The GLCM feature element values are approximately equal,
indicating that the energy is small, the texture is detailed, and vice versa. The expression is:
                                                                                                 (11)
      Correlation reflects the similarity between the greyscale of an image in horizontal and
vertical directions, and the size of its value determines the similarity between greyscale
correlations, which can be expressed as follows: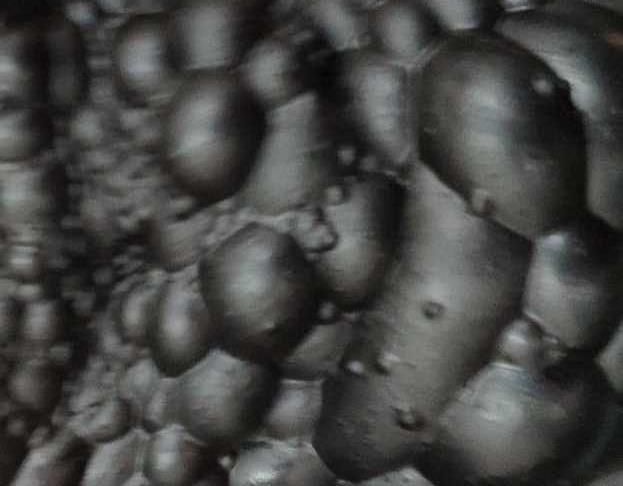
(12)

where                     ,                                                      .
      Uniformity is the frequency where adjacent pixels have the same value, and the feature value
is large when the greyscale symbiotic matrix is diagonally large, as shown in Figure 6 (d). The
calculation formula is expressed as follows:

                                                                                                (13)

     (4) GIST Features: Represent a low-dimensional scene that captures a set of perceived
dimension characteristics, which are naturality, openness, roughness, dilation and severities
through a Gabor filter[19].

                 Low (3.61)                                          high (4.91)
                                  Gray distribution entropy
                         Figure 7 Comparison of image gray distribution entropy
      (5) Greyscale distribution entropy: The entropy of an image is a characteristic used to
measure image uniformity. The foam image is converted to greyscale, the greyscale distribution
(that is, the greyscale histogram of the block) is calculated for each pixel in the areas of pixels
      , and the distribution entropy is calculated. All entropy values are summed and divided by
the size of the image to obtain greyscale distribution entropy. The more uniform the intensity of
the image is, the lower the entropy will be. Suppose that      is the probability that the difference
between two adjacent pixels in the image is equal to , and the calculation formula for the
greyscale distribution entropy is expressed as follows, as shown in Figure 7.
                                                                                                 (14)

2.1.3 Shape features
      Image shape features refer to the shape composition of visual elements in an image
regardless of their actual content. Image shape features are used to describe the size and density of
bubbles produced by the foam image, and the foam thickness in the image is measured. This paper
describes the characteristics of the foam image using three characteristics, namely, boundary pixel,
detail degree and average area.
      (1) Boundary pixels: The shape of the image largely depends on the edge, that is, the point at
which the brightness of the image shows discontinuity. Therefore, the boundary pixel feature
detects the edge of the foam image using the Canny operator[20] and calculates the ratio of the
number of pixels at the edge to the total number of pixels in the image.
low (segmented area = 224,area size = 0.446) high (segmented area = 9082,area size = 0.011)
Figure 8 Details of the image and the average area zone size
(2) Detail level and average area: Images can be split into multiple areas, that is, pixel sets
that share common visual features. In this paper, the image is split using an average shift
algorithm[21], and two characteristics are extracted: The number of segmentations indicates the
number of image segments. The standardised average expansion of the segmented area is the ratio
of the average area to the total area of the divided area. The more the details are, the more
fragments are split, as shown in Figure 8.
2.2 Coal property prediction
Machine learning has become a branch of artificial intelligence. We can fully exploit the
inherent rules of provided data and predict the state of unknown data. Machine learning is mainly
divided into supervised and unsupervised learning. This paper aims to reveal the relationship
between the colour, texture and shape characteristics of foam images and the corresponding coal
ash fractions. Thus, supervised machine learning is adopted.
Figure 9 shows the model training through supervised learning, where the training data are
marked as training. Supervised learning can predict unknown data using tag training data to build
models. In this paper, the coal preparation production and ash prediction models of flotation foam
images are trained using support vector machine (SVM) and random forest (RF).Prediction
results
Meachine
Training
learning Model
data
methods
Unknown
data
Figure 9 Supervised learning method flow
3 Experiment analysis and result discussion
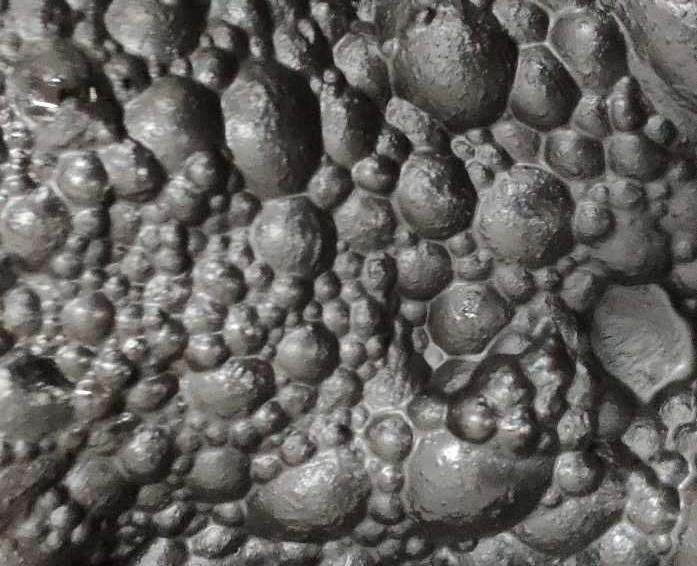
To obtain the foam image of flotation experiment under different circumstances,
the proposed method selects 65 sets of flotation experiments to collect foam images
under different conditions of floating concentration, capture agent dosage, foaming
agent dosage and material particles, and each set of flotation experiments collect foam
images using a digital camera and is set to continuous photography mode. The
flotation experimental environment is set in a dark room, and the uniformity of light is
ensured through monochrome light lighting. The images collected in each group of
experiments are 25, and four experimental indicators, namely, clean coal yield, clean
coal ash, tailing coal yield and tailing coal ash, in each experiment are obtained from
ash burning treatment:. Figure 10 shows the four images taken under different
flotation conditions.Figure 10 Four images from different flotation experiments
The analysis of foam image is mainly concentrated in the bubble area. Clear
images taken in each set of flotation experiments and five complete bubbles as feature
images for analysis are selected, and the bubble area of the foam image is intercepted
to eliminate the effect of non-bubble area on the foam image. A total of 325 images
are obtained from the 65 flotation experiments, and the foam images under different
flotation experiments and the corresponding coal sample yield and ash are analysed.
The characteristics of flotation foam images are extracted, and the predictive model of
coal sample yield and ash is established through machine learning.
In the experiment, 65 experimental images are randomly divided into 80%
training sets and 20% test sets, and the average result of 100 repetitions is obtained as
the final result. Pearson linear correlation coefficient (PLCC), root mean square error
(RMSE) and Spearman rank-order correlation coefficient (SROCC) are used as the
main reference for judging forecast performance, where PLCC and RMSE indicate
predictive accuracy, and SROCC indicates predicted monotony; the higher the PLCC
and SROCC are, the better the RMSE will be. The experimental results are shown in
Table 2, and the training results of SVM are better than those of RF. The prediction
results of the three forecast targets can reach approximately 0.75 in terms of
prediction accuracy, showing a strong correlation. The prediction results of the three
forecast targets can reach more than 0.65 in terms of predicted monotony, showing a
strong correlation.
Table 2 Prediction results of production and ash
Predict target Evaluate SVM RFmatrics
clean coal PLCC 0.7493 0.7365
SROCC 0.6538 0.6923
production
RMSE 0.0481 0.0450
PLCC 0.7519 0.7341
clean coal ash SROCC 0.6841 0.6868
RMSE 0.0458 0.0475
PLCC 0.7769 0.7375
tailing coal ash SROCC 0.6841 0.6786
RMSE 0.0453 0.4860
This paper uses three characteristics of colour, texture and shape to train and test the three
prediction targets and divides 65 sets of experimental images into 80% training sets and 20% test
sets to verify the role and contribution of the three characteristics of the three prediction targets
(clean coal yield, clean coal ash and tailing coal ash). Using PLCC and SROCC results on the test
set as performance indicators, the average result of 100 repetitions is taken as the final result.
Table 3 Prediction results of production and ash based on three different characteristics
Features Predict target PLCC SROC
C
Color features clean coal production 0.6854 0.5648
clean coal ash 0.7125 0.6378
tailing coal ash 0.6872 0.6224
Texture features clean coal production 0.7247 0.6343
clean coal ash 0.6941 0.6188
tailing coal ash 0.6756 0.6127
Shape features clean coal production 0.7162 0.6098
clean coal ash 0.7065 0.6216
tailing coal ash 0.7542 0.6573
As shown in Table 3, the experimental results of the best predictive performance of each
feature are shown in bold, and the results show that different types of features immensely differ in
the predictive performance of the three prediction targets. The colour characteristics have the best
prediction effect on clean coal ash, indicating that the colour of flotation foam image can capture
the characteristics of clean coal ash and proving that ash content and colour information have a
strong correlation. The texture feature has the best prediction performance on the production of
clean coal, showing that the texture feature of flotation foam image can better represent the
roughness and uniformity of the image, indirectly reflecting the bubble viscosity during its
emergence and representing the different characteristics of flotation foam under different clean
coal production conditions to achieve better prediction performance. The shape feature has the
best predictive performance on tailing coal ash, showing that the shape feature of the emerging
foam image is correlated with tailing coal ash. Although the use of a single feature can provide a
better predictive performance to the three prediction targets, the three characteristics have a
comprehensive description of the foam image. Therefore, this paper uses the fusion of the three
characteristics to predict clean coal production, clean coal ash and tailing coal ash to achieve abetter forecast performance.
4 Conclusions
This paper analyses the correlation between the characteristics of foam image and coal yield
and ash and provides a yield and ash prediction method of flotation foam image based on
multi-feature fusion. After extracting the characteristics of colour, texture and shape of the foam
image, the foam image can be described, and the different characteristics of coal mass with
different yields and ash fractions can be captured during flotation process to predict the yield and
ash fraction of coal preparation. Sixty-five sets of flotation experiments are designed to verify the
validity of the proposed method. Experimental results show that this method can predict the yield
and ash content of the image during flotation and verify the effects of foam image characteristics
on yield and ash during flotation, providing an effective guiding role in the production and ash
prediction during floatation.
Reference:
[1] Ma A L, Xu D G, Xie Y F, et al. Analysis of dynamic texture features of floatation froth
images based on space-time characteristics of complex networks[J]. CIESC Journal, 2017,
68(03):1023-1031.
[2] Zhong Y G, Shi X J, Chen F, et al. Research status and development of application of
machine vision technology in coal washery[J]. Mining & Processing Equipmen, 2017, 45(07):
57-59.
[3] Liang X M, Liu W T, Niu F S, et al. Research on Measurement of Volumen and Surface Area
of Flotation Bubbles Based on Machine Vision[J]. ACT OPTICA SINICA, 2018, 38(12):
271-278.
[4] Hu D X, Zhang B Y. Optimization of flotation process based on image processing[J]. Mining
Technology, 2020, 20(02): 121-124.
[5] Liang L L , Gao N. A Study on Image Feature Extraction of Copper Flotation Foam on
Wavelet Theory[J]. CHINA' s Manganese Industry, 2018, 36(01): 118-121.
[6] Liang X M, Liu W T, Niu F S, et al. Extraction of the morphological parameters of flotation
bubbles based on Canny operator[J]. CHINA Mining Magazine, 2018, 27(08): 126-130.
[7] Tian L L, Lu Z. Research on image segmentation method of complex mixed flotation foam[J].
Shanxi Coking Coal Science & Technology, 2019, 43(12): 4-7+16.
[8] Chen N, Lin X, Gui W H, et al. Flotation froth image texture extraction based on CCHS[J].
Journal of Central South University (Science and Technology), 2013, 44(11): 4506-4512.
[9] Ning Z. A Segmentation Algorithm of Copper-molybdenum Mine Flotation Froth Image[J].
Computer Knowledge and Technology, 2014, 10(12): 2875-2877.
[10] Chen L Q, Wang W X. Bubble stability measurement based on froth surface feature variation
and support vector machine[J]. Journal of China University of Minning & Technology, 2018,47(03): 652-661.
[11] XIE Peihong, XU Shoukun, LU Zhaolin, et al. Image segmentation method of slime
floatation foam image based on machine vision[J]. Clean Coal Technology, 2015, 04: 42-45.
[12] Hosseini M R, Shirazi H H A, Massinaei M, et al. Modeling the Relationship between Froth
Bubble Size and Flotation Performance Using Image Analysis and Neural Networks[J].
Chemical Engineering Communications, 2015, 202(7): 911-919.
[13] Zhang Y H, Li M, Hao Q, et al. Study on the Flotation Effect of Rare Earth Concentrate for
Different Grain Size with Different Dosage of Collector[J]. Modern Minning, 2019, 35(12):
130-132+157.
[14] Datta R, Joshi D, Li J, et al. Studying aesthetics in photographic images using a
computational approach [C]//European Conference on Computer Vision. Graz, Austria, 2006:
288-301.
[15] Machajdik J, Hanbury A. Affective image classification using features inspired by
psychology and art theory [C]//Proceedings of the 18th ACM International Conference on
Multimedia. ACM, 2010: 83-92.
[16] Zhai Y. Image Enhancement Technology Based on Wavelet Transform and Gamma
Transform.[J]. Journal of Xi'an University ( Natural Science Edition), 2019, 22(06): 41-44.
[17] Gao Y, Song H, Zhang Z J. Calculation Method of Iris Structure Density Based on Tamura
Features[J]. Computer Technology and Developmen, 2016, 26(03): 36-39.
[18] Usha R, Perumal K. SVM classification of brain images from MRI scans using
morphological transformation and GLCM texture features[J]. International journal of
computational systems engineering, 2019, 5(1):18-23.
[19] Bin Li, Fuqiang Sun, Yonghan Zhang. Building Recognition Using Gist Feature Based on
Locality Sensitive Histograms of Oriented Gradients[J]. Pattern Recognition and Image
Analysis, 2019, 29(2):258-267.
[20] Lovato P, Perina A, Sebe N, et al. Tell me what you like and I’ll tell you what you are:
discriminating visual preferences on Flickr data [C]//Asian Conference on Computer Vision.
Daejeon, Korea, 2012: 45-56.
[21] Comaniciu D, Meer P. Mean shift: A robust approach toward feature space analysis [J]. IEEE
Transactions on Pattern Analysis and Machine Intelligence, 2002 (5): 603-619.You can also read


