Deep Learning Automated System of Thermal Defectometry of Multilayer Materials
←
→
Page content transcription
If your browser does not render page correctly, please read the page content below
Приборы и методы измерений                                                                  Devices and Methods of Measurements
2021. – Т. 12, № 2. – С. 98–107                                                                    2021, vol. 12, no. 2, pp. 98–107
A.S. Momot et al.                                                                                                 A.S. Momot et al.

Deep Learning Automated System of Thermal Defectometry
of Multilayer Materials
A.S. Momot, R.M. Galagan, V.Yu. Gluhovskii
National Technical University of Ukraine
"Igor Sikorsky Kyiv Polytechnic Institute",
Peremohy Ave., 37, Kyiv 03056, Ukraine

Received 12.03.2021
Accepted for publication 15.05.2021

Abstract
     Currently, along with growth in industrial production, the requirements for product quality testing are
also increasing. In the tasks of defectoscopy and defectometry of multilayer materials, the use of thermal non-
destructive testing method is promising. At the same time, interpretation of thermal testing data is complicated
by a number of factors, which makes the use of traditional methods of data processing ineffective. Therefore,
an urgent task is to search for new methods of thermal testing that will automate the diagnostic process and
increase information content of obtained results. The purpose of article is to use the advances in deep learning
for processing results of active thermal testing of products made of multilayer materials and development
of an automated system for thermal defectoscopy and defectometry of such products.
     The proposed system consists of a heating source, an infrared camera for recording sequences
of thermograms and a digital information processing unit. Three neural network modules are used for
automated data processing, each of which performs one of the tasks: defects detection and classification,
determination of the defect depth and thickness. The software algorithms and user interface for interacting
with system are programmed in the NI LabVIEW development environment.
     Experimental studies on samples made of multilayer fiberglass have shown a significant advantage of the
developed system over using traditional methods for analyzing thermal testing data. The defect classification
(determining the type) error on the test dataset was 15.7 %. Developed system ensured determination
of defect depth with a relative error of 3.2 %, as well as the defect thickness with a relative error of 3.5 %.

Keywords: thermal testing, multilayer materials, deep learning.

DOI: 10.21122/2220-9506-2021-12-2-98-107

Адрес для переписки:                                           Address for correspondence:
Момот А.С.                                                     Momot A.S.
Национальный технический университет Украины                   National Technical University of Ukraine
«Киевский политехнический институт имени Игоря Сикорского»,    "Igor Sikorsky Kyiv Polytechnic Institute",
пр-т Победы, 37, г. Киев 03056, Украина                        Peremohy Ave., 37, Kyiv 03056, Ukraine
e-mail: drewmomot@gmail.com                                    e-mail: drewmomot@gmail.com
Для цитирования:                                               For citation:
A.S. Momot, R.M. Galagan, V.Yu. Gluhovskii.                    A.S. Momot, R.M. Galagan, V.Yu. Gluhovskii.
Deep Learning Automated System of Thermal Defectometry         Deep Learning Automated System of Thermal Defectometry
of Multilayer Materials.                                       of Multilayer Materials.
Приборы и методы измерений.                                    Devices and Methods of Measurements.
2021. – Т. 12, № 2. – С. 98–107.                               2021, vol. 12, no. 2, рр. 98–107.
DOI: 10.21122/2220-9506-2021-12-2-98-107                       DOI: 10.21122/2220-9506-2021-12-2-98-107

                                                              98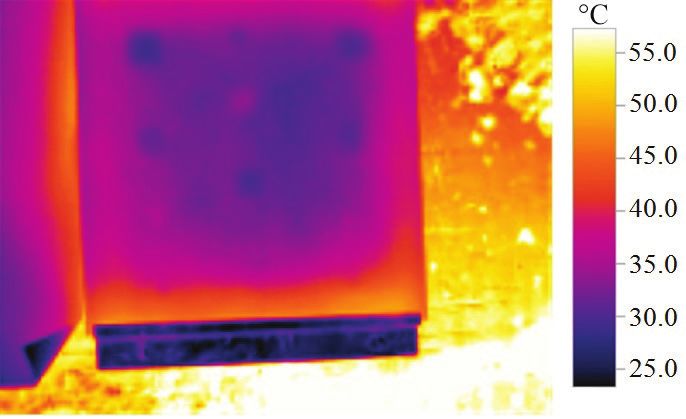
Приборы и методы измерений                                                                      Devices and Methods of Measurements
2021. – Т. 12, № 2. – С. 98–107                                                                        2021, vol. 12, no. 2, pp. 98–107
A.S. Momot et al.                                                                                                     A.S. Momot et al.

Автоматизированная система тепловой дефектометрии
многослойных материалов на основе глубокого обучения
А.С. Момот, Р.М. Галаган, В.Ю. Глуховский
Национальный технический университет Украины
«Киевский политехнический институт имени Игоря Сикорского»,
пр-т Победы, 37, г. Киев 03056, Украина

Поступила 12.03.2021
Принята к печати 15.03.2021

    На сегодняшний день, вместе с ростом темпов промышленного производства повышаются также
и требования к контролю качества продукции. В задачах дефектоскопии и дефектометрии многослой-
ных материалов перспективным является использование теплового метода неразрушающего контро-
ля. В то же время, интерпретация данных теплового контроля усложнена рядом факторов, что де-
лает использование традиционных методов анализа данных неэффективным. Поэтому актуальным
заданием является поиск новых методов теплового контроля, которые позволят автоматизировать
процесс диагностики и повысить информативность полученных результатов. Целью статьи являлось
использование достижений в области глубокого обучения для обработки результатов активного те-
плового контроля изделий из многослойных материалов и разработка автоматизированной системы
тепловой дефектоскопии и дефектометрии таких изделий.
    Предлагаемая система состоит из источника нагрева, тепловизора для регистрации последова-
тельностей термограмм и блока цифровой обработки информации. Для автоматизированной обра-
ботки данных используются три нейросетевых модуля, каждый из которых выполняет одну из задач:
обнаружение и классификация дефектов, определение глубины залегания дефекта и его раскры-
тия (толщины). Программные алгоритмы и интерфейс взаимодействия с системой выполнены в среде
разработки NI LabVIEW.
    Экспериментальные исследования на образцах из многослойного стеклотекстолита показали
значительное преимущество разработанной системы над методами, использующими традиционные
алгоритмы анализа данных теплового контроля. Ошибка определения типа (классификации) дефекта
на тестовом образце составила 15,7 %. Разработанная система обеспечила определение глубины де-
фекта с относительной погрешностью 3,2 %, а также толщины дефекта с относительной погрешно-
стью 3,5 %.

Ключевые слова: тепловой контроль, композиционные материалы, глубокое обучение.

DOI: 10.21122/2220-9506-2021-12-2-98-107

Адрес для переписки:                                           Address for correspondence:
Момот А.С.                                                     Momot A.S.
Национальный технический университет Украины                   National Technical University of Ukraine
«Киевский политехнический институт имени Игоря Сикорского»,    "Igor Sikorsky Kyiv Polytechnic Institute",
пр-т Победы, 37, г. Киев 03056, Украина                        Peremohy Ave., 37, Kyiv 03056, Ukraine
e-mail: drewmomot@gmail.com                                    e-mail: drewmomot@gmail.com
Для цитирования:                                               For citation:
A.S. Momot, R.M. Galagan, V.Yu. Gluhovskii.                    A.S. Momot, R.M. Galagan, V.Yu. Gluhovskii.
Deep Learning Automated System of Thermal Defectometry         Deep Learning Automated System of Thermal Defectometry
of Multilayer Materials.                                       of Multilayer Materials.
Приборы и методы измерений.                                    Devices and Methods of Measurements.
2021. – Т. 12, № 2. – С. 98–107.                               2021, vol. 12, no. 2, рр. 98–107.
DOI: 10.21122/2220-9506-2021-12-2-98-107                       DOI: 10.21122/2220-9506-2021-12-2-98-107

                                                              99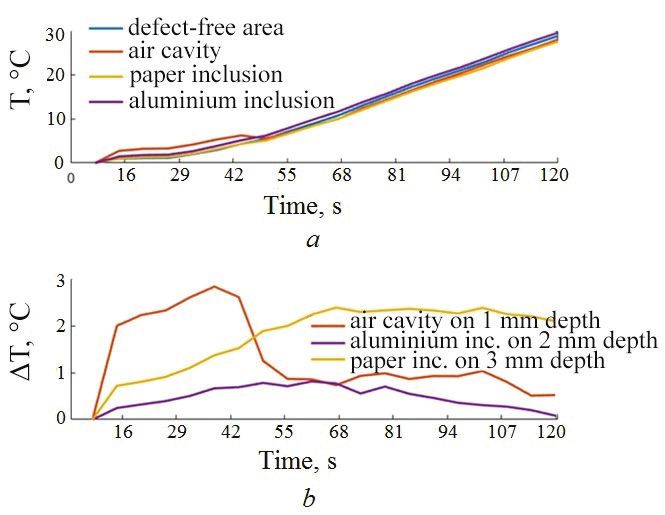
Приборы и методы измерений                                                             Devices and Methods of Measurements
2021. – Т. 12, № 2. – С. 98–107                                                               2021, vol. 12, no. 2, pp. 98–107
A.S. Momot et al.                                                                                            A.S. Momot et al.

Introduction                                                   on a comprehensive statistical analysis of the entire
                                                               recorded sequence of thermograms, which uses the
     Nowadays, products made of multilayer and                 principal components analysis method [5]. Each of
composite materials are widely used in various                 these methods has its advantages and disadvantages,
industries. In particular, composite materials are             but they are all used to solve a narrow range of tasks
increasingly used in aircraft industry, from which the         and are not universal and adaptive [6].
most responsible elements of aircraft construction                   In [7, 8] the method of recognition of three-
are made. At the same time, there is a tendency to             dimensional defects is described. It uses the method
increase the requirements for product quality testing.         of degree of similarity estimating for surface thermal
Timely detection of hidden defects makes it possible           field of OT with the existing 3D surface models,
to prevent significant material and sometimes human            which were obtained by numerical modeling of
losses. Due to a number of advantages, methods of              three-dimensional thermal conductivity task. This
active thermal non-destructive testing (TNDT) are              approach in practice demonstrates low adaptability,
used in composite materials testing tasks. Therefore,          as it requires construction of mathematical models of
it is important to create automated systems for                OT for each new testing task.
determining characteristics of defects based on the                  The work [9] is devoted to the study of deep
results of active TNDT, which will have increased              learning application for composites testing. Study
informativeness, reliability and accuracy of                   shows results of processing experimental data on
defectometry in conditions of significant levels of            carbon fiber testing using two neural networks,
noise and complex internal structure of the object of          which provide both qualitative detection of hidden
testing (OT).                                                  defects and defectometry elements. The first neural
     The results of multilayer materials testing are           network is designed to detect defective areas, and
influenced by a large number of random factors due to          the second is used to classify defects by depth. The
changes in the properties of composites, which occur           high efficiency of the neural network in both types of
due to complexity of their manufacturing processes,            problems is proved.
a large number of types of possible defects that                     The authors of [10] conducted a study of the
cannot be formalized, imperfect inspection methods             effectiveness of method for determining defects
and defectoscopic equipment. Features of properties            depth in multilayer materials using deep learning.
and physical characteristics of multilayer materials           It is presented and implemented a new algorithm
complicate the use of many existing methods of                 based on the use of a multilayer neural network to
TNDT, which use mainly deterministic models                    determine the depth of defects in real time. Study
and their corresponding data processing methods.               uses computer simulations to create an artificial data
Such methods do not provide the necessary noise                set. An experimental validation of neural networks
immunity, measurement accuracy and reliability of              efficiency was performed, which showed an up to
testing [1].                                                   10 % error in determining defects depth at the level
     A rather limited number of scientific papers              of 0.5 mm.
are devoted to the analysis of thermal fields for                    Analysis of existing publications shows that the
the purpose of automated simultaneous detection,               use of modern intelligent systems allows to solve the
classification of defects and determination of                 problems of thermal defectometry with increased
their parameters. Initial researches were aimed at             efficiency. Existing studies prove the prospects of
performing defectometry by solving the inverse                 using deep learning for defect classification and
tasks of TNDT. With the development of modern                  defectometry. The error in measuring defects depth
technologies of digital data processing, development           by traditional methods reaches 7–10 %, while neural
trends have shifted to the application of latest               networks can reduce it to 2.5–3 %. At the same
statistical methods and intelligent systems based on           time, existing works do not provide a quantitative
deep learning.                                                 assessment of the effectiveness of determining
     Today, classical methods of digital signal                defects thickness using deep learning. The authors
processing, such as Fourier transform or wavelet               mainly focus on solving one specific testing task,
analysis, are used to analyze the data of active               while the modern approach requires a comprehensive
TNDT [2, 3]. In particular, the algorithm of dynamic           automated analysis of OT in order to describe it as
thermal tomography is implemented with the use                 fully as possible. Currently, there are no systems
of these methods [4]. Another approach is based                that in practice implement a simultaneous automated

                                                         100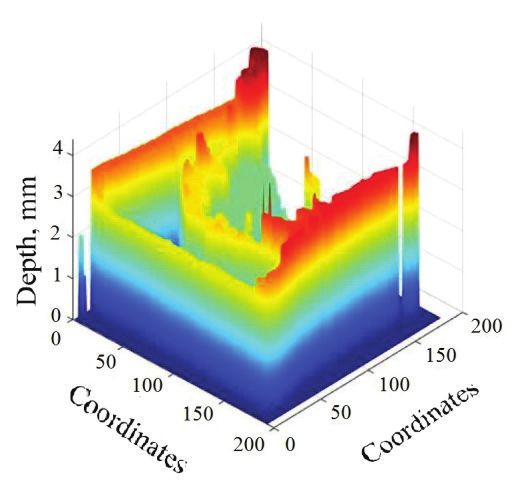
Приборы и методы измерений                                                               Devices and Methods of Measurements
2021. – Т. 12, № 2. – С. 98–107                                                                 2021, vol. 12, no. 2, pp. 98–107
A.S. Momot et al.                                                                                              A.S. Momot et al.

solution to the problems of detecting defects of                of the temperature profile. In particular, for deeper
multilayer materials by the active thermal method,              defects the value of ΔТmax decreases and the time of
their classification and defectometry.                          optimal observation τopt increases.
     Thus, there is a need to develop new methods
and automated testing systems for products
made of multilayer materials. A large number of
interconnected informative parameters, impossibility
of linear separation of defects classes on diagnostic
grounds, need for automation and increasing testing
informativeness require to use the latest data
processing systems, in particular, based on deep
learning algorithms.

Physical principles of active thermal
nondestructive testing
                                                                Figure 1 – Temperature profiles in different points of
     Dynamic thermal field is described by the                  thermogram
function T (x, y, τ). During the active thermal
non-destructive testing, the character of change                     Quality of obtained thermograms significantly
in instantaneous temperature values over time at                depends on the characteristics of heat source and
surface points of OT is considered. To obtain these             instrument for recording the thermal field. Ensuring
dependences, the OT is heated by a heat source for              uniform heating in practice is a difficult task, as the
a certain time. The process of heating and further              nature of heating is influenced by imperfections of
cooling of OT is registered using a thermal imager.             the heat source and numerous external factors, such
Resulting sequence of thermograms reflects the                  as influence of external emitters, air movement
change in temperature field on the surface of the OT            etc. Due to the anisotropy of characteristics,
over time [11].                                                 composite materials have different values of thermal
     Considering the temperature dynamics at                    conductivity along the coordinate axes, which leads
individual points (pixels) of thermograms, which                to shape distortion of defects thermal imprints [12].
correspond to the coordinates of OT surface,                    Therefore, task of testing process automating and
it is possible build a temperature profile – a                  finding new or improving existing testing methods
chart of temperature change over time for this                  that will provide high informativeness, reliability
point (Figure 1). As a rule, in defect-free areas,              and accuracy in such conditions is relevant.
the nature of temperature change is constant and is
considered known. In this case, we can enter some               Automated system of thermal defectometry
reference temperature Tnd (xnd , ynd , τ), which is             structure
considered defect-free. In the defect zone, the regular
                                                                     Trends in the development of TNDT place the
nature of the thermal field is disturbed and local
                                                                following requirements on testing systems: a high
temperature differences Td (x, y, τ), occurs, which
                                                                level of automation; high informativeness, speed
lead to a change in the temperature profile. Thus,
                                                                and productivity of testing; versatility and high
it is possible to calculate the value of temperature
                                                                adaptability; high reliability of testing and accuracy
difference between defective and defect-free areas:
                                                                of defectometry. To meet these requirements, it is
∆T ( x, y, τ) = Td ( x, y, τ) − Tnd ( xnd , ynd , τ ).          necessary to use modern hardware and software. At
                                                                the same time, the general scheme of active thermal
     The time τopt, at which the value of ΔT (x, y, τ)          testing remains unchanged. The object of testing is
in this area of OT becomes the maximum, is called               exposed by a heat source. Inside a solid, thermal
the optimal time of testing:                                    energy is distributed in all directions due to the
∆Tmax ( x, y, τ ) = ∆Tmax (τ opt ).                             diffusion process. In the presence of hidden defects,
                                                                the heat fluxes inside OT are redistributed, which
     As the size of the defect increases, its heating           leads to the appearance of specific temperature
rate decreases, which leads to a change in the shape            anomalies on its front and rear surfaces.

                                                          101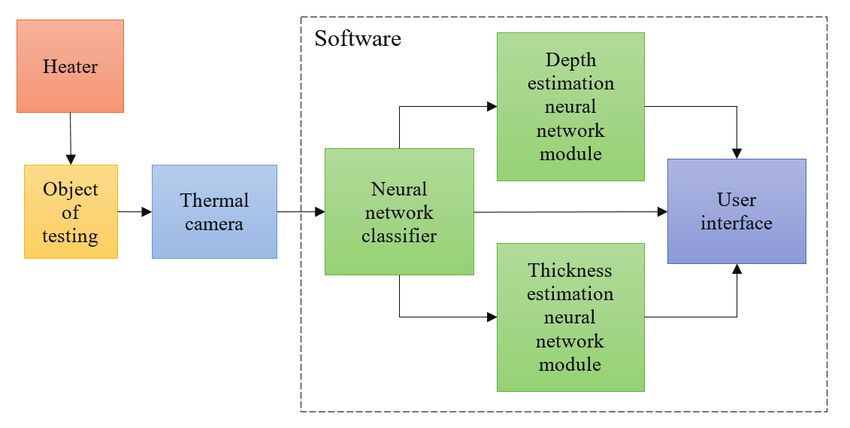
Приборы и методы измерений                                                              Devices and Methods of Measurements
2021. – Т. 12, № 2. – С. 98–107                                                                2021, vol. 12, no. 2, pp. 98–107
A.S. Momot et al.                                                                                             A.S. Momot et al.

The temperature field of OT is observed and registered           types of defects will not necessitate changes in
using an infrared camera. Temperature signals,                   further data processing algorithms.
presented in the form of thermograms, are transmitted                 Based on the analysis of existing schemes of
to an automated data processing system on a PC to                active thermal testing, it is possible to synthesize
detect defects and determine their parameters [13].              the scheme of realization of automated TNDT data
     The choice of testing scheme, characteristics               processing system using an improved method of
of heat source and thermal imaging equipment                     determining the defects characteristics. This method
significantly affect the diagnostic result. The                  involves automated data analysis in three neural
efficiency of traditional methods of thermogram                  network modules. The modular structure facilitates
sequence processing directly depends on these                    construction and modification of the system
factors. This reduces the versatility of testing systems         and increases overall efficiency of its work by
that use standard data processing algorithms. In                 optimizing the settings of modules to solve specific
particular, changing the OT, heat source or thermal              problems [14].
imager in many cases leads to the need for a complete                 General block diagram of the automated system
recalculation of system parameters. The use of                   for determining defects characteristics is shown in
modern methods of TNDT data processing on the                    Figure 2. The system is universal and can be used
basis of deep learning allows you to add information             for various testing schemes and regardless of the
about new OT or take into account changes in testing             characteristics of heat source, infrared camera or
conditions without losing previous data. Because all             OT parameters. The core of each neural network
information about network experience is contained                module uses a deep feedforward network. Software
in weights, retraining the system in the event of                algorithms of the system are implemented in
inspection of new objects or the appearance of new               NI LabVIEW environment.

Figure 2 – The structure of proposed automated active thermal defectometry system

Experimental studies of the proposed system                      three types: air cavities (white in Figure 3), paper
                                                                 foreign inclusions (red) and aluminum third inclu-
     In order to conduct experimental studies of                 sions (blue). Defects have a square shape, the size
the efficiency of automated thermal defectometry                 of side is from 10 mm to 4 mm. Hidden artificial
system, two training and one test sample of multilayer           defects are located at depths of 1 to 3 mm and have
fiberglass were developed. This material is used as a            different values of thickness: 1 mm, 2 mm or 3 mm.
structural for manufacture of critical parts with high                The scheme of bilateral active TNDT was used
strength. Developed samples are square plates of five            during the experiment. The power of infrared heat
layers fiberglass. Total thickness of each sample is             source was 1 kW. To minimize the impact of thermal
5 mm, the thickness of one layer is 1 mm. The side               radiation from the heat source on results, a steel
of the plate is 100 mm.                                          protective plate was used, which contains a hole and
     The scheme of the test sample is shown in                   a mount for OT. The plate with OT was located at
Figure 3. It contains hidden artificial defects of               a distance of 100 mm from the heater. The distance

                                                           102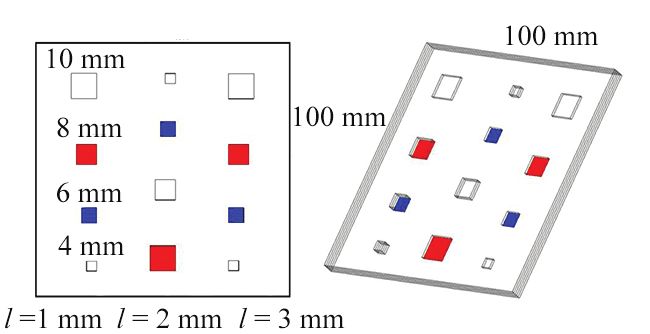
Приборы и методы измерений                                                                  Devices and Methods of Measurements
2021. – Т. 12, № 2. – С. 98–107                                                                    2021, vol. 12, no. 2, pp. 98–107
A.S. Momot et al.                                                                                                 A.S. Momot et al.

from OT to the infrared camera is 400 mm. Testo                        On the optimal thermogram it is possible to
876 infrared camera was used to record a sequence                distinguish visually 8 thermal prints of artificial
of thermograms.                                                  defects. Due to significant boundary effects,
                                                                 information on bottom row of defects is lost. In
                                                                 general, the OT thermogram is characterized by
                                                                 uneven heating, which complicates its automated
                                                                 processing by standard methods. Next, only the
                                                                 region of interest (which is directly OT) is considered.
                                                                       Figure 5a shows samples of temperature
                                                                 profiles of the defect-free and defective areas for
                                                                 different types of defects, lying at a depth of 3 mm.
                                                                 An example of differential temperature signals from
Figure 3 – Test sample scheme                                    artificial defects of the test sample, which are located
                                                                 at different depths, is shown in Figure 5b.
     The infrared camera and heat source are
controlled by operator in manual mode. Ambient
temperature during the experimental studies was
20 °C. At the beginning of experiment, the first
thermogram was registered OT at the initial time.
After turning on the infrared heater and putting it
to work, recording of thermograms begins. Time
interval between adjacent thermograms is 6 s.
Heating and recording of the experimental sequence
of thermograms was carried out for 120 s. After the
thermograms recording procedure is completed,
the heater is switched off. Experiment resulted in a
sequence of 20 thermograms. Obtained results reflect
the process of OT thermal field changing at the stage
of heating.
     Recorded thermogram sequences were exported                 Figure 5 – Signals from the defect-free area and the defects
to a PC. The initial processing of thermograms was               of test sample: a – temperature profiles at a 3 mm depth;
                                                                 b – differential temperature signals at different depths
carried out using proprietary Testo IRSoft software.
The resolution of the each obtained thermogram is
                                                                      To form a set of training vectors for neural
320 × 240 pixels. Thermograms are stored as arrays
                                                                 network modules, two training samples were
of pixel temperatures. Based on the obtained results,
                                                                 developed and manufactured. The material, structure
a set of initial data for further processing is formed.
                                                                 and geometric dimensions of the training samples
The thermogram of test sample at the optimal time of
                                                                 correspond to similar parameters of test sample.
testing is shown in Figure 4.
                                                                 The procedure of training samples testing took place
                                                                 according to the method and conditions described for
                                                                 the test sample. Training samples contain artificial
                                                                 internal defects in the form of air cavities, foreign
                                                                 aluminum and paper inclusions with different
                                                                 geometric dimensions, thickness and depth values.
                                                                 In total, 6 artificial models with different parameters
                                                                 were created for each type of defects.
                                                                      As a result, a set of temperature profiles vectors
                                                                 with a total number of 6545 samples was formed.
                                                                 This set includes 3605 examples of temperature
                                                                 profiles from defect-free areas, 1414 profiles of
Figure 4 – Thermogram of the test sample at optimal time         defects in the form of air cavities, 1019 profiles
of testing                                                       of defects in the form of paper inclusions and

                                                           103
Приборы и методы измерений Devices and Methods of Measurements
2021. – Т. 12, № 2. – С. 98–107 2021, vol. 12, no. 2, pp. 98–107
A.S. Momot et al. A.S. Momot et al.
507 profiles of defects in the form of aluminum determination of depth and thickness of defects
inclusions. Training dataset is characterized by a were created and trained. To solve these tasks, it
certain unevenness, which arose due to the limited is advisable to choose the architecture of neural
number of training samples. The set of training networks for the detection and classification of
vectors was divided into training / validation / test defects, which is shown in Figure 6. Architecture of
subsets in the proportion of 70 % / 15 % / 15 % networks for determining defects depth and thickness
respectively. is similar. The input layer contains 20 neurons,
In order to process the experimental sequence of which corresponds to the number of thermograms in
thermograms of the test sample, neural networks of sequence. The source layer contains 4 (according to
appropriate modules for detection and classification, the number of classes) or 1 neuron.
Figure 6 – Architecture of defect detection and classification neural network
The Levenberg-Markard algorithm was used The shape and size of the defects are close to
as an optimizer. Loss function – MSE, metric – true ones. In the image we can see some dots of
MAE. According to the training results, MAE of incorrectly classified temperature profiles, which
defects depth determination on the validation set was can be filtered by a median filter. In addition,
0.028 mm, MAE of thickness determination was Figure 7 also shows binary defect maps obtained
0.019 mm. using classical methods: optimal thermogram,
The defects map, obtained by the results Fourier and wavelet analysis methods, principal
of work of trained neural network module for components analysis method (PCA), and dynamic
defects detection and classification, is shown in thermal tomography (DTT). Visually it is possible
Figure 7. All 12 artificial defects were detected to notice the increased efficiency of offered system
and unmistakably classified on the map. Defects on the basis of deep learning in comparison with
color on the map corresponds to their depth. classical methods.
Figure 7 – The results of processing experimental data by traditional methods and using the proposed system
104Приборы и методы измерений Devices and Methods of Measurements
2021. – Т. 12, № 2. – С. 98–107 2021, vol. 12, no. 2, pp. 98–107
A.S. Momot et al. A.S. Momot et al.
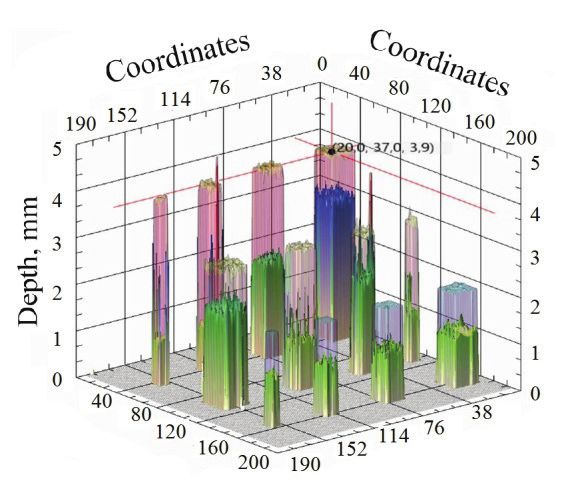
Figure 8 shows the thermal tomogram obtained emissions. This effect can be eliminated using
by the DTT method and the image of test sample median filtering. In general, image of the internal
internal structure, which was built on the results of structure is reliable. Quantitative evaluation of
proposed system. At the defects boundaries there certain parameters and comparison of results with
are negative edge effects in the form of anomalous traditional methods is given below.
es Coo
dinat rdin
Coor ates
Depth, mm
Depth, mm
Co s
ord inate
ina
tes ord
Co
а b
Figure 8 – Results of processing experimental data: a – thermal tomogram by DTT method; b – internal structure of
the OT (by proposed system)
Discussion by developed automated system based on deep
According to the results of quantitative learning. In particular, the use of neural networks
evaluation of effectiveness of defects detecting is only method by which it was possible to detect
in test sample by different methods (Table), it is all 12 artificial defects and automatically classify
established that the best results are demonstrated them.
Table
Results of thermograms sequence processing by different methods
Fourier Wavelet Neural
Criterion / method Thermogram PCA DTT
analysis analysis network
The number of detected
8 10 7 11 8 12
defects
Defect classification
– – – – – 15.7
error, %
Tanimoto criterion, % 19.5 10.9 6.4 23.6 7.0 88.1
Depth estimation error, % – – – – – ± 3.2
Thickness estimation
– – – – – ± 3.5
error, %
The neural network module for defects detection at 88.7 % confirms the high reliability of constru-
and classification allows to determine the size of cted defects map.
defects by their thermal imprints with the highest In considered conditions of testing the use of
accuracy among considered methods. Temperature deep learning is the only method that gives chance
profiles were automatically classified with an error to define defects depth effectively. Corresponding
of 15.7 %. The value of Tanimoto criterion [15] neural network module allows to determine the depth
105Приборы и методы измерений Devices and Methods of Measurements
2021. – Т. 12, № 2. – С. 98–107 2021, vol. 12, no. 2, pp. 98–107
A.S. Momot et al. A.S. Momot et al.
of artificial defects of in test sample with a relative different defects and materials configurations. This
error within ± 3.2 %. DTT method in a similar task will expand the scope of developed automated system
showed negative results, which makes it impossible without the need to retrain neural networks for each
to assess the accuracy of determining defects depth. individual task or type of multilayer material.
Relative error in determining defects thickness
by neural network module is ± 3.5 %. Constructed References
thermal tomogram of the internal structure of
sample is generally reliable, but at the boundaries 1. Galagan R.М. Analysis of application of neural
of some defects there are negative boundary effects. networks to improve the reliability of active thermal NDT.
Therefore, the thickness measurement must be KPI Science News, 2019, no. 1, pp. 7–14.
performed at the central points of thermal imprints DOI: 10.20535/kpi-sn.2019.1.157374
of the defects. 2. Jiangang S. Analysis of data processing
Consequently, the use of proposed automated methods for pulsed thermal imaging characterisation
system based on deep learning demonstrates of delaminations. Quantitative InfraRed Thermogra-
the advantages of neural network modules over phy Journal, 2013, vol. 10, pp. 9–25.
traditional methods in all testing tasks. Due to the DOI: 10.1080/17686733.2012.757860
3. Ahmed J., Gao B., Woo W.L., Wavelet-Integrated
high noise immunity and generalizing properties
Alternating Sparse Dictionary Matrix Decomposition
of neural networks, the presence of non-uniform
in Thermal Imaging CFRP Defect Detection. IEEE
heating has a weak effect on the efficiency of defects
Transactions on Industrial Informatics, 2019, vol. 15,
detection in multilayer materials and the accuracy of
no. 7, pp. 4033–4043.
measuring their parameters. DOI: 10.1109/TII.2018.2881341
4. Vavilov V.P. Dynamic thermal tomography:
Conclusion Recent improvements and applications. NDT&E
International, 2018, no. 135, pp. 129–141.
In the paper offered to use the deep learning DOI: 10.1016/j.ndteint.2014.09.010
approach for automation of thermal defectometry 5. Dudzik S. Analysis of the accuracy of a neural
of products from multilayer materials. The system algorithm for defect depth estimation using PCA
for implementation of this method consists of three processing from active thermography data. Infrared
modules based on neural networks. Modules are Physics & Technology, 2013, no. 56, pp. 1–7.
designed to solve tasks of defects classification DOI: 10.1016/j.infrared.2012.08.006
by type, determining their depth and thickness. 6. Balageas D., Maldague X., Burleigh D, Vavi-
Experimentally established that developed automated lov V.P., Oswald-Tranta B., Roche J.-M., Pradere C.,
system allowed to detect and classify all artificial Carlomagno G.M. Thermal (IR) and other NDT
defects embedded in the test sample, and to estimate techniques for improved material inspection. Journal of
their depth with an error within ± 3.2 % and thickness Nondestructive Evaluation, 2016, vol. 35, no. 1, article 18,
with an error up to ± 3.5 %. Defect maps constructed 17 p. DOI: 10.1007/s10921-015-0331-7
as a result of processing experimental data using the 7. Marani R., Palumbo D., Reno V. Modeling and
proposed system have a high reliability according to classification of defects in CFRP laminates by thermal
non-destructive testing. Composites Part B: Engineering,
Tanimoto criterion (88.1 %). In addition, the results
2018, no. 135, pp. 129–141.
of comparative analysis show that the developed
DOI: 10.1016/j.compositesb.2017.10.010
system has an advantage over traditional methods in
8. Hellstein P., Szwedo M. 3D thermography in non-
qualitative and quantitative indicators.
destructive testing of composite structures. Measurement
The main direction for further research is to Science and Technology, 2016, vol. 27, no. 12, article
optimize the architecture of neural networks of id. 124006. DOI: 10.1088/0957-0233/27/12/124006
relevant system modules by using the latest advances 9. Vavilov V.P., Nesteruk D.A. Aktivnyj teplovoj
in deep learning. In particular, it is proposed to kontrol' kompozicionnyh materialov s ispol'zovaniem
introduce normalization and dropout layers into nejronnyh setej [Active thermal testing of composite
the network architecture, to change the training materials using neural networks]. Defektoskopiya
optimization algorithm and activation function of [Defectoscopy], 2011, no. 10, pp. 10–18 (in Russian).
fully connected layers. An important task is also the 10. Saeed N., Omar M.A., Abdulrahman Y. A
formation of a wide training samples dataset with neural network approach for quantifying defects depth,
106Приборы и методы измерений Devices and Methods of Measurements
2021. – Т. 12, № 2. – С. 98–107 2021, vol. 12, no. 2, pp. 98–107
A.S. Momot et al. A.S. Momot et al.
for nondestructive testing thermograms. Infrared Phy- 13. Ciampa F., Mahmoodi P., Pinto F., Meo М. Re-
sics & Technology, 2018, no. 94, pp. 55–64. cent Advances in Active Infrared Thermography for Non-
DOI: 10.1016/j.infrared.2018.08.022 Destructive Testing of Aerospace Components. Sensors,
11. Chulkov A.O., Nesteruk D.A., Vavilov V.P. 2018, vol. 18(2), article id. 609.
An Automated Algorithm for Constructing Maps of DOI: 10.3390/s18020609
Defects in Active Thermal Testing. Russian Journal of 14. Momot A., Galagan R. Influence of architecture
Nondestructive Testing, 2019, vol. 55, pp. 617–621. and training dataset parameters on the neural networks
DOI: 10.1134/S1061830919080035 efficiency in thermal nondestructive testing. Sciences of
12. Vavilov V., Plesovskikh A., Chulkov A. A com- Europe, 2019, no. 44, pp. 20–25.
plex approach to the development of the method and 15. Chulkov A.O. Analyzing efficiency of optical
equipment for thermal nondestructive testing of CFRP and THz infrared thermography in nondestructive
cylindrical parts. Composites Part B: Engineering, 2015, testing of GFRPs by using the Tanimoto criterion.
vol. 68, pp. 375–384. NDT & E International, 2021, vol. 117, article id. 102383.
DOI: 10.1016/j.compositesb.2014.09.007 DOI: 10.1016/j.ndteint.2020.102383
107You can also read