WHISTLE SOUND RECOGNITION IN A NOISY ENVIRONMENT
←
→
Page content transcription
If your browser does not render page correctly, please read the page content below
WHISTLE SOUND RECOGNITION IN A NOISY
                   ENVIRONMENT
                                Gil Lopes, Fernando Ribeiro, Paulo Carvalho
                      gil@dei.uminho.pt, fernando@dei.uminho.pt, ricardocarvalho16@gmail.com

                 Universidade do Minho, Departamento de Electrónica Industrial, Guimarães, Portugal

                Abstract – This paper describes the development of an electronic system that
                automatically recognises the sound of a referee whistle in a nosy environment. It
                can be directly adapted to any robot on a robotic competition namely robotic
                football. Experiments have been conducted in order to test the developed system
                and results are shown.

                Keywords: - signal converter, signal analysis, signal processing, Fast Fourier
                Transforms

                   1. INTRODUCTION                            Fourier Transform (FFT) is then calculated to obtain the
                                                              signal spectrum in the frequency domain. A mask is
     Detecting the sound of a referee whistle is a major      then applied working as a filter to eliminate some
advantage to robotic competitions due to human                samples. The final result is sent out to an Artificial
detachment with the robot when it is time to start or         Intelligence (AI) software which tells if those samples
stop playing. In some applications this is achieved by        consist of a whistle sound or not. It is still necessary to
wireless communications when they exist. In some              train the AI software. Fig. 1 shows the architecture of
other cases it relies on user intervention to start or stop   the described system [3].
a robot. Nilsson et al [1] have already investigated and
presented some work in this area where a frequency
estimation system was presented. The authors found
out that in a range of different tested whistles the band
frequency was from 500 to 5000 Hz. The system was
tested with background noises such as music, white
noise, babble and car noise. In this work different types
of tests were conducted in different environments to
test the reliability of the developed system. One
possible approach to tackle this problem consists of
using speech recognition systems due to their ease of
use and training. Unfortunately, these systems use
                                                              Fig. 1 –System architecture [3]
algorithms based on statistics and mathematical
theories that requires high processing power. There are
                                                                   As for a robotic car which interprets voice
even some systems that use a training method which
                                                              commands, Harison et al [4] have developed a system
adapts the word identification parameters for a given
                                                              based on a microcontroller. Their system captures sound
speaker (e.g. HMM - Hidden Markov Models) [2].
                                                              from a microphone passing it through a pre-amplifier
     The main objective of this project consists of
                                                              and a band-pass filter and then the signal is converted to
developing a system based on a compact electronic
                                                              digital. 256 samples are acquired at a sampling rate of 4
circuit able to recognise a referee whistle away from
                                                              kHz. The general operation of this system is presented
any high computational power, at a very low cost and
                                                              in Fig. 2. This system works based on word fingerprints.
able to operate in a noisy environment.
                                                              Each word has a defined fingertip that in turn is
                                                              compared to the word acquired. The system needs
                2. OTHER APPROACHES                           previous learning of word fingerprints in order to
                                                              operate properly. The microcontroller used is an
     Some other approaches were also found related to         ATmega32 with a clock of up to 16 MHz making it a
this work. The Milan RoboCup Team [3] has also                relatively compact, simple and low cost system.
developed a system that is able to recognise the referee           However, the developed algorithm is too sensitive
whistle by means of signal processing. The sound              to noise as it can only operate in quiet environments. In
signal is captured at a sample rate of 8 kHz by the           that sense it is not reliable for the objectives proposed
internal microphone of a computer and this signal is          for this work. Fig. 3 shows a block diagram of the
then amplified by the computer soundboard. A Fast             fingerprint creation algorithm.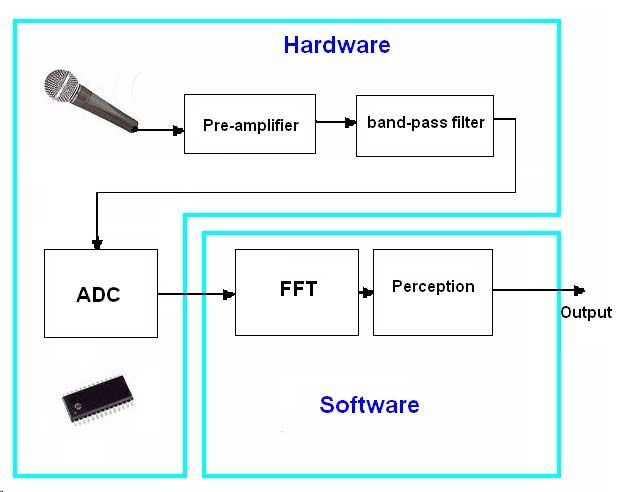
on other factors which makes it impossible to
                                                           distinguish between two different whistles.
                                                                Fig. 4 shows two examples of the whistle sound
                                                           spectrum obtained from the software FFT MusEV 1.0.
                                                           The X axis represents frequency in Hz with a
                                                           logarithmic scale and the Y axis representing the
                                                           amplitude (without scale). A vertical green line is
                                                           positioned as a cursor where the peak frequency of the
                                                           graph is detected.

Fig. 2 – The general operation of the system [4]

                                                           Fig. 4 –Signal spectrum results of whistle sounds after
                                                           FFT calculation using FFT MusEV 1.0

                                                               Since one of the objectives is to operate in noisy
                                                           environments it was important to introduce various
                                                           types of signal noises. This allowed the observation of
Fig. 3 –Fingerprint creation algorithm [4]                 how the noise influences the whistle signal when it is
                                                           added. In that sense individual analyses were performed
                3. SIGNAL ANALYSIS                         alongside the whistle blowing. The noises analysed
                                                           were: mouth whistling, clapping, finger snapping,
     Signal analysis was conducted on various samples      vacuum cleaner.
of a typical referee whistle sound signal. This allowed        Fig. 5 and Fig. 6 show the graphical spectrum
some conclusions to be taken that helped defining          results of each noise analysed individually.
major steps of the system to be created.
     In this task the purpose was to make a signal
spectrum analysis in order to graphically see the signal
amplitude as a function of its frequency. This analysis
has revealed greater perception of the different sound
signals when compared to the typical time analysis.
     To perform the signal analysis a microphone was
connected to a computer in which a spectral software
analysis called FFT MusEV V1.0 was installed [5].
This software is free exclusively for educational
purposes. It works with wave files and calculates the
signal spectrum with a FFT of 2 points chosen by the
                                 n

user. To create the wave files a Microsoft Windows™        Fig. 5 – Spectrum analysis of a normal mouth whistling
computer sound recorder program was used.                  sound
     First samplings were taken using two whistles and
four people in a quiet environment. The observed
resulting spectrum shows that the whistle sound signal
varies with the following factors:
     • Person blowing the whistle
     • Intensity of the blow
     • Distance to microphone
     • Whistle
     • The instance of time when the signal is
           captured.                                       Fig. 6 – Spectrum analysis of a clapping sound
     However, the signal spectrum shape is always
consistent in every trial showing a peak frequency at              From each noise trial analysis it is possible to
around 2.3 and 2.9 kHz.                                    conclude that both shape and peak frequencies vary
     Although the signal spectrum seems to be              according to the type of noise introduced. The spectrum of
dependent on each whistle it significantly depends also    a mouth whistle is centred on a peak frequency which in
this case is around 1.2 kHz. The spectrum of clapping 4. SYSTEM DEVELOPMENT
includes a high range of frequencies but its amplitude is
only considered high in the range between 600Hz and 1.6 There is at this point in time of this work sufficient
kHz. knowledge of similar existing projects, as well as
algorithms used in speech and sound recognition. The
whistle sound signal was analysed and understood in
time and in frequency as well as its relation to well
known noises. It was already said earlier that the use of
speech recognition algorithms are not suitable for noisy
environments. Any method of speech or sound
recognition using the signal versus time will be more
difficult to implement with respect to noise immunity,
since the resulting signal as a function of time is the
sum of all signals. In other words, considering the
various amplitude, frequency and phase of different
Fig. 7 – Spectrum analysis of a finger snapping sound signals, the result is a "soup" of signals and hence, it is
difficult to distinguish a signal from others. Fig. 10
shows an example of multiple sound signals viewed as a
function of time. It can be noticed the difficulty it would
be to isolate a specific sound signal.
Fig. 8– Spectrum analysis of a vacuum cleaner sound
The spectrum shape of finger snapping is similar
to the shape of a mouth whistle although the peak
frequency is higher and around the 3 kHz. There is a
negligible peak frequency above 5 kHz. The spectrum
of a vacuum cleaner is a mixture of a range of different
frequencies with low amplitude. Its peak frequency is Fig. 10 – Representation of a sound signal as a function
around 300 Hz but also with low amplitude. of time [6]
After adding the referee whistle sound to one of
the noises, the spectrum of each sound is not For the system to have the necessary noise
significantly influenced except for finger snapping. immunity it has to be based in the signal spectrum
Whereas with each noise it is possible to detect a clear analysis and thus a Fourier analysis must be performed.
frequency peak of a referee whistle, with finger As it was seen before, for this work to be accomplished
snapping the generated spectrum produces a higher a microcontroller should be used to make this system
peak frequency for the finger snapping than for the very compact. Since a microcontroller only works with
whistle sound. discrete signals it is necessary to use an Analogue to
Fig. 9 clearly shows a peak frequency around 3 Digital Converter (ADC) input to convert the analogue
kHz that resembles the peak detected for the finger signal.
snapping peak. The signal amplitude for the whistle is The Fourier transform demands for a continuous
shown on the graph as a smaller intensity peak at input signal, however a DFT- Discrete Fourier
around 2 kHz as it can be seen in Fig. 9. Transform can be used instead. This transform already
works with discrete signals for a Fourier analysis but
there is yet another version of the DFT which was
mentioned before: Fast Fourier Transform (FFT). FFT is
an efficient algorithm to process DFTs. It is a better
solution to be implemented on a microcontroller due to
its lower calculation demanding.
After carrying out the signal spectrum analysis, a
perception program was created to “look” inside the
results and analyse them, to check whether it is a
whistle sound signal or not. The hardware and software
diagram implementation can be seen on Fig. 11.
Fig. 9 – Spectrum of a whistle sound plus finger
snapping soundFig. 14– Schematic of the pre-amplifier circuit [9]
Fig. 11 – Hardware and software implementation
Since the microphone frequency response is wide it
4.1. Hardware is necessary to filter most frequencies in order to obtain
the intended frequency range. In that sense, a band-pass
The hardware consists of four parts: Microphone, filter was added to narrow the signal frequencies to
Pre-Amplifier, Band-pass filter and ADC. The those as close as much of a whistle sound signal. This
microphone is the first element of the system and one filter was inserted in between the pre-amplifier and the
of the most important ones as it transforms the sound acquisition system. It prevents unwanted frequencies to
waves in an electric signal. The microphone used is an be sampled and captured.
electret microphone which is a type of condenser From the conducted experiments it was observed
microphone that has a frequency response between that the region between 2 kHz to 4 kHz would be where
50Hz – 15 kHz. the whistle sound signal was more distinguished.
Fig. 12 shows a picture of electret condenser Therefore, a second order band pass filter was
microphones and Fig. 13 shows the frequency response developed based on this data. Fig. 15 shows the circuit
of the Hosiden KUB2823 microphone model used for schematic of the developed filter.
this work.
Fig. 15 - Band- pass filter schematic of the second order
Fig. 12– Electret Condenser Microphones [7] with passing band between 2 – 4 kHz
For the signal acquisition system a 12 bit ADC was used
embedded in the microcontroller. This ADC can sample
at rates up to 200 ksps.
4.2. Software
FFT algorithms were implemented on a 16 bit
microcontroller. The choice of a 16 bit processor rather
than 8 bit relies on the increased precision that
Fig. 13 – Frequency response of a Hosiden KUB2823 eliminates accumulated errors on the FFT calculation. A
model [8] 32 bit microcontroller would increase the price and size
of the whole system and it was considered unnecessary.
An electret condenser microphone on its own The microcontroller chosen was the Microchip
generates just a few millivolts. The produced signal dsPIC30F4013. Some important characteristics of this
needs to be amplified and a pre-amplifier circuit is microcontroller are:
applied to increase the voltage levels to a more usable • Internal architecture optimized for C language
one. This circuit is powered with 5V and with the instructions
respective amplification gain it produces an output • Clock operation of up to 120 MHz (30 MIPS -
signal that varies from 0-5V. Fig. 14 shows the Million Instructions per Second)
circuit schematic with the electronic components used • 48 Kbytes of Flash memory
and their respective values. • 2 Kbytes of RAM• 12-bit ADC with sampling frequencies of up to
200 ksps and 13 input channels
• Interface with serial port
• Interface I2C
• Appropriate hardware for signal processing
The software was developed in the C language
using the MPLAB C30 compiler. Signal acquisition is
performed at a sample rate that follows the Nyquist
theorem, i.e., twice the maximum frequency of the
input sound signal. The maximum frequency of the
input signal is the cut-off upper frequency of the band-
pass filter. In this case is 4 kHz. Therefore, equation 1
shows this sampling frequency as:
f s = 2 × f M ⇔ f s = 2 × 4000 = 8kHz (1)
where f s is the sampling frequency and f M is
the input sound signal frequency.
Fig. 16 shows a flowchart of the implemented
algorithm for the microcontroller signal acquisition.
Initially, a set of configurations is passed onto the
microcontroller’s ADC in order to define its
parameters. A set of 256 samples is acquired at a time
and then processed for the whistle sound detection.
Blocks of 256 samples are subsequently acquired for
continuous operation. The result is an array of 256 real
numbers.
The FFT implementation on the dsPIC30F4013
microcontroller takes advantage of the processor DSP
capabilities. A library provided by the manufacturer is
used where FFT functions are already implemented.
This library provides the entire signal processing
functions of the processor. In order to utilize the array
created by the signal acquisition a conversion is
needed. The array is of real numbers and they have to
be converted to complex numbers for the FFT
calculation. This is performed by attributing the real
numbers from the array to the real part of the complex
numbers and zero to the imaginary part.
The calculation of the FFT requires the calculation
of a complex exponential at each iteration but that
would be too "heavy" in terms of computational
processing. Yet these complex exponentials did not
depend on the input signal but the time instant and the
number of points. Thus, for a FFT of 256 points this
exponential will always have the same value. Based on
this it was decided to declare the value of such
exponentials in the code memory and calling them
from the FFT calculation (Twiddle Factors [10]). The
algorithm flowchart is represented in Fig. 17.
Fig. 16 – Algorithm implemented for the
microcontroller’s signal acquisitionAfter the FFT calculation an algorithm for the
whistle sound detection is required. This task is
performed by the perception algorithm that decides
whether or not the acquired sound is a whistle sound
based on the output of the FFT calculation. This
algorithm flowchart is shown in Fig. 19.
Peak frequency detection and amplitude checking
are the basis of this algorithm that processes the output
of the FFT calculation and searching these values.
Amplitude and frequency hysteresis is applied to the
stream of data from the FFT and analysed. If a matching
frequency and amplitude are found a high probability to
be a whistle sound is very strong. This was achieved
using a mask as explained below.
Fig. 17 – Algorithm of the FFT implementation on the
microcontroller
In order to communicate between the computer
and the microcontroller a communication protocol was
implemented. This also aided in the debugging during
software development. Communication was attained
by an UART (Universal Asynchronous Receiver
Transmitter) module of the microcontroller that
interfaces with the PC serial port. On the
microcontroller side this UART uses TTL levels and
they were converted to RS-232 levels through a
MAX233 chip manufactured by MAXIM. To show the
data received by the computer a software package
named RComSerial v1.2 was used. The
microcontroller’s communication algorithm is shown
in Fig. 18.
Fig. 19 – Perception algorithm using FFT output values
Fig. 20 shows how this mask is applied to the
frequency spectrum analysis in order to take the final
decision whether it is a whistle sound or not. The
parameters f1 and f2 define the range of frequencies
where the signal must fall in to be considered a valid
whistle sound signal. Amplitude A isolates probable
false positives in case of a low amplitude signal. A R
parameter count the number of times the detected peak
was found above A and between f1 and f2. It also serves
to discard false positives. All of these parameters are
configurable during runtime to assure all sorts of
situations and environments increasing the robustness of
Fig. 18 – Algorithm of the implementation of serial the developed system. Tuning them also allows the
port. system’s adjustment to different referee whistle types.microphone the parameters used revealed successful
results. At this stage, apart from frequency and
amplitude values, the R parameter was set to 1. To test
the system further the whistle was then blown 10 meters
away from the microphone. The data was collected from
the board to be analysed and it is shown in Fig. 22. The
board LED went ON showing that at this distance it was
successfully detected.
Fig. 22 – Frequency Spectrum of a Whistle sound from
a distance
Next set of experiments was to test the system’s
immunity to noise. Several people were invited to create
an atmosphere of noise from clapping, yelling, finger
snapping, mouth whistling, loud talking, etc. With R=1
the system did not mistake the noises as referee whistles
in almost every case except for some clapping and
finger snapping.. With R≥2 some finger snapping was
Fig. 20 – Perception and decision based on mask the only noise detected. With R≥10 nobody could
filtering and f1, f2, A and R parameters activate the LED with any noise produced.
On the other hand the referee whistle was clearly
detected with 1 second latency. In other words, the
5. RESULTS
referee whistle had to be blown for more than 1 second
to be recognised with R≥10. This is due to the repetitive
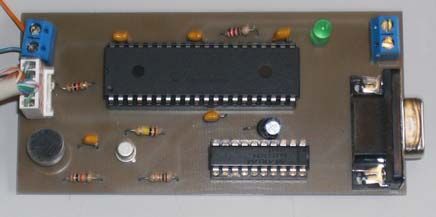
A small and compact circuit board was created as
increment of the R value in every 256 sample
shown in Fig. 21. The general size of the board was
calculation. These results follow inline with the initial
inside what was intended initially (103 mm × 50 mm).
experiments conducted in the beginning of this work.
Experiments were conducted in order to test this final
Another set of experiments was with two different
system. Serial port communication was used to transfer
referee whistles. Parameters were adjusted for on
the spectrum results to the PC in order to give further
whistle and then tested with both whistles at different
evaluation on the obtained data.
times. The system detected both whistle sounds
whatsoever every time they were blown. Although
being on different frequencies they still were close
enough to be recognised as whistle. The only way to
differentiate two referee whistle sounds is if they
produce very different frequency tones. Narrowing the
values of f1 and f2 reduces the chance of recognition of
a single tone hence increasing the probability of failure
to detect a valid whistle sound.
6. CONCLUSIONS
Fig. 21 – Circuit board of the created system
Whistle sound detection was performed in this
A green LED onboard was also used to identify a
work. Experiments were conducted and have shown that
whistle sound. It turns on when a whistle sound is
frequency spectrum analysis of sound signals is more
detected.
adequate because it shows a high degree of immunity to
After beginning with a set of initial parameters the
noise. This finding has allowed the creation of a simpler
tests were successfully performed. The referee whistle
and lighter algorithm for its detection. However there
used was detected every time. At 1 meter from theare noises that can influence the decision as it was http://www.reconnsworld.com/audio_simplepr
demonstrated with finger snapping. There are probably eamp.html.
other similar noises that can be mixed up with a 10. Gentleman, W.M. and G. Sande, Fast Fourier
whistle sound using frequency spectrum analysis. A Transforms: for fun and profit, in AFIPS Joint
more thorough investigation is necessary for finding Computer Conferences. 1966: San Francisco,
those sounds although parameter tuning is important in California p. 563-578.
order to constrain the value margins.
Another important finding was the fact that this
method cannot easily distinguish between slightly
different referee whistles unless their frequencies are
strongly different.
The accomplished system is very light, compact
and low power consumption. Those were the main
objectives of this work. This innovative approach has
also proven reliable and robust to noise.
The application aim for this system will be for
robotic football. However, it can be easily adapted to
identify other sounds. This technique can be applied
largely on other types of sound detection.
REFERENCES
1. Nilsson, M., et al., Human Whistle Detection
and Frequency Estimation, in Proceedings of
the 2008 Congress on Image and Signal
Processing, Vol. 5 - Volume 05. 2008, IEEE
Computer Society.
2. Gales, M. and S. Young, The Application of
Hidden Markov Models in Speech
Recognition, in Foundations and Trends in
Signal Processing. 2008. p. 195–304.
3. Team, M.R. Whistle Recogniser for
RoboCup. Politecnico di Milano - Dept. of
Electronics and Information - AIRLab -
Artificial Intelligence and Robotics
Laboratory 2007; Available from:
http://robocup.ws.dei.polimi.it/MRT/Projects/
WR/HtmlDoc/index.htm.
4. Harison, A. and C. Shah. Voice Recognition
Robotic Car. 2007; Available from:
http://courses.cit.cornell.edu/ee476/FinalProje
cts/s2006/avh8_css34/avh8_css34/index.html.
5. Constantino, M.G. and G.V.J.d. Silva, The
Fourier transform (FFT) in basic. 2000,
Departamento de Química - Faculdade de
Filosofia, Ciências e Letras de Ribeirão Preto
- Universidade de São Paulo, Brasil: São
Paulo, Brasil.
6. Salvador, B. Tutorial para Cursos a Distância
- Sons digitalizados - UNIFESP -
Departamento de Informática em Saúde.
2010; Available from:
http://www.virtual.epm.br/material/ead/som.h
tm.
7. Wikipedia. Electret microphone. 2010;
Available from:
http://en.wikipedia.org/wiki/Electret_microph
one.
8. Hosiden, Acoustic Components and
Accessories. 2010, Hosiden - Electronic
Components.
9. Wilson, A. Reconn's World - Simple Audio
Pre-Amplifier. 2010; Available from:You can also read