Dynamic variations in salinity and potassium grade of a potassium rich brine deposit in Lop Nor basin, China - Nature
←
→
Page content transcription
If your browser does not render page correctly, please read the page content below
www.nature.com/scientificreports
OPEN Dynamic variations in salinity
and potassium grade
of a potassium‑rich brine deposit
in Lop Nor basin, China
Lichun Ma1*, Kai Wang1,2, Yu Zhang1, Qingfeng Tang3 & Hui Yan4
The Quaternary Lop Nor playa is the largest production base of potassium sulfate in the world. It has
a mining history of more than 10 years, and its share in the Chinese potassium sulfate market is about
50% to-date. In this basin, the high-salinity potassium-rich brines are mainly contained in Middle
Pleistocene–Holocene glauberite strata. Based on the monitoring of the underground brine table and
geochemical analysis, this study reveals variations in the underground brine table and potassium-
bearing grade before and after large-scale mining in the Lop Nor potash deposit. The results showed
that the underground brine table and potassium sulfate grade decreased by varying degrees over
sub-mineral areas after large-scale mining. The underground brine table declined by 8.5 m, on
average, in the Luobei depression, by 6.4 m in the Tenglong platform and by 1.9 m in the Xinqing
platform. However, the potassium-bearing grade showed the different trend. The Tenglong platform
had the largest decline with average decreases in layers W1, W2 and W3 of 18.2%, 13.0% and 24.8%,
respectively. In the Xinqing platform, the average decrease in layersW2 and W3 were 17.4% and 16.0%
respectively. The Luobei depression decreases were relatively small (W1, W2 and W3 decreased 4.3%,
4.2% and 3.1%, respectively). This research provides a theoretical basis for the rational development
and sustainable use of the potassium-rich brines in the Lop Nor basin.
The Lop Nor playa is located in the eastern Tarim Basin (Xinjiang, China) and is a famous Quaternary inland salt
lake that is also the largest single liquid deposit of potassium sulfate in the world. The high-salinity potassium-
rich brine is mainly contained in Middle Pleistocene–Holocene glauberite strata. The SDIC Xinjiang Lop Nor
Potash Co., Ltd. (abbreviate: SLNP), founded in 2000, has the exploration and mining rights for the potash
deposit. In 2003, SLNP carried out mining tests in the hinterland of Lop Nor basin. At the end of 2005, it reached
an annual production capacity of 100,000 tons of potassium sulfate and in 2012, it achieved an annual output of
1.37 million tons. In 2017, it reached 1.5 million tons of production capacity. At present, its share in the Chinese
potassium sulfate market is about 50%.
Since the discovery of potassium-rich brine deposits in the Lop Nor basin, there has been a lot of research
in the area. In the past 30 years, researchers have made great progress in metallogenic conditions and sedi-
mentary environment a nalysis1–6, ore deposit characteristic and g enesis2,7,8, geochemical characteristics of the
potassium-rich brine reservoir b ody2,9 and mining process and t echnology10–13. However, there are few studies
on the dynamic variations in the geochemistry of potassium-rich brine deposits in Lop Nor basin14. In 2006,
2009 and 2010, general exploration of all three sub-mineral areas (Luobei depression, and Tenglong and Xinqing
platforms) in Lop Nor basin was carried out. Exploration obtained a large amount of drilling and brine chemistry
data, which laid the foundation for this research. Based on the geochemical analysis of different ore horizons
from the early general exploration reports15–17 and the brine samples and chemical data collected in the mining
area in 2017, this study conducted a comprehensive comparison. It revealed the temporal and spatial variations
of the brine mineralization and potassium grade in different ore horizons before and after large-scale mining
in Lop Nor basin. Our results provide a theoretical basis for the rational development and sustainable use of
potassium-rich brines in Lop Nor basin.
1
MNR Key Laboratory of Metallogeny and Mineral Assessment, Institute of Mineral Resources, Chinese Academy
of Geological Science, Beijing 100037, China. 2China University of Geosciences(Beijing), Beijing 100083,
China. 3Beijing Centre for Physical and Chemical Analysis, Beijing 100089, China. 4SDIC Xinjiang Lop Nor Potash
Co., Ltd., Hami 839000, China. *email: mlichun@cags.ac.cn
Scientific Reports | (2021) 11:3351 | https://doi.org/10.1038/s41598-021-82958-y 1
Vol.:(0123456789)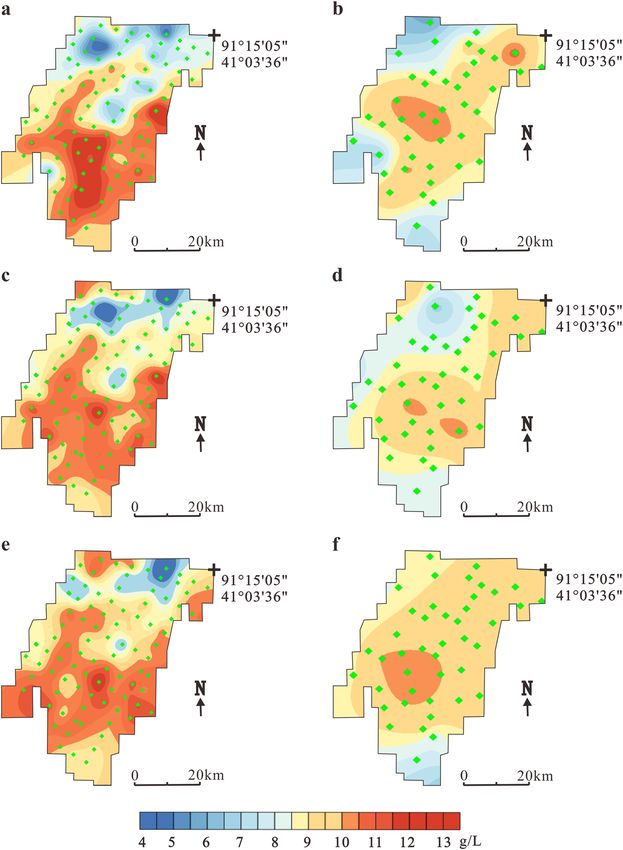
www.nature.com/scientificreports/
Figure 1. Simplified geological map of the Lop Nor area in Xinjiang Province, China.
Regional geological background
Lop Nor is located at the intersection of the Altun and Beishan tectonic belts in the eastern part of the Tarim
platform. The northern and southern basin boundary is controlled by the Kongque River fault and the Altun
fault, respectively13 (Fig. 1). The regional tectonic environment is complex, the basement is fractured and the
inheritance and neotectonic activity are strong. The fault structure generally restricts the formation and devel-
opment of Lop Nor Salt L ake2. Since the end of the Neogene, the Lop Nor area has been controlled by tectonic
movement5; it began to settle and gradually developed into the lowest depression of the basin. Glacial meltwater,
originating from the Tianshan, Kunlun and Altun Mountains, eventually gathered in the Lop Nor b asin13; the
water area once reached 20,000 km2. Therefore, the Lop Nor Lake played an important role as a catchment center
of the whole Tarim basin throughout the Quaternary by accumulating a large amount of salt in the basin13. At
present, the lake has completely dried up with a salt cover spanning 10,000 km2; the salt deposit is more than
200 m thick. Potassium-rich brines are found in these Quaternary salt strata in the northern Lop Nor basin.
The potassium-rich brine deposit consists of three sub-mineral areas from west to east, including the Xin-
qing platform, Luobei depression and Tenglong platform. The boundary between the sub-mines and the brine
reservoir is mainly controlled by faults. According to the fault direction, the system can be roughly divided
into three groups: faults in the NNE, faults near the EW and faults in the NEE. The faults in the NEE are the
most developed and include the F4 fault, which is between the Xinqing mining area and the Luobei depression,
and the F6 fault, which is the boundary of the Luobei depression and the Tenglong p latform14. The F1 fault is a
regional compression–torsion fault, which passes through the Tenglong mining area and cuts it into two parts,
north and south14 (Fig. 1).
Luobei depression is located in the middle of the whole mining area. It is about 60 km long from north to
south, 32.5 km wide from east to west, and has an area of about 1534 km2 (Fig. 1). The overall terrain is lower
than the Tenglong and Xinqing platforms to the east and west with an average altitude of about 780 m, and the
surface is covered by salt crusts. The thickness of the salt strata ranges from about 30–200 m, and the average
thickness is about 100 m. The salt system tends to thicken from south to north and the thickness also gradually
increases from west to east15.
The Tenglong platform is about 70–90 km long from north to south and about 20–25 km wide from east
to west with an area of about 1623 km2 (Fig. 1). The surface is mainly a Yadan landform and the terrain is
higher than the Luobei depression, with a maximum altitude of 790 m and a minimum altitude of 780 m (aver-
age = 785 m). The thickness of the salt-bearing strata in the northern part of the Tenglong platform is generally
30–50 m (average = 36 m) with a maximum thickness of 69.6 m. The thickness gradually increases from north
Scientific Reports | (2021) 11:3351 | https://doi.org/10.1038/s41598-021-82958-y 2
Vol:.(1234567890)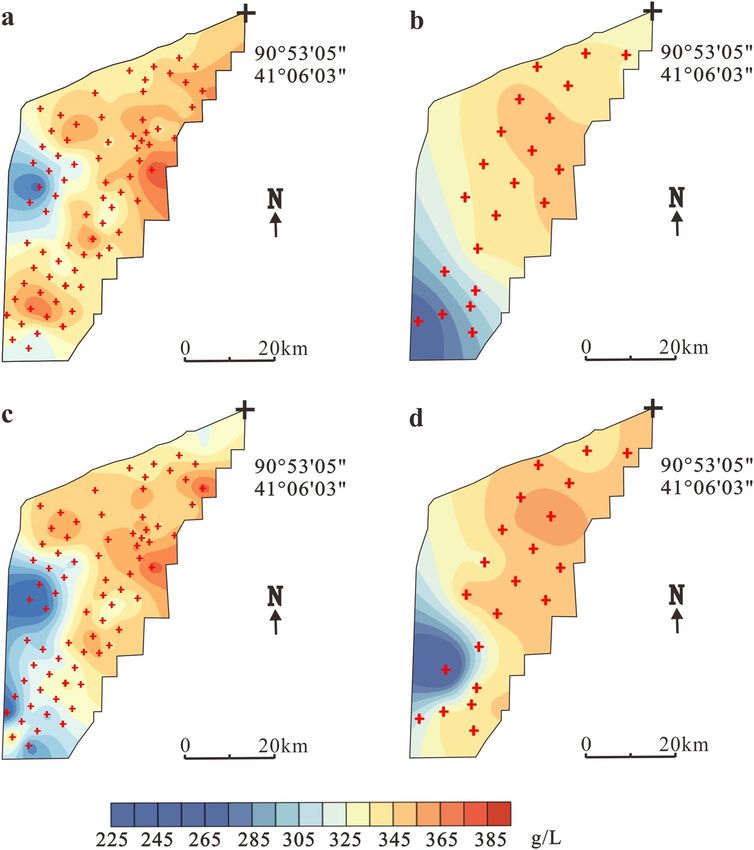
www.nature.com/scientificreports/
(12 m) to south (60 m) and from east (20 m) to west (60 m). The thickness of the salt-bearing strata is generally
5–20 m south of the F1 fault, and gradually increases from south to north (4–12 m) and decreases from east to
west with a thick middle area16.
Xinqing platform is about 60–80 km long (north–south) and 10–20 km wide (east–west) with an area of
about 1447 km2 (Fig. 1). The surface is mainly a Yadan landform and the terrain is relatively high (highest
altitude = 795 m, lowest altitude = 780 m) with an average elevation of 789 m. The accumulated thickness of the
salt-bearing strata in the Xinqing platform is about 30–50 m. It gradually thickens from south to north, as well
as west to e ast17.
The whole Lop Nor playa currently has no surface water system. It mainly receives bedrock fissure water and
groundwater recharge from Kuluktag Mountain, Beishan Mountain and the Altun Mountains. It also receives
lateral recharge from the eastern Archik Valley, as well as the western Kongque River and Tarim River dry deltas
(Fig. 1). Down the regional hydrologic gradient, as groundwater moves from the outer fringes to the center of
the playa, its salinity gradually increase, reaching a maximum of roughly 350 g/L.
Methods
Sampling and analysis. In 2003, SLNP conducted a mining test in the Lop Nor playa. The underground
brine was pumped to the surface through a shaft system, and then transported through a brine channel to the
solar pond for salt drying and classification. Following an economic feasibility analysis, the current four-layer
brine (top to bottom: W1, W2, W3 and W4) was mainly mined within 90 m. However, the amount mined early
on was relatively small. At the end of 2005, the production capacity was only 100,000 tons (K2SO4) per year. The
potassium sulfate project goal of 1.2 million tons per year started ran until November 2008. In November 2011,
the monthly design production capacity was reached. This meant that large-scale brine mining had not been
carried out in the Lop Nor playa before 2011. To find the potash reserves in the mining area, SLNP carried out
general exploration operations in July 2006, March 2009 and August 2010 in the Luobei depression, Tenglong
platform and Xinqing platform, respectively. The exploration data provided the basis for the study of geochemi-
cal variations before and after large-scale mining in the Lop Nor basin.
The chemistry analysis from the three sub-mines areas used in this study was derived from the general
exploration reports from 2006, 2009 and 201015–17. Data were generated from 88 brine samples collected in
July–August 2017 through observation holes in the mine area. Two bottles (500 mL each) were used to sample
each observation hole. The brine depth and density were measured on site and the bottles were sealed quickly
after measurements to prevent the brine from evaporating or leaking during transport. GPS data were used for
geolocation and elevation measurements.
The brine samples taken in 2017 were sent to the National Geological Experiment and Test Center (Chi-
nese Academy of Geological Sciences) for the analysis of major components ( Na+, K+, Mg2+, Ca2+, Cl−, SO42−,
CO32− and HCO3−) and trace elements (Li+, B3+, Br−, I−, Rb+, Cs+ and Sr2+) in which K+, Na+, Mg2+, Ca2+, Li+, B3+,
Rb+, Cs+ and S r2+ were determined by atomic absorption spectrophotometry (RSD < 2%), Cl− and S O42− were
determined by ion-chromatography (RSD < 2%). Titrimetric methods were used for the determination of B r−,
− 2− −
I , CO3 and HCO3 (RSD < 5%).
Mapping methods. According to the brine chemistry analysis and the groundwater table data, a spatial
distribution map of brine geochemistry and groundwater drawdown in different ore horizons of the three sub-
mining areas were drawn by Kriging interpolation in the software Surfer.
Results and discussion
Lop Nor is a typical liquid deposit of potassium sulfate. Based on the Valyashko classification s ystem18, the water
chemistry type is mainly a magnesium sulfate subtype and, secondly, a sodium sulfate subtype. The current brine
salinity range is about 226–393 g/L and the average grade of KCl is about 1.36%. The brine reservoir is mainly
located in the glauberite layer, then the coarse clastic layer and a very small amount is in the halite and gypsum
layer. The number of potassium-rich brines layers is different in each sub-mineral area, which is controlled by the
structure and fault system of the mining area. There are seven brine layers ( W1–W7) within 250 m depth in the
Luobei depression, including one layer of phreatic water and six layers of confined water (Fig. 2). The Xinqing
mining area has two layers of confined water (Fig. 2). The Tenglong mining area has three potassium-rich brine
layers, including a phreatic water layer and two confined water layers (Fig. 2). The Location of cross-section
A–A′ is shown in Fig. 1.
According to analyses of principal and trace elements from the brine samples collected in 2017, the available
elements in the brine of the Lop Nor playa included elemental B in addition to K, and the content of B2O3 in the
brine varied from 277.3 to 755.6 mg/L, which is greater than the comprehensive utilization grade (150 mg/L).
However, B has not been exploited yet, so it will not be discussed in this study.
Luobei depression. Luobei depression is the main storage area for potassium-rich brine. Through explora-
tion in 2006, it was found that the KCl (122b + 333) specific yield reserve in the elevation range of 628–786 m was
8384.84 million tons15, and long-term observation holes were established for monitoring variations in chemical
and physical properties and the water table of the underground brine in three main ore layers (W1, W2, W3).
In 2006, the burial depth of the ore layer W1, W2, W3 and W4 was 1.7–2.3 m, 20–40 m, 40–60 m and 55–75 m
respectively. After 11 years of mining, the brine table of layer W
1 decreased by 8.5 m on average. Figure 3 shows
the comparison of the salinity in three ore layers from 2006 and 2017, including the temporal and spatial varia-
tions in brine salinity before and after 11 years of mining in the Luobei depression.
Scientific Reports | (2021) 11:3351 | https://doi.org/10.1038/s41598-021-82958-y 3
Vol.:(0123456789)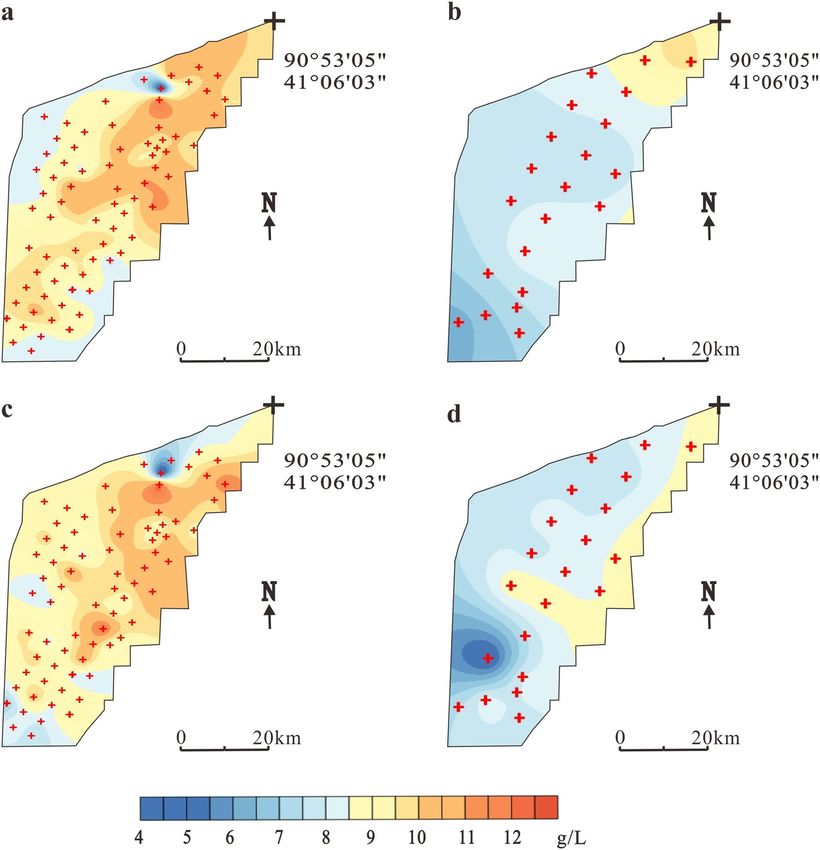
www.nature.com/scientificreports/
Figure 2. Cross-section of the potassium-rich brine deposit in Lop Nor basin.
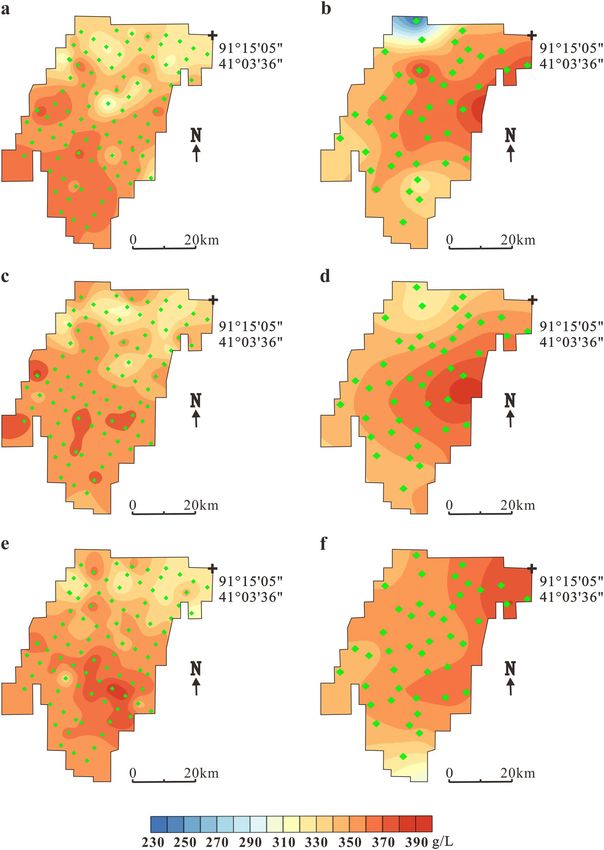
In 2006, the salinity of the ore layer W 1 in the Luobei depression was 295.9–387.8 g/L and the average
salinity was 348.8 g/L15 (Fig. 3a). The low-salinity area is located in the northern part of the mining area with
higher values located in the south. After 11 years of mining, the salinity ranged from 234.7 to 387.4 g/L and was
significantly reduced in the northern and southwestern regions, which may have been caused by the recharge
of freshwater from the northern piedmont zone and the western dry delta. The high-salinity area is offset to
the northeast, which means that the underground brine formed a new flow field and the concentration center
moved to the Tenglong platform (Fig. 3b). Ore layers W 2 and W 1 showed the same trends; in 2006, the salinity
in W2 was 310.3–387.6 g/L, but in 2017, the salinity was changed to 316.9–367.7 g/L. The concentration center
also migrated from the south–central part of the mining area to the east. After years of mining, the brine in the
north, west and southwest is obviously depleted (Fig. 3c, d). The salinity of layer W
3 in the south was also higher
than in the north. The highest value was 389.4 g/L and the lowest value was 307.2 g/L with an average salinity of
352.1 g/L (Fig. 3e). After mining, the salinity varied between 344.5–380.6 g/L and the high-salinity area moved
to the north where brine salinity increased obviously. This may be because of high-salinity brine recharge from
the eastern and western platforms after the formation of new flow fields. As the depth increased, W 3 was not
significantly affected by freshwater from the northern piedmont zone and western deltas (Fig. 3f).
+ content in three ore layers in 2006 and 2017 is shown in Fig. 4. In 2006, the K
The spatial distribution of K +
content of W1 in the Luobei depression increased from 4.41 to 13.4 g/L with an average content of 9.4 g/L. The
main high-value area is located in the southern part of the mining area. The K+ content in the northern part of
the mining area was relatively low (5.5–8 g/L), which may be related to the recharge of the bedrock fissure water
from Kuluktag Mountain in the north(Fig. 4a). After 11 years of mining, in 2017, the K+ content changed to
5.9–10.9 g/L (average = 9.0 g/L), which was an average decrease of 4.3%. The main high-value area shrunk and
was located in the central and northeastern parts of the mining area (Fig. 4b).
In 2006, the K + content of W2 was 6.9–12.3 g/L with an average of 9.5 g/L. The K + distribution was similar
to W1. The high-value area is mainly located in the southern part of the mining area, and the low-value area is
located in the north (Fig. 4c). After mining, the K + content was 6.67–10.3 g/L (average = 9.1 g/L), which was a
decline of about 4.2%, and the high-value area shrunk from the south–central part of the mining area to the
southeastern part (Fig. 4d). Before mining ore layer W3, the distribution of K+ was similar to W1 and W2 in that
it was also characterized by a low-value north and a high-value south. The K+ content varied from 6.9 to 12.4 g/L
with an average of 9.8 g/L (Fig. 4e). After mining, the K + content generally changed to 8.2–10.4 g/L and the aver-
age content decreased from 9.8 to 9.5 g/L, a decline of 3.1% (Fig. 4f).
Tenglong platform. The Tenglong mining area exposed three layers of potassium-rich brine, including a
phreatic water layer and two confined water layers. The phreatic brine ore body is the main ore body of the Ten-
glong mining area. It is buried at shallow depth with the water table at about 0.7–4.0 m. However, the phreatic
brine ore body is bounded by a fracture (F1) and only present in the northern part of the Tenglong mining area.
The burial depth of the confined brine layer W2, W3 was about 15–30 m, 20-40 m respectively.
In March 2009, exploration determined a specific yield reserve of KCl (122b + 333) of 26.53 million tons at
707–787 m elevation16. Figure 5 shows a comparison of the salinity of three ore layers in 2009 and 2017, specifi-
cally the temporal and spatial variations in salinity before and after large-scale mining in the Tenglong mining
area.
The salinity of horizon W1 in the Tenglong mining area in 2009 was 344.5–390.1 g/L with an average value of
365.3 g/L16 (Fig. 5a). The high-salinity area is mainly located in the middle of the mining area and the low-value
area is located in the southwest and north. After 8 years of mining, the salinity trends were basically the same,
the values changed from 329.2 to 379.4 g/L (Fig. 5b). In 2009, the salinity of horizon W 2 changed from 342.7
to 391.5 g/L (average = 366.9 g/L). The high-value area was distributed in the east–central and south areas, and
low salinity is mainly concentrated in the northern part of the mining area (Fig. 5c). In 2017, after mining, the
salinity range changed to 331.2–387.7 g/L and the southeastern part of the mining area was obviously diluted
Scientific Reports | (2021) 11:3351 | https://doi.org/10.1038/s41598-021-82958-y 4
Vol:.(1234567890)
www.nature.com/scientificreports/
Figure 3. Temporal and spatial variations in the salinity of different brine layers in Luobei depression. (a) Layer
W1 in 2006, (b) Layer W1 in 2017, (c) Layer W2 in 2006, (d) Layer W2 in 2017, (e) Layer W3 in 2006 and (f)
Layer W3 in 2017. The green dots indicate observation holes locations.
Scientific Reports | (2021) 11:3351 | https://doi.org/10.1038/s41598-021-82958-y 5
Vol.:(0123456789)
www.nature.com/scientificreports/
Figure 4. Temporal and spatial variations in K+ content of different brine layers in Luobei depression. (a) Layer
W1 in 2006, (b) Layer W1 in 2017, (c) Layer W2 in 2006, (d) Layer W2 in 2017, (e) Layer W3 in 2006 and (f)
Layer W3 in 2017. The green dots indicate observation holes locations.
Scientific Reports | (2021) 11:3351 | https://doi.org/10.1038/s41598-021-82958-y 6
Vol:.(1234567890)
www.nature.com/scientificreports/
Figure 5. Temporal and spatial variations in salinity of different brine layers in Tenglong platform. (a) Layer W1
in 2009, (b) Layer W1 in 2017, (c) Layer W2 in 2009, (d) Layer W2 in 2017, (e) Layer W3 in 2009 and (f) Layer
W3 in 2017. The black crosses indicate observation holes locations.
Scientific Reports | (2021) 11:3351 | https://doi.org/10.1038/s41598-021-82958-y 7
Vol.:(0123456789)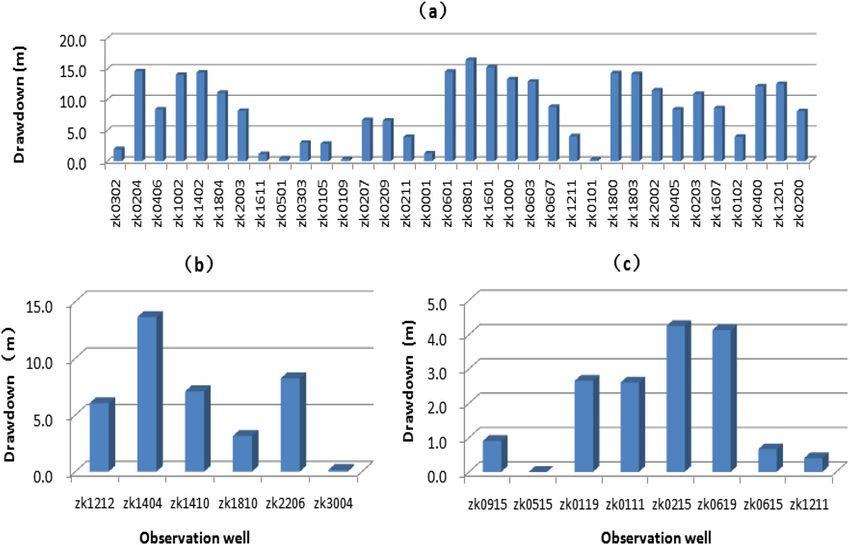
www.nature.com/scientificreports/
(Fig. 5d). Horizons W 3, W1 and W
2 showed a consistent distribution trend before and after mining. The post-
mining salinity range was reduced from 343.9–397.7 to 290.9–353.7 g/L, a decline of 8.4% (Fig. 5e, f).
Figure 6 compares the spatial distribution of K + content before and after mining in the Tenglong platform.
The K+ content in W1 in 2009 changed from 8.9 to 12.9 g/L with an average content of 11.0 g/L (Fig. 6a). After
mining, the whole area showed a downward trend. The K + content changed to 8.2–9.8 g/L with an average content
+ content of horizon W
of 9.0 g/L, a drop of 18.2% (Fig. 6b). In 2009, the K 2 was 4.3–13.1 g/L (average = 10.8 g/L).
The high-value area was distributed in the south–central and northern parts of the mining area (Fig. 6c). After
mining, the K+ content changed to 8.3–10.3 g/L (average = 9.4 g/L), an average reduction of 13%, especially in the
northern and southeastern parts of the mining area (Fig. 6d). In 2009, the spatial distribution of K + in W
3 was
similar to W2. The K+ content varied from 7.7 to 12.3 g/L with an average of 10.9 g/L (Fig. 6e). The K+ content
after mining ranged from 6.5 to 9.3 g/L (average = 8.2 g/L), which represented a drop of 24.8%; the largest decline
was in the north and southeast (Fig. 6f).
Xinqing platform. The study revealed two layers of potassium-rich brine ore, both of which are confined
water layers. General exploration was carried out in August 2010, which reported a KCl (122b + 332 + 333) spe-
cific field reserve of 7.60 million tons in elevations ranging from 742 to 800 m17. The burial depth of the ore layer
W2, W3 was about 10–20 m, 11.3–38 m respectively. Salinity comparisons in 2017 are shown in Fig. 7.
In 2010, the salinity of W2 in Xinqing platform was 268.6–374.0 g/L and the average value was 345.9 g/L17
(Fig. 7a). The high-salinity area is mainly located in the middle and eastern area, while the low-salinity area is
located in the west and results from the lateral recharge of the Tarim River delta. After 7 years of mining, the
whole mining area was desalinated and the salinity changed to 258.7–351.0 g/L, particularly in the southeastern
part (Fig. 7b). The changes in the W 3 layer before and after mining are consistent with W 2. The mineraliza-
tion degree of W3 in 2010 was 251.6–381.7 g/L (average = 333.5 g/L). After mining, the salinity decreased to
226.1–366.1 g/L. The high-value area moved to the northeast and the southeastern area faded significantly
(Fig. 7c, d). At the same time, the K+ content also changed accordingly. The spatial distribution of K+ in 2010
and 2017 is shown in Fig. 8.
The K+ content of W 2 in 2010 was 4.8–12.4 g/L and the average content was 9.8 g/L (Fig. 8a). The area of
high K+ content is mainly located in the north–central region of Xinqing platform. In the northern mining area,
there were very few samples with the low values, which may have been caused by the replenishment of bedrock
fissure water of the Kuluktag. After 7 years of mining, the K+ content decreased significantly; the K+ content
was 6.3–10.0 g/L (average = 8.1 g/L), which represents an average drop of 17.4%. The northeastern area was the
only region to exhibit high values, while most of the western, central and southern regions were significantly
diluted (Fig. 8b).
Figure 8c shows the spatial distribution characteristics of the K + content in W
3 in 2010. Similar to the dis-
tribution of W2, the K+ content varied from 4.5 to 12.5 g/L (average = 9.4 g/L). After 7 years of mining, the K +
+
content decreased by16% to 4.4–9.0 g/L (average = 7.9 g/L). The K content of the whole mining area decreased
significantly, especially in the southern part, with declines as high as 50% (Fig. 8d).
Underground brine drawdown. To describe variations in the underground brine table before and after
large-scale mining of potassium-rich brine deposits in Lop Nor basin, this study used early monitoring data
from three sub-mine areas. The data showed that the thickness of reservoir W1 in the Luobei depression was
about 15–25 m in 2006. The burial depth was generally 1.7–2.3 m with a maximum of 4.5 m15. After mining,
the brine table dropped significantly. From 2006 to 2017, the maximum brine drawdown reached 16.5 m (mini-
mum = 0.2 m, average = 8.5 m; Fig. 9a).
The Tenglong mining area also experienced a large drop in the water table. In 2009, the average thickness
of reservoir W 1 in the northern part of the Tenglong mining area was 30–50 m, and the burial depth was about
0.7–4.0 m16. The 2017 monitoring data showed that the maximum drawdown was 13.6 m and the minimum
drawdown was 0.2 m (average = 6.4 m; Fig. 9b).
There is no phreatic brine in the Xinqing platform. The shallowest confined brine layer is W2. In 2010, the W2
ore body was buried at a depth of 10–20 m with a thickness of 2–5 m17. After 7 years of mining, the reduction
was small compared with a phreatic brine layer; the maximum drawdown was 4.3 m, the minimum was 0 and
the average was 1.9 m (Fig. 9c).
In general, the Luobei depression had the largest decline of the underground brine table and the drawdown of
the water level in the most areas was greater than 10 m. Additionally, a settlement funnel was formed, centered
on Luobei depression (Fig. 10).
In summary, the factors controlling the brine table drawdown include recharge (lateral subsurface recharge
around the basin, atmospheric precipitation, condensate, and possible recharge from deep source) and discharge
(artifical exploitation and evaporation). When the discharge is greater than the recharge, the groundwater table
will continue to drop. However, the variations of salinity and potassium content are more complicated. It is not
only controlled by the balance of recharge and discharge, but also involves the salt dissolution from evaporate
strata and solute circulation in new flow field. Nevertheless, the artificial exploitation is still the main factor to
control the variations in salinity and potassium content. It is estimated that the amount of underground brine
extracted is ~ 29,600 × 104 m3/a, and the total amount of recharge is only ~ 6700 × 104 m3/a in the Lop Nor p laya15.
The difference between extraction and recharge is about 22,900 × 104 m3/a. If the brine salinity is about 300 g/L
(0.3 ton/ m3), it is estimated that more than 6500 × 104 tons of salt were exported every year. Therefore, the brine
table, salinity and potassium content have decreased significantly after more than 10 years of exploitation.
Scientific Reports | (2021) 11:3351 | https://doi.org/10.1038/s41598-021-82958-y 8
Vol:.(1234567890)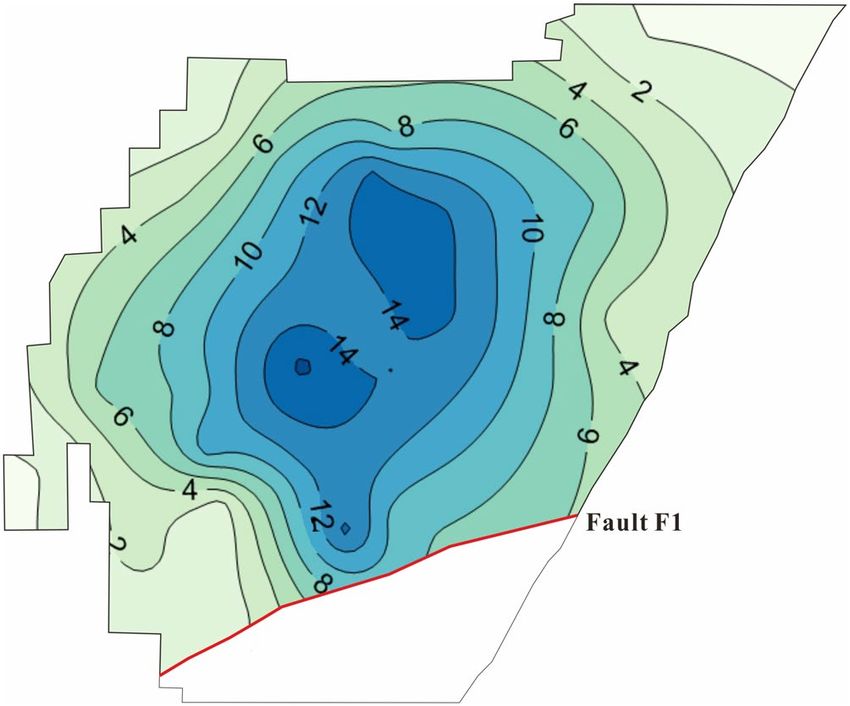
www.nature.com/scientificreports/
Figure 6. Temporal and spatial variations in K + content of different brine layers in Tenglong platform. (a)
Layer W1 in 2009, (b) Layer W1 in 2017, (c) Layer W2 in 2009, (d) Layer W2 in 2017, (e) Layer W3 in 2009 and
(f) Layer W3 in 2017. The black crosses indicate observation holes locations.
Scientific Reports | (2021) 11:3351 | https://doi.org/10.1038/s41598-021-82958-y 9
Vol.:(0123456789)
www.nature.com/scientificreports/
Figure 7. Temporal and spatial variations in salinity of different brine layers in Xinqing platform. (a) Layer
W2 in 2010, (b) Layer W2 in 2017, (c) Layer W3 in 2010 and (d) Layer W3 in 2017. The red crosses indicate
observation holes locations.
Conclusions
China is a large agricultural country with a potash deficiency. At present, the self-sufficiency rate of potash
fertilizer is only 50%. The Quaternary Lop Nor playa is one of the most important potash deposits in China.
Although its mining history is not long, it supplies 50% of the Chinese potassium sulfate market. After more
than 10 years of mining, the underground brine table and the grade of potassium sulfate in each sub-mine of
the Lop Nor potash deposit have declined to varying degrees.
After large-scale mining, the K+ content in the Tenglong mining area decreased the most, followed by Xinqing
and then Luobei. The average K + content of horizon W 1 was 9.0 g/L in the Tenglong area, which represented an
average decrease of 18.2%. The average K + in W +
2 was 9.4 g/L, indicating a decrease of 13%, and the average K
content in W3 was 8.2 g/L (24.8% decline). After mining in the Xinqing mining area, the average K + content in
layer W2 was 8.1 g/L, with an average decline of 17.4%. The average K+ content in layer W3 was 7.9 g/L with a
Scientific Reports | (2021) 11:3351 | https://doi.org/10.1038/s41598-021-82958-y 10
Vol:.(1234567890)www.nature.com/scientificreports/
Figure 8. Temporal and spatial variations in K + content of different brine layers in Xinqing platform. (a) Layer
W2 in 2010, (b) Layer W2 in 2017, (c) Layer W3 in 2010 and (d) Layer W3 in 2017. The red crosses indicate
observation holes locations.
decline of 16.0%; in the southern part of the mining area, the decline was as high as 50%. After mining in Luobei
depression, the average K + content of W1 was 9.0 g/L, showing an average reduction of 4.3%. The average K +
content in W2 was 9.1 g/L (4.2% decline) and 9.5 g/L (3.1% decline) in W 3.
The long-term monitoring data of the underground brine table from observation holes showed that the brine
table of the Luobei depression obviously decreased after mining, with a maximum drawdown of W1 brine reach-
ing 16.5 m (average = 8.5 m). A large drop in the brine level also occurred in the Tenglong mining area where
the maximum drawdown of W 1 was 13.6 m (average = 6.4 m). Xinqing platform did not contain phreatic brine.
Therefore, compared with a phreatic brine layer, the resulting reduction was small and the lowest, shallowest
confined layer (W2) had a relatively small reduction (maximum drawdown = 4.3 m, average = 1.9 m).
The artificial exploitation is the main factor to control the brine table drawdown, the variations in salinity
and potassium content. According to the existing exploitation scale (~ 23,000 × 104 m3/a), the service life of
phreatic brine layer W1 is about 10 years. The resource reserves of confined brine body have not been identified,
and further exploration is quite necessary to ensure the long-term sustainable utilization of the potassium-rich
brines resources in the Lop Nor basin.
Scientific Reports | (2021) 11:3351 | https://doi.org/10.1038/s41598-021-82958-y 11
Vol.:(0123456789)www.nature.com/scientificreports/
Figure 9. The drawdown of potassium-rich brine deposits in Lop Nor basin. (a) The depth of brine drawdown
in Luobei depression. (b) The depth of brine drawdown in Tenglong mining area, (c) The depth of brine
drawdown in Xinqing platform. The abscissa is the observation well number.
Figure 10. The drawdown distribution of potassium-rich brine layer W1 in Luobei depression and Tenglong
mining area. The unit of brine drawdown is meter. The red line indicates the fault.
Received: 9 December 2019; Accepted: 19 January 2021
References
1. Zheng, M. P., Qi, W., Wu, S. Y. & Liu, J. Y. A preliminary study on the sedimentary environment and prospect of potassium explora-
tion in Lop Nur Salt Lake since the late pleistocene. Chin. Sci. Bull. 36(23), 1810–1810 (1991).
2. Wang, M. L. Potash Resources in Lop Nor Salt Lake 1–386 (Geological Publishing House, Beijing, 2001).
3. Zhao, Z. H. et al. Discussion of the lower limit of quaternary in Lop Nur, Xinjiang. J. Arid Land Geogr. 2, 130–135 (2001).
Scientific Reports | (2021) 11:3351 | https://doi.org/10.1038/s41598-021-82958-y 12
Vol:.(1234567890)www.nature.com/scientificreports/
4. Hu, D. S. & Zhang, H. J. Lake-evaporated salt resources and the environmental evolution in the Lop Nur Region. J. Glaciol. Geocryol.
26(2), 212–218 (2004).
5. Lin, J. X. et al. The lithostratigraphy, magnetostratigraphy, and climatostratigraphy in the Lop Nur region. J. Stratigr. 29(4), 317–322
(2005).
6. Ma, L. C., Liu, C. L., Jiao, P. C. & Chen, Y. Z. A preliminary discussion on geological conditions and indicator pattern of Potash
deposits in typical Playas of Xinjiang. Miner. Depos. 29(4), 593–601 (2010).
7. Liu, C. L. et al. Characteristics of diagenesis of the quaternary salt-bearing strata, Lop Nur Lake, Xinjiang. Acta Geosci. Sin. 21(2),
240–246 (2003).
8. Liu, C. L., Wang, M. L. & Jiao, P. C. The probing of regularity and controlling factors of potash deposits distribution in Lop Nur
Salt Lake, Xinjiang. Acta Geosci. Sin. 30(6), 796–802 (2009).
9. Liu, C. L., Wang, M. L., Jiao, P. C., Cheng, Y. Z. & Li, S. D. Formation of pores and brine reserving mechanism of the aquifers in
quaternary potash deposits in Lop Nur Lake, Xinjiang, China. Geol. Rev. 48(4), 437–443 (2002).
10. Cheng, Y. Z., Wang, M. L., Yang, Z. S., Liu, C. L. & Jiao, P. C. The making of potash-bearing salts mixtures through the processing
of magnesium sulfate sub-type Brine in Lop Nur Saline Lake, Xinjiang. Acta Geosci. Sin. 22(5), 465–470 (2001).
11. Gu, X. L., Lu, C. X., Zeng, Y. G. & Song, W. J. Quaternary salt mineral of containing potassium occurrence character analyzing in
Lop Nor Tonlon Terrace. Xinjiang Geol. 27(04), 346–349 (2009).
12. Gu, X. L. et al. Analysis of the developing prospect of the unconfined brine kalium mine in the north hollow of the Lop Nur Region.
Hydrogeol. Eng. Geol. 30(02), 32–36 (2003).
13. Ma, L. C., Lowenstein, T. K., Li, B. G., Jiang, P. A. & Wu, H. Q. Hydrochemical characteristics and brine evolution paths of Lop
Nor Basin, Xinjiang Province, Western China. Appl. Geochem. 25(11), 1770–1782 (2010).
14. Sun, M. G. & Ma, L. C. Potassium-rich brine deposit in Lop Nor basin, Xinjiang, China. Sci. Rep. 8(7676), 1–9 (2018).
15. SDIC Xinjiang Lop Nor Potash Co., Ltd. General Exploration Report on the Potash Deposit in Luobei Depression, Ruoqiang County,
Xinjiang 1–295 (SLNP Press, Hami, 2006).
16. SDIC Xinjiang Lop Nor Potash Co., Ltd. General Exploration Report on the Potash Deposit in Tenglong Platform, Ruoqiang County,
Xinjiang 1–266 (SLNP Press, Hami, 2009).
17. SDIC Xinjiang Lop Nor Potash Co., Ltd. General Exploration Report on the Potash Deposit in Xinqing Platform, Ruoqiang County,
Xinjiang 1–251 (SLNP Press, Hami, 2011).
18. Valyashko, M. G. Geochemical Regularity of Potash Deposit Formation 1–353 (China Industry Press, Beijing, 1965).
Acknowledgements
This work was funded by subject of National Key Research and Development Program of China (No.
2017YFC0602806), Central Public Interest Scientific Institution Basal Research Fund (No. JYYWF2018) and
China Geological Survey project (No. DD20160054). We are grateful to Mr. Wenxue Li, Mr. Baocheng Ma and
Mr. Baoheng Yang from SDIC Xinjiang Lop Nor Potash Co., Ltd for their help with field work. We thank Kara
Bogus, Ph.D., from Liwen Bianji, Edanz Editing China (www.liwenbianji.cn/ac), for editing the English text of
a draft of this manuscript.
Author contributions
L.M. designed the research in the manuscript. L.M., K.W., Y.Z., Q.T. and H.Y. participated in sample collection
and processing. L.M. and K. W. wrote the first draft and prepared all figures. All authors reviewed the manuscript.
Competing interests
The authors declare no competing interests.
Additional information
Correspondence and requests for materials should be addressed to L.M.
Reprints and permissions information is available at www.nature.com/reprints.
Publisher’s note Springer Nature remains neutral with regard to jurisdictional claims in published maps and
institutional affiliations.
Open Access This article is licensed under a Creative Commons Attribution 4.0 International
License, which permits use, sharing, adaptation, distribution and reproduction in any medium or
format, as long as you give appropriate credit to the original author(s) and the source, provide a link to the
Creative Commons licence, and indicate if changes were made. The images or other third party material in this
article are included in the article’s Creative Commons licence, unless indicated otherwise in a credit line to the
material. If material is not included in the article’s Creative Commons licence and your intended use is not
permitted by statutory regulation or exceeds the permitted use, you will need to obtain permission directly from
the copyright holder. To view a copy of this licence, visit http://creativecommons.org/licenses/by/4.0/.
© The Author(s) 2021
Scientific Reports | (2021) 11:3351 | https://doi.org/10.1038/s41598-021-82958-y 13
Vol.:(0123456789)You can also read