ALS Patient Stratification Analysis - Disease Study - PrecisionLife
←
→
Page content transcription
If your browser does not render page correctly, please read the page content below

Disease Study
ALS Patient Stratification Analysis
ALS Patient Stratification Analysis

    Executive Summary
    PrecisionLife is a precision medicine company that        highly associated with these ALS cases. Biological
    has developed a unique multi-omic analytics platform      analysis of the genes revealed that many have a
    to screen genomic, phenotypic, and patient health         plausible mechanistic connection to the regulation of
    datasets, providing novel insights into the signatures    neurodegenerative disease processes. When patients
    driving complex diseases. The PrecisionLife®              were clustered by their genetic variants, we identified
    platform finds and statistically validates combinations   three distinct patient clusters in each cohort.
    of features that together are strongly associated
    with a specific disease diagnosis or other clinical       Using additional phenotypic and clinical data,
    phenotype (e.g. fast disease progression or therapy       including disease severity, age of death, and ALS
    response). These features include significant new         subtype diagnosis, we were able to infer clinical
    findings that would not have been identified using        differences between the three patient clusters found
    standard analysis techniques such as Genome-Wide          in each cohort. This included a severe disease
    Association Studies (GWAS).                               patient cluster that had a significantly earlier age of
                                                              death and a greater degree of functional impairment.
    PrecisionLife used genetic data from 1,386 UK             Our analysis indicates that we can stratify patients
    amyotrophic lateral sclerosis (ALS) patients found        into clinically relevant subgroups based on their
    in the Project MinE dataset. These patients were          genetic differences, even in such a complex and
    split into two distinct cohorts based on the single       heterogeneous disease as ALS. The statistical
    nucleotide polymorphism (SNP) array used for              significance of these findings could be greatly
    genotyping, and analyzed separately against healthy       enhanced with access to larger patient datasets with
    matched controls. The PrecisionLife platform              greater numbers of each ALS subtype.
    identified 24 risk-associated genes that were

Background
ALS, also known as motor neurone disease (MND), is a          well as age of onset and death.4 Disease progression
progressive neurological disease that is characterized        rates can be measured using the Revised ALS Functional
by degenerative changes in the upper and lower motor          Rating Scale (ALSFRS-R), which estimates the patient’s
neurons, resulting in loss of muscle control. It is a fatal   degree of functional impairment.5
disease, affecting approximately one in every 100,000
people.1 Patients have a mean survival from onset of          The genetic causes of each of these subtypes and
symptoms of 3–5 years, with outlier cases of 12–18            the reasons for differing prognoses are still poorly
months or up to 10 years.2                                    understood. We used our unique combinatorial approach
                                                              to identify novel risk-associated genes in two ALS
ALS can be classified into several different                  cohorts, and clustered these cohorts based on their
subtypes, often depending on the site of onset of             genetic signatures. This was designed to reveal new
neurodegeneration. These include primary lateral              genetic insights into the underlying causes of different
sclerosis (PLS), which affects the upper motor neurones;      ALS subtypes and varying disease progression rates.
progressive bulbar palsy (PBP), which targets patients’       High-resolution patient stratification analysis can also be
speaking, swallowing, and mouth function; and                 used to identify subsets of patients most likely to respond
progressive muscular atrophy (PMA), which causes              to existing ALS drugs, and inform the selection of novel
deterioration of the lower motor neurones first.3 These       drug targets/lead compounds based on significant genes
subtypes all have different characteristics, including        found in each subpopulation.
differential disease progression rates and severity, as

Methodology
We analyzed two ALS patient cohorts found in the Project      Additional clinical and phenotypic data was available for
MinE dataset6 from the UK against controls matched for        1,386 of these genotyped ALS patients from the Motor
age, gender, and geographical region (see Table 1). These     Neuron Disease Association (MNDA). This included
cohorts were genotyped using different SNP chips (UK2         information about the ALS type (sporadic or familial),
and UK3). The two SNP arrays only had 242,215 SNPs            ALS diagnoses (ALS probable or definite, PBP, PMA, or
(~50%) in common, and so the two patient cohorts were         PLS), age of onset, diagnosis, ALSFRS-R measurement,
analyzed separately against controls in order to include      and death (if deceased) for patients. Data was also
the maximum number of SNPs available on each chip.            available for patients’ ethnicity, diagnosis of other

                                                                                    © PrecisionLife Ltd 2021 All rights reserved | 2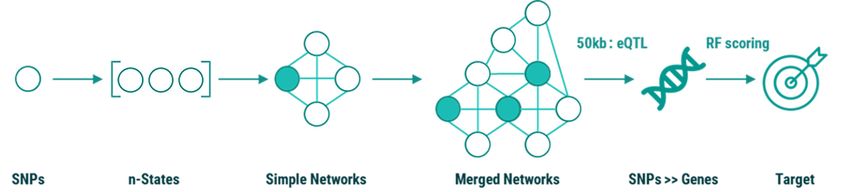
neurodegenerative diseases in the patient or their family                from the genetic data for the two ALS
members, site of disease onset, and survival measures.                   cohorts. When used to analyze genomic
The distribution of gender and ALS diagnosis of patients                 data from patients, the PrecisionLife platform
in the two cohorts is shown in Figure 1. Only the patients               can identify high-order, epistatic interactions
from each cohort with this additional clinical and                       comprising multiple, consistently co-associated
phenotypic data were included in the analysis (Table 1).                 SNP genotypes. This analytical platform has been
                                                                         validated in multiple disease populations.7, 8, 9 Terminology
We used the PrecisionLife combinatorial multi-omics                      and examples for the mining and analysis process are
platform to identify disease-associated SNPs and genes                   given in the Appendix.

Table 1 Characteristics of two ALS patient cohorts from the UK in Project MinE

                                                    ALS Cohort 1 (UK2 Chip)                          ALS Cohort 2 (UK3 Chip)

    Cases with phenotypic data                      610 (378 male, 219 female)                      736 (438 male, 291 female)

               Controls                                         1,046                                             1,472

                 SNPs                                          504,559                                           452,086

                                                           Sporadic—589                                     Sporadic—720
                                                            Familial—8                                       Familial—0
          ALS type in cases                                  PBP—29                                           PBP—26
                                                             PLS—11                                           PLS—30
                                                             PMA—31                                           PMA—29

        Cases with dementia                                       1                                                  1

       Cases with Alzheimer’s                                     1                                                  0

Figure 1 Distribution of gender and ALS diagnosis for patients in (a) ALS Cohort 1 (UK2 chip); and (b) ALS Cohort 2 (UK3 chip)

                                                                                                © PrecisionLife Ltd 2021 All rights reserved | 3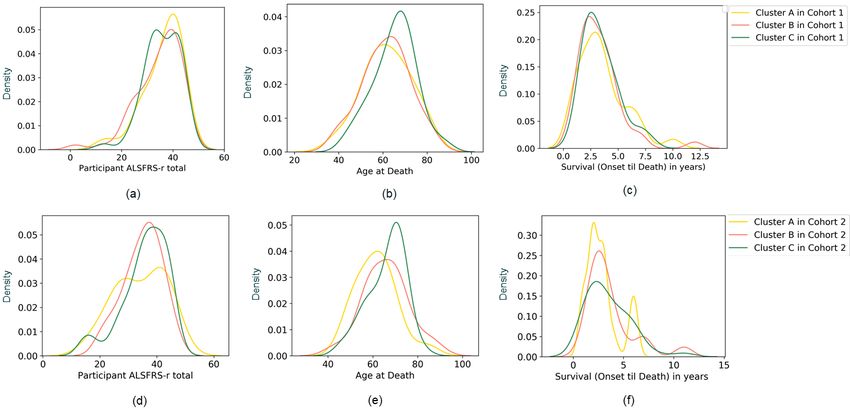
The analysis and annotation of the ALS-associated                     The SNP disease signatures identified
combinatorial genomic signatures (up to five SNP                      were also clustered based on the patients
genotypes in combination, using a False Discovery Rate                they co-occur in, creating an overall architecture
of 5%) for the datasets took less than three days to                  of the disease (see Figure 4, in Results).
complete on a dual CPU, 4-GPU compute server.
                                                                      The phenotypic and clinical data for each of these
The combinatorial SNP signatures identified by the                    patients was used to provide additional insights into
analysis were then mapped to the human reference                      the results generated. For categorical variables such as
genome10 to identify disease-associated and clinically                ALS type and gender, the clinical characteristics of each
relevant target genes. A semantic knowledge graph                     patient cluster were inferred based on the deviation of the
derived from over 40 public and private data sources was              proportion of a particular phenotype for each cluster from
used to annotate the SNP and gene targets, including                  the expected proportion in the entire cohort (see Figures
relevant tissue expression, chemical tractability for gene            7 and 8, in Discussion). For continuous variables such
targets, functional assignment, and disease-associated                as age of onset, ALSFRS-R measurements, and survival
literature. This helps us to identify the most tractable              measures, the distribution of values were compared (see
targets for drug discovery and identify combinations of               Figure 6, in Discussion).
genes that appear to have shared biological mechanisms.

Results
When applying the standard techniques used in GWAS                    However, using the same datasets, the PrecisionLife
for identifying genetic variants in a disease population,11           combinatorial analysis platform identified 201
no significant SNPs could be identified for the two UK                combinations of SNP genotypes that were highly
ALS cohorts with a genome-wide significance threshold                 associated with ALS patients in Cohort 1 and 74
of p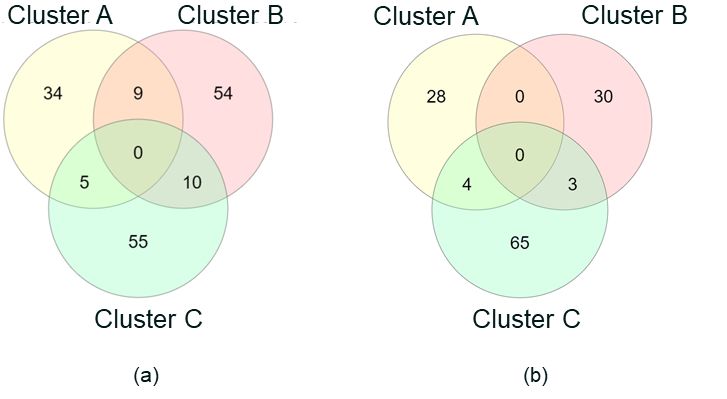
Table 2 Summary of the PrecisionLife results from the two ALS Cohorts from the UK, showing number of
combinatorial disease signatures, SNPs, and genes identified in the studies using a 5% False Discovery Rate
ALS Cohort 1 (UK2 Chip) ALS Cohort 2 (UK3 Chip)
Combinatorial disease signatures 201 74
SNPs in all disease signatures 190 97
Penetrance
(number of cases represented 27.52% 47.15%
by all disease signatures)
Random Forest-scored SNPs 48 10
Random Forest-scored genes 18 6
All identified SNP genotypes and their combinations were Analysis of the available phenotypic and clinical data
scored using a Random Forest (RF) algorithm based on for the patients in the two cohorts associated with the
a k-fold cross-validation method (k=5) to evaluate the disease-associated genes and their underlying disease
accuracy with which the SNP genotypes predict the signatures confirmed that the clusters represented
observed case: control split. As a result, 48 SNPs in distinct patient subgroups that are not only associated
Cohort 1 and 10 SNPs in Cohort 2 were scored by the with different genetic signatures, but also shared clinical
RF algorithm, indicating that these SNPs strongly capture characteristics (see Table 3, in Discussion).
the differences between the cases and controls. RF-
scored SNPs are then mapped to genes and prioritized Statistical significance was calculated using a two-
for further analyses. The chromosome distribution of the proportion Z-test for categorical variables and the Mann-
SNPs prioritized by the RF algorithm in the two cohorts is Whitney U test for continuous variables. Although several
shown in Figure 3. notable associations were observed in the clusters, only
one phenotype (age at death) for Cohort 2 was found to
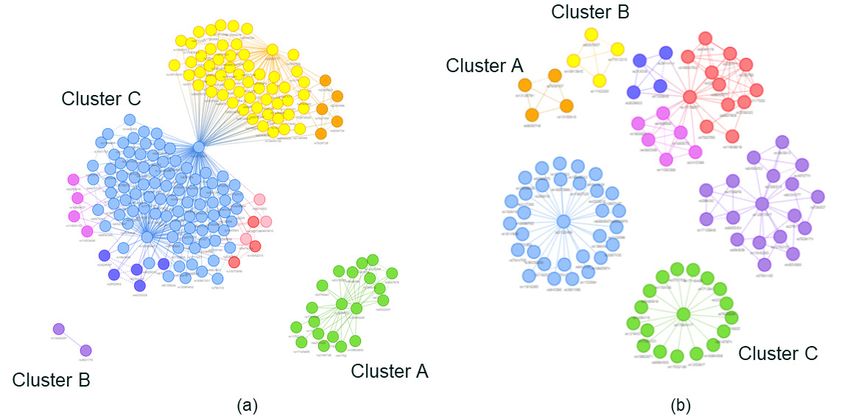
The SNP disease signatures identified by PrecisionLife be statistically significant between the clusters. This is
were further clustered based on their co-occurrence in likely due to the small sample size of the patient clusters,
cases, to generate detailed disease architectures (merged and the limited number of patients with familial ALS, PLS,
networks) of the two patient populations (see Figure PBP, and PMA diagnoses. We believe that analysis of a
4) from their different respective genotype datasets. larger patient dataset with greater numbers of these ALS
The disease architecture provides a unique view of the subtypes could allow us to demonstrate more statistically
two case populations that reveals the heterogeneity significant findings.
of the disease, as observed from the distinct patient
clusters that are likely to share similarities in key disease
processes in ALS.
Figure 3 Distributions of chromosomal locations for disease-associated SNPs in (a) ALS Cohort 1; and (b) ALS Cohort 2
© PrecisionLife Ltd 2021 All rights reserved | 5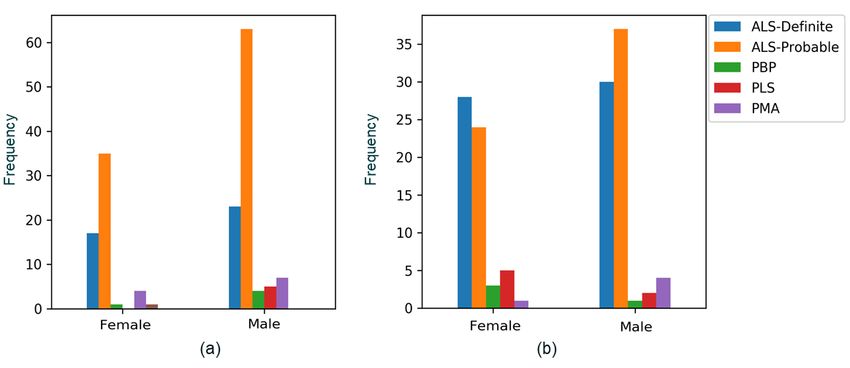
Figure 4 Disease architectures of the patient populations generated by the PrecisionLife platform for (a) ALS Cohort 1;
and (b) ALS Cohort 2. Each circle represents a disease-associated SNP genotype; edges represent co-association in
patients; and colors represent distinct patient subpopulations.

Discussion
ALS Cohort 1
In ALS Cohort 1, three patient clusters or subgroups were                Figure 5 Venn diagram showing the overlap of patients who
identified that have low overlap (see Figure 5). These                   are found in the three clusters (A, B, and C) identified in (a) ALS
                                                                         Cohort 1 (UK2 chip); and (b) ALS Cohort 2 (UK3 chip)
represent three distinct network communities (shown
in Figure 4a, above) that mapped to different disease-
associated genes. Each of these patient clusters was also
more associated with different clinical and phenotypic
characteristics (see Table 3).

Cluster A
Cluster A was most associated with patients diagnosed
with PBP. There were no patients with PMA found in
this cluster. Epidemiological studies have indicated that
patients with PBP often have poorer outcomes,12 and it
is found at a higher frequency in older patients. Although
our data does not surpass the statistical significance
threshold, patients in Cluster A did present with lower
average ALSFRS-R scores and died at an older age,
supporting these independent epidemiological findings
(see Figure 6).

Cases in Cluster A were also more likely to have a genetic               Variants in GENE 2, a metallopeptidase that negatively
variant in GENE 1, a highly novel leucine-rich repeat                    regulates a potassium channel, were associated with this
region-containing gene. Other leucine-rich repeat proteins               cluster. Disruption of these potassium channels results
have been implicated in neurodegenerative conditions                     in brain hyperexcitability and epilepsy in knockout mice.
such as Parkinson’s disease, and many of these proteins                  GENE 2 is also involved in key functional processes in
regulate key brain functions such as neurotrophic                        the brain such as synapse transmission and neurone
receptor signaling.13                                                    myelination.
Cluster B                                                                Neuronal hyperexcitability is often observed in ALS
Cluster B mapped to 48 patients and contained the highest                patients from the early stages of the disease as a result of
proportion of cases diagnosed with PMA (see Figure 7).                   glutamate-induced excitotoxicity and potassium channel
Almost 80% of these patients were also male, and cases                   dysfunction.15, 16 This could represent a subset of patients
in this cluster had slightly higher ALSFRS-R scores (see                 for whom a potassium channel modulator could be
Figures 6 and 8). These findings are similar to those found              particularly effective in slowing disease progression.
in much larger epidemiological cohort studies.14

                                                                                                   © PrecisionLife Ltd 2021 All rights reserved | 6
Table 3 Characteristics of the three clusters identified in the two UK ALS cohorts in Project MinE
Patient Number of
Cohort Gene(s) Patient Characteristics
Clusters Cases
Most associated with PBP
Cluster A 70 GENE 1 No PLS cases
Older age at death
ALS Cohort 1 No PBP cases
(UK2 Chip) Cluster B 48 GENE 2 Some PLS cases
Most associated with PMA
Cluster C 73 16 genes No particular subtype association
Lower ALSFRS-R scores
Cluster A 32 GENE 3 Lower age at death
ALS Cohort 2 More male cases
(UK3 Chip)
Cluster B 33 GENE 4, GENE 5 No particular subtype association
Most associated with PMA
Cluster C 72 GENE 6 More female cases
Slower progression rates
Figure 6 Comparison of the distribution of three clinical features between the three clusters (A, B, and C) identified in the two ALS
cohorts. (a), (b), and (c) show ALSFRS-R, age at death, and survival from disease onset until death for patient clusters, respectively, in
Cohort 1, and (d), (e), and (f) show ALSFRS-R, age at death, and survival from disease onset until death, respectively, for patient clusters
in Cohort 2. Age at death for Cohort 2 (e) was found to be significantly different between Cluster A and Cluster C using the Mann-Whitney
U test (pFigure 7 Gender distribution in the full cohort (shown in gray) and in the Cluster A (yellow), B (pink), and C (green) for
(a) ALS Cohort 1; and (b) ALS Cohort 2
Figure 8 Distribution of ALS diagnoses in the full cohort (shown in gray) and in the Cluster A (yellow), B (pink), and C (green) for (a) ALS
Cohort 1; and (b) ALS Cohort 2
Cluster C
Cluster C contained 73 cases with the least clear clinical While the remaining genes found in this cluster all have
characteristics out of the three clusters. The remaining 16 different physiological functions, many of them have
genes that were found to be significant in Cohort 1 were already been implicated in driving Alzheimer’s disease-
associated with this patient cluster, and no particular ALS related pathophysiology through the development of
subtype was differentially correlated with these cases. neurofibrillary tangles, amyloid-β production, and BACE1
regulation. Frontotemporal dementia is highly associated
Among these genes, we identified a glutamate kainate with ALS,19 and these genes may provide further insights
receptor subunit variant in this ALS population. into the genetic overlap between the two diseases.
Increased activity of kainate receptors contributes to the
development of neuro-excitotoxicity observed in both It is clear that Cluster C patients are highly heterogeneous
familial and sporadic ALS patients.17 Furthermore, riluzole both in terms of clinical phenotype and in the genetic
(a licensed ALS drug) is only protective against kainate- variants found. A greater amount of genetic data and
induced glutamate neuronal death, and so patients with a higher number of patients in an additional study may
this particular variant may have differential treatment allow us to disaggregate this cluster of patients further
responses to this drug.18 into more specific, clinically relevant subgroups.
© PrecisionLife Ltd 2021 All rights reserved | 8ALS Cohort 2 development of schizophrenia and
psychosis such as Notch, Cntn1, and VGF.
In Cohort 2, the cases also appeared to stratify into three Mice lacking GENE 4 expression also displayed
main clusters. However, these have slightly different lower levels of reelin, which is reduced in brains of
characteristics from the clusters found in the first cohort. patients with schizophrenia. There is an established
genetic correlation between schizophrenia and ALS
Cluster A with several shared risk loci,21 and this could provide
Cluster A, containing 32 patients, displayed lower more evidence for shared neuronal pathophysiological
average ALSFRS-R values and significantly younger age processes common in both diseases.
at death (Figure 6). This indicates that patients within
this cluster developed earlier onset and more aggressive The other gene variant associated with this cluster
forms of ALS. Furthermore, no cases with PMA, which encodes a regulatory subunit for a calcium-activated
is often associated with longer survival time and slower potassium channel. SNPs in this gene have already
progression, were found within this group (Figure 7). been associated with ALS in a previous GWAS, and
PrecisionLife identified other SNP variants in genes that
The genetic variant most associated with Cluster A function as key regulators of this potassium channel in
encodes an adhesion G-protein-coupled receptor. It other ALS cohort studies. Variants in GENE 5 also result
has several different functions, including regulating the in TDP-43 proteinopathies and other neurodegenerative
number of synapses in CA1 pyramidal neurons found in pathologies, such as increased tauopathy and
the hippocampus, and playing an important role in spatial accumulation of amyloid-β plaques.
memory. However, studies have also demonstrated that
GENE 3 is involved in the regulation of interleukin-6 (IL-6) Cluster C
secretion, and its expression is associated with baseline Finally, the 72 patients found in Cluster C appear to
IL-6 protein levels. IL-6 expression in astrocytes derived have a different set of clinical characteristics. They
from sporadic ALS patients was increased compared to have the highest proportion of PMA cases out of all the
controls, and correlated with disease progression rates.20 clusters found in Cohort 2, in addition to being more
disproportionately female (Figures 7 and 8). Although not
Cluster B quite reaching statistical significance, cases in this cluster
Cluster B was not particularly associated with any ALS have longer survival times and older average age at
subtype, however patients in this group were more likely death, potentially indicating a subgroup of patients with
to be male and had variants in two different genes, slower disease progression rates (Figure 6). A genetic
GENE 4 and GENE 5. variant in GENE 6, a Rho guanine nucleotide exchange
factor, was found to be most associated with Cluster C.
GENE 4 encodes a neuronal transcription factor that GENE 6 interacts with Rab6A and Rab8A, and may play a
regulates many pathways associated with neurogenesis, role in peripheral myelination.
including several key processes that drive the
Conclusion
The current analysis has been performed on two different Cohort 2, although the characteristics of the clusters in
ALS cohorts from UK patients curated in Project MinE, the two cohorts were found to be different.
who were genotyped on two different SNP chips (UK2
and UK3) that shared a limited number of SNPs (~50%). In Cohort 1, the three clusters were associated with
As a result, two independent studies were performed on different genes, and differences in representation of
the two cohorts. patients with different ALS diagnoses such as PMA and
PBP, as well as gender and age at death, were observed.
The PrecisionLife platform identified 201 combinatorial The three clusters in Cohort 2 were also found to be
disease signatures and 18 risk-associated genes different in their association to genes and representation of
in Cohort 1, and in Cohort 2 it identified 74 disease patients with ALS diagnoses and gender. Additionally, one
signatures and 6 genes. The two cohorts did not have patient cluster was found to have a significantly lower age
any overlap on the disease signatures and genes. This of death than the others and reduced ALSFRS-R values,
can be expected due to the clinical heterogeneity of the indicating a subset of patients with shared genetic variants
patients and different genotyping chips used for the two that present with a more aggressive form of the disease.
cohorts.
Phenotypic analysis of the clusters in each cohort
Biological analysis of these genes revealed that many indicated that although they capture different patient
were functionally implicated in disease processes linked populations, most of the phenotypic and clinical
to the development of neurodegenerative diseases. characteristics were not found to be statistically
These targets would not have been found using standard significant as a result of the very small sample sizes.
analytical approaches such as GWAS on the same We believe that these findings could be significantly
populations. enhanced by combining the two patient cohorts on one
common genotyping platform and analyzing them
Clustering the genetic disease signatures revealed together. We also wish to investigate if our findings can
distinct patient subgroups in each cohort with shared be replicated in non-UK ALS populations, as previous
risk-associated genes and clinical characteristics. Three studies have shown genetic differences between patients
patient clusters were identified in both Cohort 1 and from different countries of origin.
© PrecisionLife Ltd 2021 All rights reserved | 9This analysis demonstrates that PrecisionLife’s different disease mechanisms, but also
combinatorial analysis approach is able to identify novel vary in disease progression rate and age of
ALS risk-associated genes and stratify patients into death. We hypothesize that the significance of
potentially clinically relevant subgroups based on their these findings could be improved with access
genetic differences. These subgroups not only display to larger patient datasets.
Notes and References
1. GBD 2016 Motor Neuron Disease Collaborators (2018). 12. Testa, D., Lovati, R., Ferrarini, M., Salmoiraghi, F., & Filippini,
Global, regional, and national burden of motor neuron G. (2004). Survival of 793 patients with amyotrophic lateral
diseases 1990-2016: a systematic analysis for the Global sclerosis diagnosed over a 28-year period. Amyotrophic
Burden of Disease Study 2016. The Lancet. Neurology, Lateral Sclerosis and Other Motor Neuron Disorders, 5(4),
17(12), 1083–1097. https://doi.org/10.1016/S1474- 208–212.
4422(18)30404-6
13. Ledda, F., & Paratcha, G. (2016). Assembly of Neuronal
2. Chiò, A., Logroscino, G., Hardiman, O., Swingler, R., Connectivity by Neurotrophic Factors and Leucine-Rich
Mitchell, D., Beghi, E., Traynor, B. G., & Eurals Consortium Repeat Proteins. Frontiers in Cellular Neuroscience, 10, 199.
(2009). Prognostic factors in ALS: A critical review. https://doi.org/10.3389/fncel.2016.00199
Amyotrophic Lateral Sclerosis, 10(5–6), 310–323. https://
doi.org/10.3109/17482960802566824 14. Kim, W. K., Liu, X., Sandner, J., Pasmantier, M., Andrews,
J., Rowland, L. P., & Mitsumoto, H. (2009). Study of 962
3. Turner, M. R., & Swash, M. (2015). The expanding syndrome patients indicates progressive muscular atrophy is a
of amyotrophic lateral sclerosis: a clinical and molecular form of ALS. Neurology, 73(20), 1686–1692. https://doi.
odyssey. Journal of Neurology, Neurosurgery, and Psychiatry, org/10.1212/WNL.0b013e3181c1dea3
86(6), 667–673. https://doi.org/10.1136/jnnp-2014-308946
15. van den Bos, M., Geevasinga, N., Higashihara, M., Menon,
4. Nowicka, N., Juranek, J., Juranek, J. K., & Wojtkiewicz, J. P., & Vucic, S. (2019). Pathophysiology and Diagnosis
(2019). Risk Factors and Emerging Therapies in Amyotrophic of ALS: Insights from Advances in Neurophysiological
Lateral Sclerosis. International Journal of Molecular Sciences, Techniques. International Journal of Molecular Sciences,
20(11), 2616. https://doi.org/10.3390/ijms20112616 20(11), 2818. https://doi.org/10.3390/ijms20112818
5. Cedarbaum, J. M., Stambler, N., Malta, E., Fuller, C., Hilt, 16. Do-Ha, D., Buskila, Y., & Ooi, L. (2018). Impairments in
D., Thurmond, B., & Nakanishi, A. (1999). The ALSFRS-R: Motor Neurons, Interneurons and Astrocytes Contribute to
a revised ALS functional rating scale that incorporates Hyperexcitability in ALS: Underlying Mechanisms and Paths
assessments of respiratory function. BDNF ALS Study Group to Therapy. Molecular Neurobiology, 55(2), 1410–1418.
(Phase III). Journal of the Neurological Sciences, 169(1–2), https://doi.org/10.1007/s12035-017-0392-y
13–21. https://doi.org/10.1016/s0022-510x(99)00210-5
17. Bursch, F., Kalmbach, N., Naujock, M., Staege, S.,
6. Project MinE ALS Sequencing Consortium (2018). Project Eggenschwiler, R., Abo-Rady, M., Japtok, J., Guo, W.,
MinE: study design and pilot analyses of a large-scale Hensel, N., Reinhardt, P., Boeckers, T. M., Cantz, T.,
whole-genome sequencing study in amyotrophic lateral Sterneckert, J., Van Den Bosch, L., Hermann, A., Petri, S., &
sclerosis. European Journal of Human Genetics, 26(10), Wegner, F. (2019). Altered calcium dynamics and glutamate
1537–1546. https://doi.org/10.1038/s41431-018-0177-4 receptor properties in iPSC-derived motor neurons
from ALS patients with C9orf72, FUS, SOD1 or TDP43
7. Taylor, K., Das, S., Pearson, M., Kozubek, J., Pawlowski, mutations. Human Molecular Genetics, 28(17), 2835–2850.
M., Jensen, C. E., Skowron, Z., Møller, G. L., Strivens, M., https://doi.org/10.1093/hmg/ddz107
& Gardner, S. (2020). Analysis of genetic host response risk
factors in severe COVID-19 patients. medRxiv (preprint). 18. Brunet, N., Tarabal, O., Esquerda, J. E., & Calderó, J.
https://doi.org/10.1101/2020.06.17.20134015 (2009). Excitotoxic motoneuron degeneration induced by
glutamate receptor agonists and mitochondrial toxins in
8. Koefoed, P., Andreassen, O. A., Bennike, B., Dam, H., organotypic cultures of chick embryo spinal cord. The
Djurovic, S., Hansen, T., Jorgensen, M. B., Kessing, L. V., Journal of Comparative Neurology, 516(4), 277–290. https://
Melle, I., Møller, G. L., Mors, O., Werge, T., & Mellerup, E. doi.org/10.1002/cne.22118
(2011). Combinations of SNPs related to signal transduction
in bipolar disorder. PloS One, 6(8), e23812. https://doi. 19. Couratier, P., Corcia, P., Lautrette, G., Nicol, M., & Marin,
org/10.1371/journal.pone.0023812 B. (2017). ALS and frontotemporal dementia belong to a
common disease spectrum. Revue Neurologique, 173(5),
9. Taylor, K., Das, S., Pearson, M., Kozubek, J., Strivens, M., & 273–279. https://doi.org/10.1016/j.neurol.2017.04.001
Gardner, S. (2019). Systematic drug repurposing to enable
precision medicine: A case study in breast cancer. Digital 20. Chen, Y., Xia, K., Chen, L., & Fan, D. (2019). Increased
Medicine, 5(4), 180–186. Interleukin-6 Levels in the Astrocyte-Derived Exosomes
of Sporadic Amyotrophic Lateral Sclerosis Patients.
10. Church, D. M., Schneider, V. A., Graves, T., Auger, K., Frontiers in Neuroscience, 13, 574. https://doi.org/10.3389/
Cunningham, F., Bouk, N., Chen, H. C., Agarwala, R., fnins.2019.00574
McLaren, W. M., Ritchie, G. R., Albracht, D., Kremitzki, M.,
Rock, S., Kotkiewicz, H., Kremitzki, C., Wollam, A., Trani, L., 21. McLaughlin, R. L., Schijven, D., van Rheenen, W., van
Fulton, L., Fulton, R., Matthews, L., … Hubbard, T. (2011). Eijk, K. R., O’Brien, M., Kahn, R. S., Ophoff, R. A., Goris,
Modernizing reference genome assemblies. PLoS Biology, A., Bradley, D. G., Al-Chalabi, A., van den Berg, L. H.,
9(7), e1001091. https://doi.org/10.1371/journal.pbio.1001091 Luykx, J. J., Hardiman, O., Veldink, J. H., Project MinE
GWAS Consortium, & Schizophrenia Working Group of
11. Purcell, S., Neale, B., Todd-Brown, K., Thomas, L., Ferreira, the Psychiatric Genomics Consortium (2017). Genetic
M. A., Bender, D., Maller, J., Sklar, P., de Bakker, P. I., correlation between amyotrophic lateral sclerosis and
Daly, M. J., & Sham, P. C. (2007). PLINK: a tool set for schizophrenia. Nature Communications, 8, 14774. https://
whole-genome association and population-based linkage doi.org/10.1038/ncomms14774
analyses. American Journal of Human Genetics, 81(3),
559–575. https://doi.org/10.1086/519795
© PrecisionLife Ltd 2021 All rights reserved | 10Appendix
The overall process of mining, validation, and scoring is critical SNPs (marked green in Figure 9) identified
shown below. The RF scoring was applied directly to the by the mining analysis and their networks.
Figure 9 Stages of the PrecisionLife mining, scoring, and analysis process
UK USA DENMARK POLAND
Unit 8b Bankside 1 Broadway Agern Allé 3 CIC, Ul. Chmielna 73
Long Hanborough Cambridge DK-2970, Hørsholm 00-801, Warszawa
Oxfordshire MA 02142
OX29 8LJ info@precisionlife.com
© PrecisionLife Ltd 2021 All rights reserved | 11You can also read