Follow-Up Study of the Chest CT Characteristics of COVID-19 Survivors Seven Months After Recovery - Frontiers
←
→
Page content transcription
If your browser does not render page correctly, please read the page content below
ORIGINAL RESEARCH
                                                                                                                                                published: 01 March 2021
                                                                                                                                         doi: 10.3389/fmed.2021.636298

                                              Follow-Up Study of the Chest CT
                                              Characteristics of COVID-19
                                              Survivors Seven Months After
                                              Recovery
                                              Mengqi Liu 1*, Fajin Lv 1 , Yang Huang 1 and Kaihu Xiao 2*
                                              1
                                                Department of Radiology, The First Affiliated Hospital of Chongqing Medical University, Chongqing, China, 2 Department of
                                              Cardiology, Chongqing University Three Gorges Hospital, Chongqing, China

                                              Background: It has remained a concern whether any long-term pulmonary sequelae
                                              exist for COVID-19 survivors.
                                              Methods: Forty-one patients (22 men and 19 women, 50 ± 14 years) confirmed with
                                              COVID-19 performed follow-up chest CT and cardiopulmonary exercise testing at 7
                                              months after discharge. Patients were divided into fibrosis group and non-fibrosis group
                                              according to the evidence of fibrosis on follow-up CT. The clinical data and the CT findings
                             Edited by:
                                              were recorded and analyzed.
                         Reza Lashgari,
 Institute for Research in Fundamental        Results: The predominant CT patterns of abnormalities observed at 7 months after
                          Sciences, Iran
                                              discharge were parenchymal band (41%), interlobular septal thickening (32%), and
                          Reviewed by:
                 Eduardo Luis De Vito,
                                              traction bronchiectasis (29%). Sixty-one percent of the patients achieved complete
 University of Buenos Aires, Argentina        radiological resolution, and 29% of patients developed pulmonary fibrosis. Compared
                        Kamran Avanaki,
                                              with the patients in the non-fibrosis group, the patients in the fibrosis group were
       University of Illinois at Chicago,
                           United States      older, with a longer hospital stay, a higher rate of steroid and mechanical ventilation
                   *Correspondence:           therapy, lower levels of lymphocyte and T cell count, higher levels of D-dimer and lactic
                           Mengqi Liu         dehydrogenase, and higher quantitative CT parameters (opacity score, volume of opacity,
                  dany0714@163.com
                           Kaihu Xiao
                                              and percentage of opacity) at discharge. Besides, oxygen consumption and metabolic
                    xiaokh1@163.com           equations were decreased and ventilatory equivalent for carbon dioxide was increased
                                              in patients in the fibrosis group. Logistic regression analyses revealed that age, steroid
                    Specialty section:
                                              therapy, presence of traction bronchiectasis on chest CT at discharge, and opacity score
          This article was submitted to
                   Pulmonary Medicine,        at discharge, were independent risk factors for developing pulmonary fibrosis at 7 months
                a section of the journal      after discharge. Receiver operating characteristic analysis revealed that the combined
                   Frontiers in Medicine
                                              clinical-radiological model was better than the clinical-only model in the prediction of
       Received: 01 December 2020
        Accepted: 09 February 2021
                                              pulmonary fibrosis.
         Published: 01 March 2021
                                              Conclusions: The chest CT lesions could be absorbed without any sequelae for most
                            Citation:
                                              patients with COVID-19, whereas older patients with severe conditions are more prone to
     Liu M, Lv F, Huang Y and Xiao K
 (2021) Follow-Up Study of the Chest          develop fibrosis, which may further lead to cardiopulmonary insufficiency. The combined
     CT Characteristics of COVID-19           clinical-radiological model may predict the formation of pulmonary fibrosis early.
        Survivors Seven Months After
    Recovery. Front. Med. 8:636298.           Keywords: coronavirus disease 2019, computed tomography, follow-up, pulmonary fibrosis, cardiopulmonary
    doi: 10.3389/fmed.2021.636298             exercise testing

Frontiers in Medicine | www.frontiersin.org                                          1                                            March 2021 | Volume 8 | Article 636298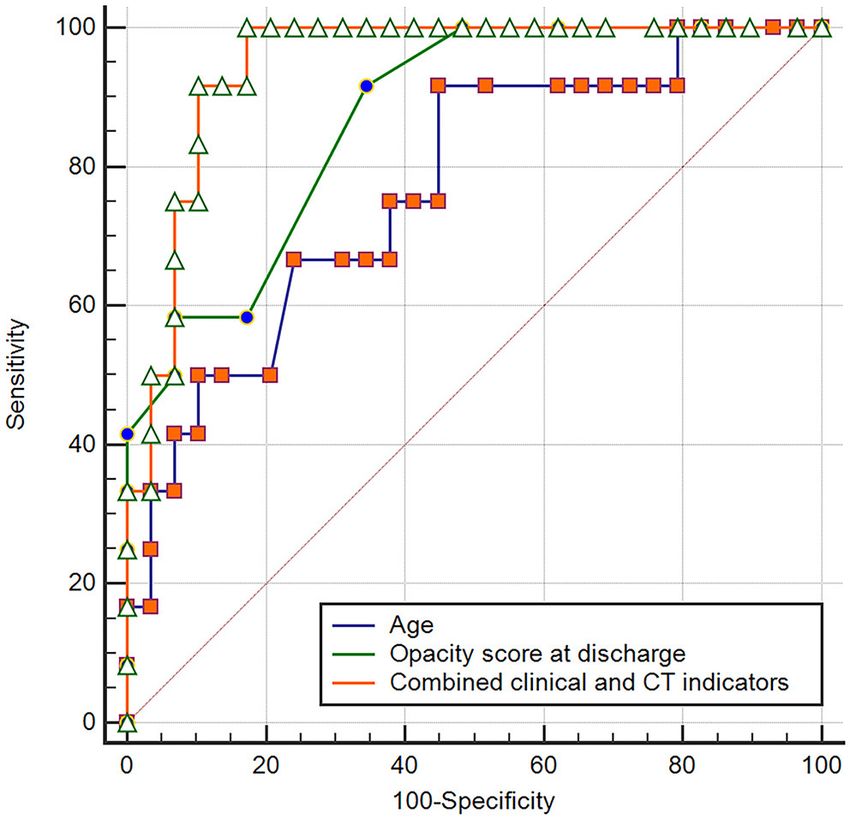
Liu et al. Follow-Up Study of COVID-19 Survivors
INTRODUCTION Image Interpretation
Three thoracic radiologists (with 8, 12, and 25 years of
Since late December 2019, coronavirus disease 2019 (COVID-19) experience, respectively) blinded to the clinical data reviewed
has emerged and promptly spread throughout the world. As of the CT images independently, and the discrepancies were
1 February 2021, there have been over 102.3 million confirmed resolved by discussion and consensus. The CT images of each
cases and 2.2 million deaths reported globally since the start of the patient were assessed and compared for the presence of the
pandemic (1). Thin-section chest CT scans have been making a following features: GGO, consolidation, crazy paving pattern, air
significant contribution to the disease assessment. Currently, the bronchogram, nodules, interlobular septal thickening, irregular
radiological characteristics of COVID-19 have been extensively interfaces, reticular pattern, parenchymal bands, and traction
studied. The typical chest CT features of COVID-19 include bronchiectasis. All the above glossaries were defined according to
ground glass opacities (GGO), consolidation, and interlobular the Fleischner Society (10). In addition, an artificial intelligence
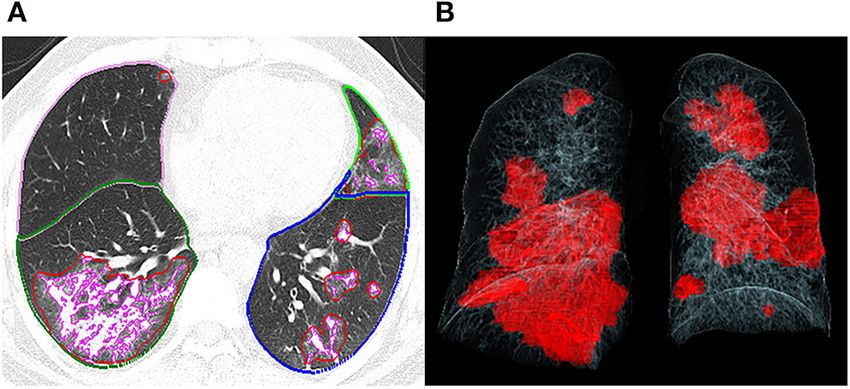
septal thickening with peripheral distribution (2–4). To date, software (CT Pneumonia Analysis, Siemens Healthineers,
many patients have been recovered and discharged. It has Siemens, Erlangen, Germany) was employed to automatically
remained a concern to the public whether any pulmonary identify and quantify hyperdense areas of the lung (Figure 1),
sequelae exist for COVID-19 survivors. Wang and colleagues and the following quantitative parameters were calculated for
reported that clinical sequelae of patients on 3-month follow-up each CT scan: opacity score, volume of opacity, and percentage
were common, including respiratory symptoms, cardiovascular- of opacity (the ratio of volume of opacity to lung volume). Each
related symptoms, and psychosocial symptoms (5). Besides, of the 5 lung lobes was scored automatically 0–4 as 0 (≤1%
recent studies have shown that pulmonary fibrosis may develop involvement), 1 (2–25%), 2 (26–50%), 3 (51–75%), and 4 (>75%).
in patients with COVID-19 short term after discharge (6–8). The total opacity score was the sum of the five lobar scores
However, the number of discharged COVID-19 patients keeps and ranged from 0 to 20. Patients were divided into two groups
increasing worldwide but the definite long-term radiological according to the evidence of fibrosis on the 7-month follow-up
outcomes of the patients after discharge are scarcely described CT imaging: fibrosis group and non-fibrosis group. Fibrosis on
in the literature. Herein, we present the results of the 7-month chest CT was defined as a combination of findings including
follow-up chest CT in patients discharged with COVID-19. parenchymal bands, reticular pattern, and traction bronchiectasis
(8, 11, 12). Clinical and radiological data between the two groups
were subsequently compared.
METHODS
Patients Cardiopulmonary Exercise Testing
This is a prospective observational study performed in patients Cardiopulmonary exercise testing was performed at the latest
discharged with COVID-19 from Chongqing University Three follow-up. Forced expiratory volume in 1 s (FEV1) and forced
Gorges Hospital between February 10, 2020 and March 23, vital capacity (FVC) were measured using a turbine spirometer
2020. This study was approved by the local institutional review (Cosmed, Quark CPET, Rome, Italy). The incremental exercise
board. Written informed consents were obtained from all the was done on a treadmill (Cosmed, Quark CPET, Rome, Italy).
patients enrolled in the study. The diagnostic and discharge Patients were encouraged to exercise until symptoms were
criteria of COVID-19 pneumonia followed the latest guideline of intolerable. Peak oxygen uptake (VO2 ), minute ventilation (VE),
Diagnosis and Treatment Program of COVID-19 released by the and carbon dioxide production (VCO2 ) were measured using a
National Health Commission of the People’s Republic of China Cosmed Face Mask (Quark CPET, Rome, Italy). The anaerobic
(9). Clinical data of the patients were reviewed.
Image Acquisition and Radiological
Follow-Up
All the patients were imaged with a multi-detector CT
scanner (uCT 510, United Imaging, China) using the
following parameters: 120 kVp, 150 mA, 1.5 mm collimation,
reconstruction matrix of 512 × 512, and slice thickness of
1.0 mm. All the patients were scanned in a supine position
with a single inspiratory phase. The scanning range included
the whole chest from the first ribs to the diaphragm. All the
patients were examined without injection of contrast media.
Images were obtained with mediastinal (width, 400 HU; level, FIGURE 1 | Representative postprocessing result of chest CT scan performed
30 HU) and parenchymal (width, 1600 HU; level, −600 HU) with Siemens CT Pneumonia Analysis. A 56-year-old male with COVID-19
window settings. We reviewed three chest CT scans for each (Opacity score = 5, volume of opacity = 671.6 ml, percentage of
patient: the CT examination at discharge, the CT examination at opacity = 15.1%). (A) Axis plane of chest CT shows bilateral ground glass
opacities. (B) 3D-visualization of CT volume rendering technique shows the
3 months after discharge, and the CT examination at 7 months diffuse extent of opacities.
after discharge.
Frontiers in Medicine | www.frontiersin.org 2 March 2021 | Volume 8 | Article 636298Liu et al. Follow-Up Study of COVID-19 Survivors
threshold (AT) was defined as the VO2 level where the VE/VCO2 fibrosis group were older (63 ± 12 years) than those in the non-
decreased or remained constant while the ventilatory equivalent fibrosis group (45 ± 11 years) (p < 0.001). Besides, patients with
to oxygen (VE/VO2 ) persistently increased. Finally, the following severe type were more likely to develop pulmonary fibrosis at 7
parameters were recorded for each object: FEV1/FVC, Peak VO2 months follow-up (p = 0.010). There were no obvious differences
(mL/min/kg), VO2 at AT (mL/min/kg), peak metabolic equations in the clinical symptoms and the proportion of patients with
(METs), and VE/VCO2 slope. comorbidities between the two groups. However, compared with
the non-fibrosis group, the fibrosis group had lower levels of
Statistical Analysis lymphocyte count (p = 0.019) and T cell count (p = 0.022) at
Statistical analyses were performed with the SPSS for Windows discharge, and had higher levels of D-dimer (p < 0.001) and lactic
software package (version 17.0, SPSS Inc) and MedCalc dehydrogenase (LDH, p = 0.037). In addition, more patients in
statistical software (Med-Cale Software, Mariakerke, Belgium). the fibrosis group were mechanically ventilated (p < 0.001), and
The normality of the distribution was checked using a more patients were treated with steroids (p < 0.001). The details
Kolmogorov-Smirnov test. Continuous variables were expressed are summarized in Table 1.
as mean ± standard deviation (SD) or median [interquartile
range (IQR)] and compared with independent t-test or Mann- Chest CT Evaluation
Whitney U test. Categorical variables were expressed as absolute We reviewed three CT scans for each patient. The average
and relative frequencies (%) and compared by the χ2 test interval between discharge and latest follow-up was 219 days,
or Fisher’s exact test between groups. Spearman’s correlations and the average intervals of the two subgroups did not
were performed to evaluate the relationship between the three differ statistically (p = 0.066). The dynamic changes of chest
quantitative CT parameters (opacity score, volume of opacity, CT features were listed in Table 2. As shown in Table 2,
and percentage of opacity) and the laboratory results. Logistic the predominant chest CT features observed at discharge
regression analyses were performed to identify independent included parenchymal band (73%), GGO (71%), interlobular
risk factors for developing pulmonary fibrosis at 7 months septal thickening (68%), consolidation (46%), and irregular
after discharge. Besides, receiver operating characteristic curves interface (46%). The less common CT features included reticular
(ROCs) were constructed for the independent risk factors pattern (39%) and traction bronchiectasis (29%). The rare CT
for predicting pulmonary fibrosis. Optimum cut-off point, features were air bronchogram (7%) and crazy paving pattern
sensitivity, specificity, and area under the curve (AUC) of each (5%). Quantitative CT parameters calculated by the artificial
indicator were calculated. Then, comparisons of ROC curves intelligence software revealed that the median opacity score was
between clinical characteristics alone and combined clinical- 4.0 (IQR 2.0–5.0), the median volume of opacity was 178.0 ml
CT characteristics were performed using the non-parametric (IQR 41.4–422.0 ml), and the median percentage of opacity was
approach of DeLong et al. A P-valueLiu et al. Follow-Up Study of COVID-19 Survivors TABLE 1 | Clinical and laboratory characteristics of the patients included in the present study. Characteristics Total (N = 41) Fibrosis group (N = 12) Non-fibrosis group (N = 29) P-value Sex Male 22 (54%) 7 (58%) 15 (52%) 0.259 Female 19 (46%) 5 (42%) 14 (48%) Age (years) 50 ± 14 63 ± 12 45 ± 11
Liu et al. Follow-Up Study of COVID-19 Survivors
point: >4), respectively (Table 4). When combined the above
5.0 (0.0–18.0)
Non-fibrosis
0.2 (0.0–0.3)
0.2 (0–1.0)
(N = 29)
clinical and CT indicators, the AUC value of the combined
5 (17%)
group
1 (3%)
1 (3%)
0 (0%)
0 (0%)
1 (3%)
0 (0%)
0 (0%)
0 (0%)
model was increased to 0.945 (Figure 4), which was significantly
different from that of age (p = 0.031), but not significantly
7 months after discharge
different from that of opacity score (p = 0.109).
1.7 (0.5–3.0)
1.1 (0.0–1.6)
Cardiopulmonary Exercise Testing
12 (100%)
12 (100%)
12 (100%)
(3.0–41.0)
(N = 12)
Fibrosis
4 (33%)
3 (25%)
5 (42%)
5 (42%)
group
0 (0%)
0 (0%)
33.0
There was no significant difference in FEV1/FVC and VO2 AT
between the fibrosis group and the non-fibrosis group. However,
compare with the non-fibrosis group, the fibrosis group had
decreased VO2 /kg and METs and increased VE/VCO2 . The
0.9 (0.0–12.8)
0.0 (0.0–1.0)
0.0 (0.0–0.3)
13 (32%)
17 (41%)
12 (29%)
(N = 41)
details are summarized in Table 5.
5 (12%)
4 (10%)
5 (12%)
5 (12%)
0 (0%)
0 (0%)
Total
DISCUSSION
After severe acute respiratory syndrome (SARS) outbreak
Non-fibrosis
0.4 (0.0–0.8)
0.7 (0.0–0.8)
(0.0–33.0)
10 (34%)
(N = 29)
4 (14%)
5 (17%)
group
in 2003, plenty of patients recovered. However, radiological
2 (7%)
0 (0%)
0 (0%)
0 (0%)
0 (0%)
2 (7%)
20.0
abnormalities were detected in more than 70% of patients
who recovered from SARS at 4–6 months after admission to
3 months after discharge
the hospital (13, 14), and long-term pulmonary sequelae were
also reported in previous studies (15, 16). So this may raise
2.0 (0.0–3.0)
1.7 (0.0–1.9)
12 (100%)
12 (100%)
12 (100%)
(1.0–67.0)
10 (83%)
(N = 12)
Fibrosis
7 (58%)
4 (33%)
6 (50%)
group
0 (0%)
0 (0%)
an important question for doctors: are there any long-term
51.0
pulmonary sequelae in patients recovering from COVID-19? Up
to now, few reports have described the sequelae of COVID-19
survivors (5–7, 17–20), and the long-term radiological changes
1.4 (0.0–19.0)
have not been well-studied. In our study, we presented the results
0.0 (0.0–2.0)
0.0 (0.0–0.5)
11 (27%)
17 (41%)
10 (24%)
22 (54%)
14 (34%)
(N = 41)
6 (15%)
6 (15%)
0 (0%)
0 (0%)
Total
of 7-month follow-up chest CT in patients with COVID-19, and
we compared clinical data and chest CT between patients with or
without pulmonary fibrosis.
Clinically, patients in the fibrosis group were older than those
P-valueLiu et al. Follow-Up Study of COVID-19 Survivors
FIGURE 2 | Follow-up chest CT images of a 52-year-old male with COVID-19. (A) At discharge, CT imaging shows parenchymal bands, irregular interfaces, and
traction bronchiectasis in left upper lobe and right lower lobe. The lesions are almost revolved on the 3-month follow-up (B) and 7-month follow-up (C) CT. This
patient was enrolled in non-fibrosis group.
FIGURE 3 | Follow-up chest CT images of a 48-year-old female with COVID-19. (A) At discharge, CT imaging shows crazy paving pattern, parenchymal bands,
irregular interfaces, and reticular pattern in bilateral lungs. (B) 3-month follow-up CT shows parenchymal bands, irregular interface, and traction bronchiectasis in the
right lower lobe, which indicates fibrosis. (C) The lesions on 7-month follow-up CT are still present. This patient was enrolled in fibrosis group.
TABLE 3 | Correlations of CT quantitative parameters with laboratory tests.
WBC CRP PCT DD LDH Lymphocyte T cell
Opacity score Correlation coefficient r 0.401 0.337 −0.195 0.343 0.720 −0.214 −0.254
p-value 0.014 0.042 0.248 0.035 0.000 0.197 0.124
Volume of opacity Correlation coefficient r 0.401 0.397 −0.184 0.344 0.604 −0.079 −0.114
p-value 0.014 0.015 0.276 0.035 0.000 0.636 0.495
Percentage of opacity Correlation coefficient r 0.464 0.409 −0.104 0.348 0.722 −0.181 −0.218
p-value 0.004 0.012 0.540 0.032 0.000 0.276 0.188
WBC: white blood cell; CRP: C-reactive protein; PCT: procalciton; DD: D-dimer; LDH: lactic dehydrogenase.
TABLE 4 | ROC analysis results for independent variables for predicting pulmonary fibrosis at 7 months after discharge.
Variable AUC (upper and lower limit) SE Se Sp Optimal cut point
Age 0.770 (0.612–0.887) 0.0828 91.67 55.17 >48
Steroid therapy 0.782 (0.625–0.895) 0.0767 66.67 89.66
Traction bronchiectasis 0.848 (0.701–0.941) 0.0649 83.33 86.21
Opacity score at discharge 0.871 (0.729–0.955) 0.0549 91.67 65.52 >4
Combined clinical and CT 0.945 (0.826–0.992) 0.0329 91.67 82.76
AUC: area under curve; SE: Standard error; Se: sensitivity; Sp: specificity.
However, the CT manifestations of pulmonary fibrosis develop in the early stage in discharged patients with SARS
(interlobular septal thickening, irregular interface, parenchymal (11), and the fibrosis may be long-persistent (15), whereas the
band, and traction bronchiectasis) were still apparent on the pulmonary fibrosis in discharged COVID-19 patients may be
7-month follow-up CT. As reported, pulmonary fibrosis may absorbed with time (6), which was consistent with our study
Frontiers in Medicine | www.frontiersin.org 6 March 2021 | Volume 8 | Article 636298Liu et al. Follow-Up Study of COVID-19 Survivors
after discharge (21). Cardiopulmonary exercise testing provides
integrated data about cardiovascular, ventilatory and gas
exchange, metabolic, and skeletal muscle response to the
physical effort (22). So cardiopulmonary exercise testing can
provide more physiological information than lung function
tests. We found VO2 /kg and METs were decreased and
VE/VCO2 was increased in patients in the fibrosis group,
which may imply cardiopulmonary insufficiency resulting
from fibrosis.
Our study had several limitations. Firstly, the sample size
was quite small. However, our further studies will consider
increasing the sample size of discharged patients on the 1-
year follow-up. Secondly, pulmonary fibrosis had not been
confirmed by pathology even though the CT manifestations were
typical. We will continue to follow up these patients to confirm
whether the radiological fibrosis could be further absorbed.
Finally, we included very few patients with critically severe
type, which may underestimate the incidence rate of pulmonary
fibrosis. We will try to enroll more patients with severe type in
future studies.
In conclusion, the most common imaging patterns of COVID-
19 pneumonia at 7 months after discharge are interlobular
FIGURE 4 | Receiver operating curve for pulmonary fibrosis prediction in
patients with COVID-19 using age or opacity score at discharge alone and
septal thickening, parenchymal band, traction bronchiectasis,
combined clinical-CT indicators. and reticular pattern. The chest CT lesions could be absorbed
without any sequelae for most patients with COVID-19, whereas
older patients with severe conditions are more prone to
TABLE 5 | Results of cardiopulmonary exercise testing on patients with develop fibrosis, which may further lead to cardiopulmonary
COVID-19.
insufficiency. The quantitative CT parameters (opacity score,
Fibrosis group Non-fibrosis group P-value volume of opacity, and percentage of opacity) are reliable
indicators of disease severity. Age >48 years old, steroid
FEV1/FVC 98.0 ± 6.8 99.0 ± 8.1 0.741 therapy, presence of traction bronchiectasis on chest CT at
VO2/Kg 16.4 ± 3.6 20.2 ± 3.7 0.009 discharge, and opacity score at discharge >4, are the independent
VO2 AT 14.6 ± 3.7 16.0 ± 3.5 0.317 risk factors associated with fibrosis. The combined clinical-
METs 4.7 ± 1.0 5.8 ± 1.0 0.010 radiological model may be better than the clinical-only model
VE/VCO2 30.6 ± 4.0 26.3 ± 3.2 0.003 in the prediction of developing pulmonary fibrosis on the
Data are presented as mean ± standard deviation.
7-month follow-up.
FEV1, forced expiratory volume in 1 second; FVC, forced vital capacity; VO2 , oxygen
consumption; AT, anaerobic threshold; METs, metabolic equations; VE/VCO2 , ventilatory
equivalent for carbon dioxide. DATA AVAILABILITY STATEMENT
The raw data supporting the conclusions of this article will be
made available by the authors, without undue reservation.
(Figure 2). The reversibility of fibrosis probably indicated that
the pulmonary fibrosis on chest CT did not signify actual
pathologic fibrosis (14), and thus whether these lesions would ETHICS STATEMENT
completely disappear required further observation.
In our cohort, logistic regression analyses revealed that The studies involving human participants were reviewed and
age, steroid therapy, presence of traction bronchiectasis, and approved by The First Affiliated Hospital of Chongqing Medical
opacity score at discharge, were independent risk factors for University. The patients/participants provided their written
developing pulmonary fibrosis on 7-month follow-up CT. We informed consent to participate in this study.
could speculate that the above four indicators might be early
predictors of pulmonary fibrosis in patients recovered from AUTHOR CONTRIBUTIONS
COVID-19. Further ROC analysis revealed that the combined
clinical-radiological model was better than the clinical-only ML and KX: conception and design. YH and KX: collection and
model in the prediction of pulmonary fibrosis. Our result should assembly of data. ML, YH, and FL: analysis and interpretation
be validated by further large-scale studies. of the data. ML: statistical expertise. ML and FL: drafting of
Zhao and colleagues reported that lung function abnormalities the manuscript. ML and KX: critical revision of the article for
were detected in 25% of COVID-19 patients at 3 months important intellectual content. All authors had full access to all of
Frontiers in Medicine | www.frontiersin.org 7 March 2021 | Volume 8 | Article 636298Liu et al. Follow-Up Study of COVID-19 Survivors
the data in the study and take responsibility for the integrity of Project of Chongqing Medical University (CQMUNCP0201),
the data and the accuracy of the data analysis. and the Wanzhou District COVID-19 Emergency Technology
Research Project (wzstc-2020025).
FUNDING
ACKNOWLEDGMENTS
This work was supported by the Joint Project of Chongqing
Science and Technology Commission and Chongqing Public ML wants to thank his wife, Jia Li, for her understanding, support,
Health Commission (2021MSMX062), the Emergency Research and infinite love.
REFERENCES syndrome (SARS) survivors. Thorax. (2004) 59:889–91. doi: 10.1136/thx.2004.
023762
1. Coronavirus disease 2019 (COVID-19) situation report (https://www.who. 14. Chang YC, Yu CJ, Chang SC, Galvin JR, Liu HM, Hsiao CH, et al.
int/emergencies/diseases/novel-coronavirus-2019/situation-reports). Pulmonary sequelae in convalescent patients after severe acute respiratory
2. Wu J, Wu X, Zeng W, Guo D, Fang Z, Chen L, et al. Chest syndrome: evaluation with thin-section CT. Radiology. (2005) 236:1067–
CT findings in patients with coronavirus disease 2019 and 75. doi: 10.1148/radiol.2363040958
its relationship with clinical features. Invest. Radiol. (2020) 15. Zhang P, Li J, Liu H, Han N, Ju J, Kou Y, et al. Long-term bone and
55:257–61. doi: 10.1097/RLI.0000000000000670 lung consequences associated with hospital-acquired severe acute respiratory
3. Liu M, Zeng W, Wen Y, Zheng Y, Lv F, Xiao K. COVID-19 pneumonia: CT syndrome: a 15-year follow-up from a prospective cohort study. Bone Res.
findings of 122 patients and differentiation from influenza pneumonia. Eur. (2020) 8:8. doi: 10.1038/s41413-020-0084-5
Radiol. (2020) 30:5463–9. doi: 10.1007/s00330-020-06928-0 16. Ngai JC, Ko FW, Ng SS, To KW, Tong M, Hui DS. The long-
4. Zu ZY, Jiang MD, Xu PP, Chen W, Ni QQ, Lu GM, et al. Coronavirus disease term impact of severe acute respiratory syndrome on pulmonary
2019 (COVID-19): a perspective from China. Radiology. (2020) 296:E15– function, exercise capacity and health status. Respirology. (2010)
E25. doi: 10.1148/radiol.2020200490 15:543–50. doi: 10.1111/j.1440-1843.2010.01720.x
5. Xiong Q, Xu M, Li J, Liu Y, Zhang J, Xu Y, et al. Clinical sequelae of COVID-19 17. Denina M, Pruccoli G, Scolfaro C, Mignone F, Zoppo M, Giraudo I,
survivors in Wuhan, China: a single-centre longitudinal study. Clin. Microbiol. et al. Sequelae of COVID-19 in Hospitalized Children: a 4-months follow-
Infect. (2020) 27:85–95. doi: 10.1016/j.cmi.2020.09.023 up. Pediatr. Infect. Dis. J. (2020) 39:e458–9. doi: 10.1097/INF.000000000
6. Fang Y, Zhou J, Ding X, Ling G, Yu S. Pulmonary fibrosis in critical ill patients 0002937
recovered from COVID-19 pneumonia: preliminary experience. Am. J. Emerg. 18. Liu D, Zhang W, Pan F, Li L, Yang L, Zheng D, et al. The pulmonary sequalae in
Med. (2020) 38:2134–8. doi: 10.1016/j.ajem.2020.05.120 discharged patients with COVID-19: a short-term observational study. Respir.
7. Wei J, Yang H, Lei P, Fan B, Qiu Y, Zeng B, et al. Analysis of thin-section CT Res. (2020) 21:125. doi: 10.1186/s12931-020-01385-1
in patients with coronavirus disease (COVID-19) after hospital discharge. J. 19. Wang X, Xu H, Jiang H, Wang L, Lu C, Wei X, et al. Clinical features
Xray Sci. Technol. (2020) 28:383–9. doi: 10.3233/XST-200685 and outcomes of discharged coronavirus disease 2019 patients: a prospective
8. Yu M, Liu Y, Xu D, Zhang R, Lan L, Xu H. Prediction of the development cohort study. Qjm. (2020) 113:657–65. doi: 10.1093/qjmed/hcaa178
of pulmonary fibrosis using serial thin-section CT and clinical features in 20. Rogliani P, Calzetta L, Coppola A, Puxeddu E, Sergiacomi G, D’Amato D, et al.
patients discharged after treatment for COVID-19 pneumonia. Korean J. Are there pulmonary sequelae in patients recovering from COVID-19? Respir.
Radiol. (2020) 21:746–55. doi: 10.3348/kjr.2020.0215 Res. (2020) 21:286. doi: 10.1186/s12931-020-01550-6
9. National Health Commission of the People’s Republic of China. 21. Zhao YM, Shang YM, Song WB, Li QQ, Xie H, Xu QF, et al. Follow-up
Diagnosis and Treatment Protocols of Pneumonia Caused by a Novel study of the pulmonary function and related physiological characteristics of
Coronavirus (Trial Version 7). (2020). Available online at: http://www.nhc. COVID-19 survivors three months after recovery. EClinicalMedicine. (2020)
gov.cn/xcs/zhengcwj/202008/0a7bdf12bd4b46e5bd28ca7f9a7f5e5a/files/ 25:100463. doi: 10.1016/j.eclinm.2020.100463
a449a3e2e2c94d9a856d5faea2ff0f94.pdf 22. Mezzani A. Cardiopulmonary exercise testing: basics of
10. Hansell DM, Bankier AA, MacMahon H, McLoud TC, Muller NL, Remy J. methodology and measurements. Ann. Am. Thorac. Soc. (2017)
Fleischner society: glossary of terms for thoracic imaging. Radiology. (2008) 14:S3–S11. doi: 10.1513/AnnalsATS.201612-997FR
246:697–722. doi: 10.1148/radiol.2462070712
11. Antonio GE, Wong KT, Hui DS, Wu A, Lee N, Yuen EH, et al. Thin- Conflict of Interest: The authors declare that the research was conducted in the
section CT in patients with severe acute respiratory syndrome following absence of any commercial or financial relationships that could be construed as a
hospital discharge: preliminary experience. Radiology. (2003) 228:810– potential conflict of interest.
5. doi: 10.1148/radiol.2283030726
12. Raghu G, Remy-Jardin M, Myers JL, Richeldi L, Ryerson CJ, Lederer DJ, et al. Copyright © 2021 Liu, Lv, Huang and Xiao. This is an open-access article distributed
Diagnosis of idiopathic pulmonary fibrosis. an official ATS/ERS/JRS/ALAT under the terms of the Creative Commons Attribution License (CC BY). The use,
clinical practice guideline. Am. J. Respir. Crit. Care Med. (2018) 198:e44– distribution or reproduction in other forums is permitted, provided the original
e68. doi: 10.1164/rccm.201807-1255ST author(s) and the copyright owner(s) are credited and that the original publication
13. Ng CK, Chan JW, Kwan TL, To TS, Chan YH, Ng FY, et al. Six in this journal is cited, in accordance with accepted academic practice. No use,
month radiological and physiological outcomes in severe acute respiratory distribution or reproduction is permitted which does not comply with these terms.
Frontiers in Medicine | www.frontiersin.org 8 March 2021 | Volume 8 | Article 636298You can also read