Brain structural abnormalities in six major psychiatric disorders: shared variation and network perspectives version 1; peer review: awaiting ...
←
→
Page content transcription
If your browser does not render page correctly, please read the page content below
F1000Research 2021, 10:356 Last updated: 07 MAY 2021

BRIEF REPORT

Brain structural abnormalities in six major psychiatric
disorders: shared variation and network perspectives [version
1; peer review: awaiting peer review]
Euclides José de Mendonça Filho                       1,2,   Márcio Bonesso Alves1,2,
Patricia Pelufo Silveira 1,2
1Department of Psychiatry, McGill University, Montreal, Quebec, H3A 1A1, Canada
2Ludmer Centre for Neuroinformatics & Mental Health, Douglas Mental Health University Institute, Montreal, Quebec, H4H 1R3,

Canada

v1   First published: 07 May 2021, 10:356                                      Open Peer Review
     https://doi.org/10.12688/f1000research.51475.1
     Latest published: 07 May 2021, 10:356
     https://doi.org/10.12688/f1000research.51475.1                            Reviewer Status AWAITING PEER REVIEW

                                                                               Any reports and responses or comments on the

Abstract                                                                       article can be found at the end of the article.
Common brain abnormalities are a possible explanation for
comorbidities in psychiatric disorders. Challenges in understanding
these conditions are likely due to the paucity of studies able to analyze
the extent and regional distribution of shared morphometric
abnormalities between disorders. Recently, Opeal et al. presented an
elegant rationale to investigate shared and specific morphometric
measures of cortical thickness and subcortical gray matter volume
between healthy individuals and subjects across six major psychiatric
disorders. Although their approach has the potential to systematically
portrait shared brain alterations, the chosen principal component
analysis solution may not address the central question of the
observed shared versus specific brain alterations due to
misspecification of the number of components. Given how this
misspecification can lead to different conclusions, we reanalyzed Opel
et al. data to thoroughly determine the number of factors to be
considered, explore the alternative solution, and visualize the patterns
of shared brain matter correlations using network analysis. Our
approach suggests that a unidimensional solution was appropriate in
this situation. The unidimensional solution indicated that brain
alterations in autism spectrum disorder (ASD) had a significant
negative component loading, suggesting that brain abnormalities
found in ASD carry more similarities with major depressive disorder
(MDD), bipolar disorder (BD), schizophrenia (SCZ), and obsessive-
compulsive disorder (OCD) than demonstrated by the original work.
Network analysis indicated that SCZ had the highest strength, BD the
highest closeness, and BD and MDD had the highest betweenness in
the network. This work highlights how different component solutions
can lead to different conclusions, with important implications for the
understanding of overlapped patterns of symptoms among six major

                                                                                                                          Page 1 of 8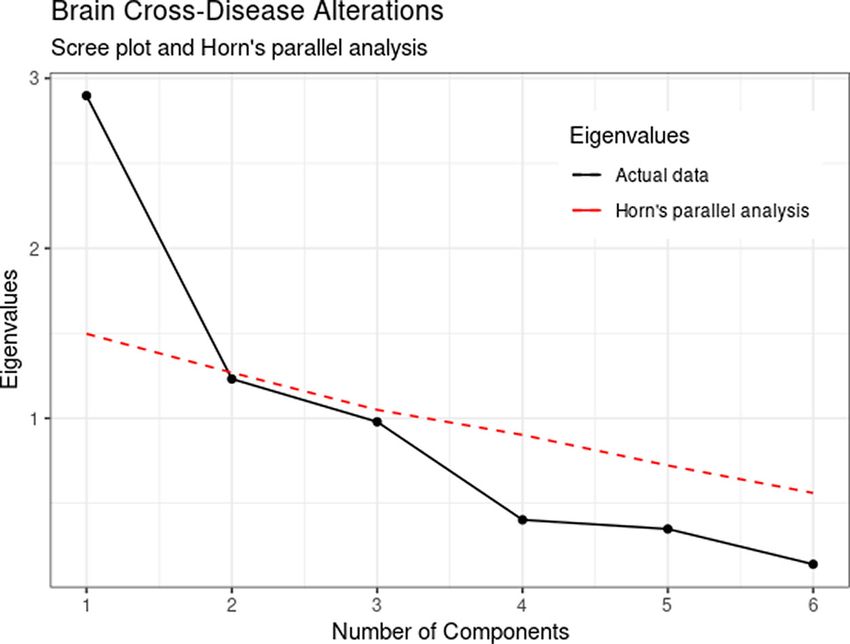
F1000Research 2021, 10:356 Last updated: 07 MAY 2021

psychiatric diseases. The network approach is complementary in
indicating central markers of specific psychopathology domains.
Investigations using shared-variation and network perspectives are
promising for the study of pathophysiological patterns of common
brain alterations.

Keywords
Cross-disorder, ENIGMA, Psychiatric disorders, Structural MRI,
Principal Component Analysis, Network Analysis

 Corresponding author: Patricia Pelufo Silveira (patricia.silveira@mcgill.ca)
 Author roles: de Mendonça Filho EJ: Conceptualization, Data Curation, Formal Analysis, Methodology, Visualization, Writing – Original
 Draft Preparation, Writing – Review & Editing; Alves MB: Conceptualization, Data Curation, Methodology, Writing – Original Draft
 Preparation; Silveira PP: Conceptualization, Funding Acquisition, Methodology, Resources, Supervision, Writing – Review & Editing
 Competing interests: No competing interests were disclosed.
 Grant information: The author(s) declared that no grants were involved in supporting this work.
 Copyright: © 2021 de Mendonça Filho EJ et al. This is an open access article distributed under the terms of the Creative Commons
 Attribution License, which permits unrestricted use, distribution, and reproduction in any medium, provided the original work is properly
 cited.
 How to cite this article: de Mendonça Filho EJ, Alves MB and Silveira PP. Brain structural abnormalities in six major psychiatric
 disorders: shared variation and network perspectives [version 1; peer review: awaiting peer review] F1000Research 2021, 10:356
 https://doi.org/10.12688/f1000research.51475.1
 First published: 07 May 2021, 10:356 https://doi.org/10.12688/f1000research.51475.1

                                                                                                                                  Page 2 of 8
F1000Research 2021, 10:356 Last updated: 07 MAY 2021
Introduction
Challenges to the understanding of heterogeneity and comorbidity of psychiatric disorders have long been acknowledged
in medicine. The National Institute of Mental Health’s Research Domain Criteria (RDoC) initiative acknowledges that
common brain abnormalities can potentially explain psychiatry comorbidities,1 but few studies were able to systemat-
ically investigate the extent and regional distribution of shared morphometric abnormalities between disorders.
Using published meta- and mega-analyses of the Enhancing Neuro Imaging Genetics Through Meta-Analysis
(ENIGMA) consortium, Opel et al.2 present an elegant rationale to investigate shared and specific morphometric
measures of cortical thickness and subcortical gray matter volume between typical control individuals and subjects with
six of the major psychiatric disorders (major depressive disorder [MDD], bipolar disorder [BD], schizophrenia [SCZ],
obsessive-compulsive disorder [OCD], attention-deficit/hyperactivity disorder [ADHD], and autism spectrum disorder
[ASD]). To address whether brain-structural alterations related to these disorders loaded onto latent variables, shared
brain abnormalities among them were examined using principal component analysis (PCA) across all cortical and
subcortical regions. Then component scores were compared with the empirical regional effect sizes, allowing the
definition of regions in each disorder that were better predicted by a shared variance component. The authors retained
three principal components across disorders with a solution defined by MDD, BD, SCZ, and OCD loading on the first
component, ADHD on the second, and ASD on the third component, leading to the conclusion that MDD, BD, SCZ, and
OCD shared neuro-abnormality patterns, whereas ASD and ADHD exhibited disease-specific alterations.
Although the rationale used to investigate shared and specific morphometric measures of brain matter consists of
an opportune strategy for improving the understanding of the pathophysiologic mechanisms of psychiatric disorders,3
the number of components retained in the analysis, in this case, may not address the central question of the observed
shared versus specific brain alterations. The three-factor solution parcels out the weaker residual correlation into minor
components that might be of theoretical importance. We recognize that it is often a challenge to define the appropriate
number of factors for data reduction, but common recommendations assume that retaining components with eigenvalues
>1.0 usually indicates an excessive number of components. Moreover, the consideration of weak or poorly identified
factors (i.e., components defined by only one or two variables) is an indication that the number of factors extracted should
be reconsidered.4
The over-extraction and under-extraction of factors retained in data reduction can have deleterious effects on the results.5
Given the importance of the number of factors in data reduction and how different component solutions can lead to
different conclusions, we leveraged the cross-disease effect sizes reported in Opel et al.2 to thoroughly determine the
number of factors to be considered, explore the appropriate solution, and visualize the patterns of shared brain matter
correlations using network analysis.
Methods
We reanalyzed the underlying structure of 41 regional measures of cortical thickness and subcortical volumes across the
six psychiatric disorders compiled by Opel et al.2 The data consisted of effect sizes obtained by contrasting healthy
controls (N = 33,146) and patients (N = 19,578) of published structural neuroimaging mega- and meta-analyses of the
ENIGMA consortium in the years 2016 to 2019.2 The data selection criteria included the availability of effect sizes of
psychiatric disorders for all 34 cortical brain regions based on the Desikan-Killiany atlas automated labeling system,6 and
7 subcortical regions included in the standardized probabilistic information, modeled using the Markov random fields
imaging pipeline7 applied by the ENIGMA consortium. This criteria identified 11 studies of six psychiatric disorders:
MDD (N = 2), BD (N = 2), SCZ (N = 2), OCD (N = 2), ADHD (N = 2), and ASD (N = 1). The effect size measures
consisted of Cohen’s d mean differences in each cortical or subcortical region after age, sex, scanner adjustment, and in
case of subcortical volume, total intracranial volume.2
Data source and preparation
The object of analysis is a dataset comprised of the effect size estimates for six psychiatric disorders and 41 regions
of interest – hippocampus, amygdala, thalamus, accumbens, caudate, putamen, pallidum, isthmus cingulate cortex,
posterior cingulate cortex, rostral anterior cingulate cortex, caudal anterior cingulate cortex, lateral orbit frontal cortex,
pars opercularis of inferior frontal gyrus, rostral middle frontal gyrus, superior frontal gyrus, medial orbital frontal
cortex, pars orbitalis of inferior frontal gyrus, pars triangularis of inferior frontal gyrus, caudal middle frontal gyrus,
precentral gyrus, frontal pole, paracentral lobule, insula, lateral occipital cortex, lingual gyrus, cuneus, pericalcarine
cortex, inferior parietal cortex, supramarginal gyrus, precuneus, superior parietal, postcentral gyrus fusiform gyrus,
middle temporal gyrus, inferior temporal gyrus, banks superior temporal sulcus, superior temporal gyrus, parahippo-
campal gyrus, transverse temporal gyrus, entorhinal cortex, and temporal pole. This dataset was obtained by copying the
effect sizes estimates reported by Opel et al2 on Supplementary Table S2 of their manuscript.2 The full manuscript was
Page 3 of 8F1000Research 2021, 10:356 Last updated: 07 MAY 2021
accessed in https://doi.org/10.1016/j.biopsych.2020.04.027 via the McGill Library Portal (https://www.mcgill.ca/
library/) on September 19, 2020. The data extracted from Opel’s manuscript2 Supplementary Table S2 was prepared
for statistical manipulation in the SPSS (V.21, IBM Corp., Armonk, NY) statistical environment and is available upon
request.
Data analysis
The number of principal components retained was determined using the scree plot criteria and Horn’s parallel analysis.8
The scree plot shows how much variation each component captures from the data and allows to determine the inflection
point in the data where additional components are unnecessary. The number of data points above the inflection is usually
the number of components to retain. Horn’s parallel analysis compares the eigenvalues randomly generated from the data
using Monte-Carlo simulation with the original data. The number of components retained consists of the original
eigenvalues that are higher than the simulated eigenvalues.8 We also verified the number of components in the cross-
disease correlation matrix with eigenvalues greater than 1.0, although this procedure is considered one of the least
accurate methods for selecting the number of components.5 At this stage, we used the functions implemented by the psych
package9 from the R statistical language (V. 4.0.2). At a second stage, we used the SPSS software to conduct exploratory
factor analysis. The principal components algorithm was used for dimensional extraction, and component scores obtained
using the regression method.9
To investigate specific patterns of residual correlations between the psychiatric disorders, we fitted a Gaussian graphical
model with a Least Absolute Shrinkage and Selection Operator (gLASSO)10 to the data using the qgraph11 R package.
This procedure yields parsimonious partial-correlations of the brain alterations for each pair of psychiatric diseases here
represented as nodes. Edges between diseases indicate a regularized partial correlation, after conditioning on all other
diseases in the dataset. To assess the importance of nodes in the network, we computed the following centrality measures:
strength, a measure of how well a node is directly connected to other diseases, closeness, how well a node is indirectly
connected to other diseases, and betweenness, quantification of how important a node is in the average path between two
other diseases.
Results
Inspection of the scree plot and Horn’s parallel analysis indicated the consideration of one component instead of the
original three-component solution. Figure 1 shows a steeper decrease from the first to the second eigenvalues, followed by
a flatter pattern for the remaining components. In addition, only the first actual eigenvalue was higher than the resampled
eigenvalues (depicted in red) suggesting a unidimensional solution. It can be noticed that the third component obtained
an eigenvalue of .98, violating the liberal eigenvalues greater than the 1.0 cut-off. Therefore, we opted to retain one
component for subsequent analysis.
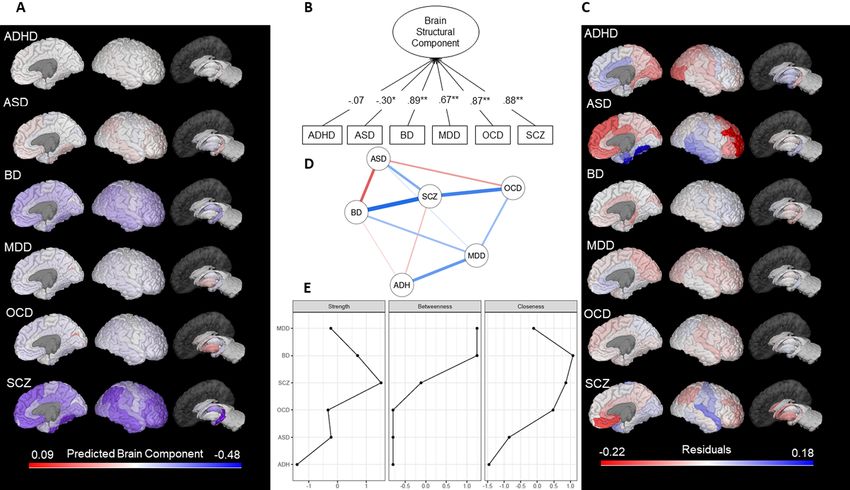
The unidimensional solution indicated that the effect size of the differences in brain structure between ASD patients
and controls shared a significant negative component loading (λ = -0.30, p = 0.04) with the brain abnormalities of the
remaining five diseases (Figure 2). While in the original analysis SCZ had the highest shared correlation (indicated by the
highest component loading) of the four conditions (MDD, BD, SCZ, and OCD), the unidimensional solution showed that
the BD (λ = 0.89, p < 0.001) followed by SCZ (λ = 0.88, p < 0.001), and OCD (λ = 0.87, p < 0.001) had the highest shared
correlation with all six disorders (Figure 2B), illustrating how different dimensional reduction solutions are implied in
different patterns of covariance. Similar to the original report, ADHD did not load into the PCA, indicating low shared
brain abnormalities with the other disorders.
We also calculated a regional component score (M = 0.0, SD = 1.0) to identify which brain areas were more affected in a
cross-disease manner. The hippocampus (-1.64) and the fusiform gyrus (-1.40) exhibited a more prominent shared
reduction, whereas the pallidum (2.94) and putamen (2.09) showed a stronger shared increase. In order to explore shared-
and disorder-specific morphometric abnormalities, we computed regional effect-sizes residuals from the component
score. In contrast to the original work, this allowed the inclusion of ASD and ADHD in the analysis, although ADHD was
not further explored due to its non-significant component loading. Regional specificities for MDD, BD, SCZ, and OCD
were similar to Opel et al.2 results (Figure 2C). ASD showed large residuals especially for the rostral middle (residual
[res] = .18) and superior frontal gyrus (res = .15), as well as fusiform (res = -.22) and entorhinal gyrus (res = -.17).
Network analysis indicated that ASD showed a stronger negative association with BD, suggesting that BD is a bridge
node between ASD and the other diseases. Interestingly, after controlling for the other diseases, ASD exhibited a positive
correlation with SCZ in contrast with the PCA and Opel et al.2 results. ADHD had a weaker partial correlation with the
other nodes that were linked by MDD. SCZ, BD, and OCD maintained the pattern of strong positive associations
(Figure 2D). Centrality measures of the network indicated that SCZ had the highest strength (direct connections to
Page 4 of 8F1000Research 2021, 10:356 Last updated: 07 MAY 2021
Figure 1. Eigenvalues scree plot and Horn’s parallel analysis of brain structural effect size alteration in six
psychiatric disorders.
Figure 2. Principal component and network analysis of the effect sizes of brain structural alterations in six
psychiatric disorders. (A) Predicted component scores mapped onto brain regions; (B) Path diagram of the principal
component unidimensional solution; (C) Residuals from the regional effect sizes accounting for the predicted shared
principal component. As in Opel et al.,2 the absolute size of residuals encompasses the degree of representation
through the shared unidimensional component. Lower (negative) residuals represent underestimation and higher
(positive) residuals represent overestimation based on the brain-regional shared variance. (D) gLASSO correlations
network of brain structural alterations in the six psychiatric disorders. Edges represent parsimonious partial-
correlations between psychiatric disorders. A stronger correlation (positive = blue; negative = red) results in a thicker
and darker edge. (E) Network centrality measures. ADHD, attention-deficit/hyperactivity disorder; ASD, autism
spectrum disorder; BD, bipolar disorder; MDD, major depressive disorder; OCD, obsessive-compulsive disorder;
SCZ, schizophrenia. All effect sizes used in these results are taken from Opel et al.2 *p < 0.05; **p < 0.001.
Page 5 of 8F1000Research 2021, 10:356 Last updated: 07 MAY 2021
other diseases), BD had the highest closeness (indirect connection to other diseases). BD and MDD had the highest
betweenness (the average path between two other diseases),5 see Figure 2E.
Discussion and conclusion
Our approach suggests that the brain abnormalities found in ASD carry more similarities with MDD, BD, SCZ, and
OCD than demonstrated by the original three-component solution in Opel et al.2 Indeed, the well-observed pattern
of co-occurrence and clinical overlap among ASD and other psychiatric disorders indicates that they share important
pathogenic brain mechanisms and risk factors.12,13 The small association of ASD and the specificity of ADHD abnormal-
ities might be explained by the fact that these are neurodevelopmental disorders, although recent work has supported the idea
that the etiology of BD and SCZ also involves a substantial neurodevelopmental basis.14,15 An alternative and interesting
view argue that these disorders could be conceptualized as a neurodevelopmental continuum, in which the symptoms would
reflect the severity, timing, and pattern of brain abnormalities, as well as the modulatory effects of genetic and environmental
factors.14 The results we obtained here seem to partially reflect Owen and O’Donavan’s14 theoretical understanding of this
phenomenon.
To summarize, Opel et al.2 advance our understanding of brain morphometric features in highly debilitating psychiatric
conditions. Notably, different component solutions can lead to different conclusions, but both approaches were categorical
in demonstrating the strong alterations of the hippocampus, fusiform gyrus, pallidum, and putamen. These findings may be
of special interest given that the overlapped pattern of symptoms among the major psychiatric diseases usually makes
it difficult to accurately diagnose and to prescribe tailored treatment. Moreover, the network approach might help
to understand specific disease domains of psychopathology. With more neuroimaging studies of psychiatric disorders
becoming available, investigations via shared variation and network perspectives are promising venues for understanding
the subtypes of shared pathophysiological patterns.
Data availability:
Underlying data
The underlying data of the present study is based on Opel et al.2 work and are available on https://doi.org/10.1016/j.
biopsych.2020.04.027. The dataset was obtained by copying the effect sizes estimates reported by Opel et al2 on
Supplementary Table S2 of their manuscript.2 The full manuscript was accessed via the McGill Library Portal (https://
www.mcgill.ca/library/) on September 19, 2020.
© 2020 Society of Biological Psychiatry.
References
1. Xia CH, Ma Z, Ciric R, et al.: Linked dimensions of psychopathology into gyral based regions of interest. Neuroimage. 2006; 31(3):
and connectivity in functional brain networks. Nat Commun. 968–980.
2018; 9(1): 1–14. PubMed Abstract|Publisher Full Text
Publisher Full Text |PubMed Abstract|Publisher Full Text|Free 7. Fischl B, Salat DH, Busa E, et al.: Whole brain segmentation:
Full Text Automated labeling of neuroanatomical structures in the
2. Opel N, Goltermann J, Hermesdorf M, et al.: Cross-Disorder human brain. Neuron. 2002; 33(3): 341–355.
Analysis of Brain Structural Abnormalities in Six Major PubMed Abstract|Publisher Full Text
Psychiatric Disorders: A Secondary Analysis of Mega- and Meta- 8. Horn JL: A rationale and test for the number of factors in factor
analytical Findings From the ENIGMA Consortium. analysis. Psychometrika. 1965; 30(2): 179–185.
Biol Psychiatry. 2020; 88(9): 678–686. PubMed Abstract|Publisher Full Text
PubMed Abstract|Publisher Full Text
9. Revelle W: psych: Procedures for Personality and Psychological
3. Eckstrand KL: Shared Versus Disorder-Specific Research. 2020.
Brain Morphometric Features of Major Reference Source
Psychiatric Disorders in Adulthood. Biol Psychiatry. 2020; 88(9):
e41–e43. 10. Epskamp S, Borsboom D, Fried EI: Estimating psychological
PubMed Abstract|Publisher Full Text networks and their accuracy: A tutorial paper. Behav Res
Methods. 2018; 50(1): 195–212.
4. Izquierdo I, Olea J, Abad FJ: Exploratory factor analysis in PubMed Abstract|Publisher Full Text|Free Full Text
validation studies: uses and recommendations. Psicothema.
2014; 26(3): 395–400. 11. Epskamp S, Cramer AOJ, Waldorp LJ, et al.: Borsboom D. qgraph:
PubMed Abstract|Publisher Full Text Network Visualizations of Relationships in Psychometric Data.
J Stat Softw. 2015; 48(4).
5. Costello AB, Osborne JW: Best practices in Publisher Full Text
exploratory factor analysis: Four recommendations for
getting the most from your analysis. Pract Assessment, Res Eval. 12. Guan J, Cai JJ, Ji G, et al.: Commonality in dysregulated
2005; 10(7). expression of gene sets in cortical brains of individuals with
Publisher Full Text autism, schizophrenia, and bipolar disorder. Transl Psychiatry.
2019; 9(1).
6. Desikan RS, Ségonne F, Fischl B, et al.: An automated labeling PubMed Abstract|Publisher Full Text|Free Full Text
system for subdividing the human cerebral cortex on MRI scans
Page 6 of 8F1000Research 2021, 10:356 Last updated: 07 MAY 2021
13. Lai MC, Kassee C, Besney R, et al.: Prevalence of co-occurring World Psychiatry. 2017; 16(3):
mental health diagnoses in the autism population: 227–235.
a systematic review and meta-analysis. Lancet Psychiatry. 2019; PubMed Abstract|Publisher Full Text|Free Full Text
6(10): 819–829. 15. Kloiber S, Rosenblat JD, Husain MI, et al.: Neurodevelopmental
PubMed Abstract|Publisher Full Text pathways in bipolar disorder. Neurosci Biobehav Rev. 2020;
14. Owen MJ, O’Donovan MC: Schizophrenia and the 112(February): 213–226.
neurodevelopmental continuum: evidence from genomics. PubMed Abstract|Publisher Full Text
Page 7 of 8F1000Research 2021, 10:356 Last updated: 07 MAY 2021
The benefits of publishing with F1000Research:
• Your article is published within days, with no editorial bias
• You can publish traditional articles, null/negative results, case reports, data notes and more
• The peer review process is transparent and collaborative
• Your article is indexed in PubMed after passing peer review
• Dedicated customer support at every stage
For pre-submission enquiries, contact research@f1000.com
Page 8 of 8You can also read