Hot deformation behavior and processing maps of 9Cr3W3Co oxide dispersion-strengthened steel
←
→
Page content transcription
If your browser does not render page correctly, please read the page content below
High Temperature Materials and Processes 2021; 40: 23–31
Research Article
Wen-Sheng Yang, Jia-Wei Wang*, Lei Jiang, Tian-Jian Wang, and Yu-Bing Pei
Hot deformation behavior and processing maps
of 9Cr3W3Co oxide dispersion-strengthened
steel
https://doi.org/10.1515/htmp-2021-0010 high-temperature properties by adding oxide (e.g., Y2O3)
received September 22, 2020; accepted December 10, 2020 is called oxide dispersion-strengthened (ODS) steels.
Abstract: The hot deformation behavior of as-cast 9Cr3W3Co To gain an excellent high-temperature property of
oxide dispersion-strengthened (ODS) steel was investigated 9Cr3W3Co-ODS heat-resistant steels, forming processes
by Gleeble 3500 facility in the temperature range of are continually updated and improved. It’s generally
900–1,150℃ and at strain rates range of 0.01–10 s−1. The known that microstructure, grain, and crack can be opti-
constitutive equation and processing maps were established mized by hot deformation. Accordingly, it’s important to
to describe this complex hot deformation process. The true study the changes in microstructure and properties with
stress–strain curves showed that the softening effects of different hot deformation parameters and then optimize
dynamic recovery and dynamic recrystallization are stronger the hot deformation process.
than the effect of work hardening with further increasing To date, large amounts of theoretical models are used
the temperature and strain. The optimal hot working para- to explain the thermal deformation behavior of the
meters of 9Cr3W3Co-ODS steel are suggested to be T = materials. For example, Prasad et al. [3] put forward
1,050–1,100°C and ε̇ = 0.03–0.3 s−1. the processing maps, which accurately described the
hot workability of Ti-6242 alloy.
Keywords: heat-resistant steel, constitutive equations, Davenport et al. [4] employed a constitutive equation
processing maps, microstructure evolution for modeling the forming processes of plain steel and
microalloyed steel, which was distinguished from the
traditional phenomenological constitutive models that
were established by numerical statistics and neglected
1 Introduction the physical meaning [5]. Based on the above models,
Ebrahimi et al. [6] studied the microstructure evolution
The 9Cr3W3Co steel is well-known as one of the best of heat-resistant steel (13% Cr) during hot deformation.
materials with long service life under high pressure and Wang et al. [7] further investigated the critical Z value,
temperature owing to their unique characteristics, such below which the dynamic recrystallization might occur.
as high thermal conductivity, low thermal expansion For 9Cr-ODS steel, Shao et al. have combined constitutive
coefficient, and so on [1,2]. In addition, steel with good equation and processing maps to comprehensively
describe the flow behaviors of 9Cr-ODS heat-resistant
steel and obtained satisfactory results [8]. However, the
abovementioned 9Cr-ODS was produced by mechanical
alloying and hot isostatic pressing, which were different
* Corresponding author: Jia-Wei Wang, The State Key Laboratory of
from the traditional production process (i.e., vacuum
Long-life High Temperature Materials, Dongfang Electric
Corporation Dongfang Turbine Co., Ltd, Deyang 618000, China, induction melting). There have been no reports on the
e-mail: wangjiaweistudy@163.com study of hot deformation behaviors of 9Cr3W3Co-ODS
Wen-Sheng Yang: School of Metallurgical and Ecological steels with the traditional production process. Besides,
Engineering and Beijing Key Laboratory of Special Melting and the relevant constitutive models and processing maps
Preparation of High-End Metal Materials, University of Science and
are not yet clear.
Technology Beijing, Beijing 100083, China
Lei Jiang, Tian-Jian Wang, Yu-Bing Pei: The State Key Laboratory of
In this article, the flow stress behavior of a 9Cr3W3Co-
Long-life High Temperature Materials, Dongfang Electric ODS steel were analyzed by isothermal compression
Corporation Dongfang Turbine Co., Ltd, Deyang 618000, China tests with different processing parameters. The relevant
Open Access. © 2021 Wen-Sheng Yang et al., published by De Gruyter. This work is licensed under the Creative Commons Attribution 4.0
International License.
24 Wen-Sheng Yang et al.
theoretical models were carried to understand the hot parameters are given in Figure 3. The variational tenden-
deformation behaviors. Moreover, the microstructure cies of curves are related to work hardening [10] and
evolution were also studied in detail under the different dynamic softening [11]. Moreover, the dynamic softening
hot working parameters. mechanisms contain dynamic recrystallization [12] and
dynamic recovery [13]. During the infancy of hot defor-
mation, the contribution of work hardening is stronger
than that of dynamic softening, so that the stress increases
2 Experimental details rapidly. At this stage, dislocations begin to proliferate and
move in the 9Cr3W3Co-ODS steels, which can effectively
The designed alloy compositions are summarized in compensate for hot deformation [14]. As the strain
Table 1. Y2O3 was added at the end of vacuum induction increases, the curves tend to a decline or steady state,
melting. A nonaqueous solution electrolytic method [9] which depends on the competitive relationship between
and field emission-scanning electron microscopy (FE- work hardening and dynamic softening. Clearly, the
SEM) were used to extract and observe Y2O3 in the as- dynamic recrystallization and dynamic recovery play a
cast 9Cr3W3Co-ODS steel, as shown in Figure 1. major role. The softening effect of dynamic recovery
Isothermal compression tests were carried out in a increases gradually and the dynamic recrystallization
Gleeble 3500 facility (Dynamic Systems Inc., Poestenkill, grains begin to nucleate and grow with the increment of
USA). Specimens were machined into cylinders by wire- strain. In particular, both continuous and discontinuous
electrode cutting with a diameter of 8 mm and a length of dynamic recrystallization exist under the hot working pro-
15 mm. Based on the actual forging process (the beginning cess [15]. For the discontinuous dynamic recrystallization,
forging temperature is 1,150℃ and the end forging tem- it can be found at a large strain condition in the Figure 3(b).
perature is 900℃), the experimental parameters of hot Because the dynamic recovery between the first-run and
deformation are shown in Figure 2. Initially, all the sam- second-run recrystallization can’t counteract the work hard-
ples were preheated to the complete austenitizing tem- ening, the stress value rises and the curve appears as a
perature (1,200℃) at a rate of 10℃/s and held for 15 min. wave-like shape.
The temperature was reduced from 1,200℃ to the deforma- The values of peak stress and peak strain with dif-
tion temperature at a rate of 5℃/s and then compressed. ferent hot compressive deformation parameters are given
Through the quenching, the high-temperature microstruc- in Table 2. The decrease in peak stress is followed by an
tures of the deformed samples were retained and prepared increase in temperature. This is because that increasing
for observation. The deformed samples were polished, temperature can accelerate atomic vibration and atomic
ultrasonically cleaned, and etched in a mixed solution of diffusion [16], which are conducive to the dynamic
deionized water (100 mL), hydrochloric acid (50 mL), and recovery. Meanwhile, the higher temperature can also pro-
FeCl3 (5 g). The optical microscope (DM4000M, Leica, mote the movements of grain boundaries and then accele-
Germany) were used for investigating the evolutions of rate the dynamic recrystallization. By contrast, accompa-
microstructure after deformation of samples. nied by an increase in the strain rate, the peak stress gra-
dually increases. This is because that the faster strain rate
can shorten the deformation time and restrain the effect of
dynamic softening.
3 Results and discussion
3.1 Flow stress curves 3.2 Constitutive analysis
The flow stress curves of the studied 9Cr3W3Co-ODS The constitutive equation can well explain the flow beha-
steels under a range of hot compressive deformation viors and calculate the peak stress (σp ) of 9Cr3W3Co-ODS
Table 1: Composition of the as-cast 9Cr3W3Co-ODS steel (wt%)
C Si Mn Cr W Co Mo Ni V Nb N Y O Fe
0.08 0.04 0.11 9.6 3.0 2.8 0.12 0.40 0.21 0.074 0.015 0.03 0.003 Bal.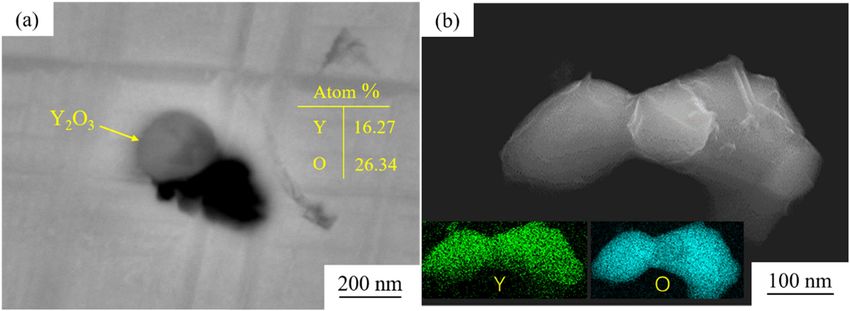
Hot deformation behavior and processing maps of 9Cr3W3Co ODS steel 25
Figure 1: Morphologies of Y2O3 in as-cast 9Cr3W3Co-ODS steel: (a) back scattered-electron imaging; (b) morphology of Y2O3 extracted from
steel.
In equations (2)–(3), n1, B, and B′ are the material
parameters. α can be described as equation (4):
β
α= (4)
n1
Substituting the peak stress (σp ) for flow stress (σ ) in
equations (1)–(3) and taking natural logarithm of both
sides, we can easily find that
∂ ln ε̇
n1 = (5)
∂ ln σp
∂ ln ε̇
β= (6)
∂σp
Obviously, n1 and β can be linearly regressed to the
Figure 2: Process flow diagram of hot deformation experiments. relationship with ln ε̇ -σp (Figure 4(a)) and ln ε̇ -σp (Figure
4(b)), respectively. Taking logarithm of both sides of
equation (1) and then taking partial derivative of 1/T,
steels during steady hot deformation [17]. The strain rate activation energy can easily find that
(ε̇ ) based on strain (ε ) and other material constants can
be calculated as follow [18,19]: Q = Rn2 b =
∂ ln ε̇
∂ ln [sinh(ασp)] (7)
−Q
R
ε̇ = A [sinh(ασ )]n exp (1)
RT ∂ ln (sinh(ασp)) ∂(1/ T )
T ε̇
where Q are the activation energy (J/mol). And ε̇ , R, T, Using the same method as above, Q can be obtained.
and σ are corresponding to the strain rate (s−1), universal The calculation results of hot deformation parameters of
gas constant [8.314/J (mol K)−1], deformation temperature studied steels are summarized in Table 3.
(K), and flow stress, respectively. Moreover, A, α , n, and β In order to get the A parameter, Zener and Hollomon
are the material parameters. et al. [20], in 1944, put forward one parameter named
At low stress level (ασ < 0.8): Zener–Hollomon parameter (Z), which was related to
the hot compressive deformation parameters. Z is defined
−Q (2)
ε̇ = A1 σ n1 exp = Bσ n1 as follows:
RT
Q
At high stress level (ασ > 1.2): Z = ε̇ exp (8)
RT
−Q
ε̇ = A2 exp(βσ ) exp = B′ exp(βσ ) (3) Z can also be derived from equations (1) and (8),
RT 26 Wen-Sheng Yang et al.
(a) (b)
900°C
True-Stress/MPa
True-Stress/MPa
900°C
1000°C
1000°C 1050°C
1050°C
1100°C
1100°C
1150°C
1150°C
True-Strain True-Strain
(c) (d)
900°C
900°C
True-Stress/MPa
True-Stress/MPa
1000°C
1000°C
1050°C 1050°C
1100°C
1100°C
1150°C 1150°C
True-Strain True-Strain
Figure 3: True stress-true plastic strain plots for the 9Cr3W3Co-ODS steels obtained at a series of hot compressive deformation parameters:
(a) 0.01 s−1;(b) 0.1 s−1;(c) 1 s−1;(d) 10 s−1.
Z = A [sinh(ασp)]n (9) Therefore, ln A and n are the intercept and slope of
ln Z − ln[sinh(ασp)] [Figure 5(a)], respectively. Consequently,
Taking logarithm of both sides of equation (9),
ln A = 52.834, n = 4.507. In summary, the constitutive equa-
ln Z = ln A + n ln [sinh(ασp)] (10) tion of the studied 9Cr3W3Co-ODS can be described as
Table 2: Peak stress (σp ) and peak strain (εp) of the samples with a series of hot compressive deformation parameters
ε̇ /s−1 T/℃ σp /MPa εp ε̇ /s−1 T/℃ σp /MPa εp
0.01 900 122.071 0.039 1 900 197.754 0.054
1,000 52.734 0.161 1,000 147.949 0.064
1,050 46.757 0.083 1,050 115.234 0.088
1,100 28.321 0.146 1,100 64.453 0.576
1,150 20.019 0.049 1,150 46.387 0.415
0.1 900 137.695 0.024 10 900 223.145 0.161
1,000 104.981 0.029 1,000 165.039 0.093
1,050 66.406 0.142 1,050 121.094 0.2832
1,100 38.574 0.171 1,100 98.632 0.342
1,150 26.856 0.176 1,150 57.129 0.322Hot deformation behavior and processing maps of 9Cr3W3Co ODS steel 27
(a) 900°C (b)
1000°C
1050°C
1100°C
1150°C
ln(σp)
σp
900°C
1000°C
1050°C
1100°C
1150°C
ln ε ln ε
(c) (d)
ln[sinh(ασp)]
ln[sinh(ασp)]
0.01s-1
900°C
0.1s-1
1000°C
1050°C 1s-1
10s-1
1100°C
1150°C
ln ε (1000/T)/K-1
Figure 4: Linear relationship of (a) ln ε̇ -σp , (b) ln ε̇ -σp , (c) ln ε̇ -ln[sinh(ασp)], (d) ln[sinh(ασp)]-(1,000/T). Scattered points are measured data,
and lines represent liner fitted data.
Table 3: Hot deformation parameters of the studied 9Cr3W3Co-ODS Z 1 / n Z 2 / n
1/2
ln + + 1
1
steels σ= (12)
A
α A
n1 n2 β b Q (kJ/mol) Replacing the unknown constants with the material
7.025 4.690 0.096 15.522 605.248 parameter, the flow stress equation of 9Cr3W3Co-ODS
can be expressed as:
1 / 4.507
σ = 72.99 × ln
Z
8.82E + 22
ε̇ = 8.82 × 10²² (13)
1 / 2
2 / 4.507
+
(11) Z
−605248 + 1
× [sinh(0.0137σp)]4.507 exp
RT 8.82E + 22
To describe the flow stress, we introduce the Z para- Peak stress (σp ) can be calculated based on equation
meter in equation (11) as follows: (13). Moreover, σp has important significance for the28 Wen-Sheng Yang et al.
(a) (b)
Predicted flow stress/MPa
lnZ
2
R =1 R2 = 0.96
ln[sinh(ασp)] Experimental flow stress/MPa
Figure 5: Constitutive equation fitting results of the studied 9Cr3W3Co-ODS steels: (a) plots of ln Z − ln[sinh(ασp)]; (b) the relationship
between the predicted peak stress and experimental peak stress.
hot deformation, which represents the maximum load. σ = Kε̇ m (15)
Figure 5(b) shows the relationship between the predicted where k represents the material parameter and m repre-
peak stress and measured peak stress. All points are dis- sents the strain rate sensitivity coefficient.
tributed near the oblique line with an angle of 45°. This ε̇ dσ dJ
oblique line means that the measured value is equal to m= = (16)
σ dε̇ dG
the predicted value. It is obvious that the predictive value
and the measured values are good identical (R2 = 0.96). When m is 1, J reaches a maximum value (Jmax). The
The result shows that the constitutive equation of 9Cr3W3Co- energy proportion of microstructure evolution can be
ODS steel is scientific and reliable. reflected by power dissipation efficiency (η).
σε̇
Jmax = (17)
2
J 2m
3.3 Processing map η= = (18)
Jmax m+1
In order to further understand this complex process and The power dissipation maps can be built by drawing
gain the optimal deformation parameters, processing the contour line of η at a range of deformation tempera-
maps based on the data from flow stress curves have tures and strain rates.
been established. The processing map theory is proposed However, higher η values do not mean the optimal
by Raj [21], which is based on dynamic materials’ model. hot deformation parameters. This is because the undesir-
Power dissipation maps and instability maps contribute able microstructure (e.g., wedge cracks) can also form in
to the processing maps, and the total power can be the high η region [22]. So it’s a must that unsafe plastic
given as: flow should be further considered [23].
ε̇ σ dJ J
< (19)
P = σε̇ = G + J = ∫ σ dε̇ + ∫ ε̇ dσ (14) dε̇ ε̇
0 0 Substituting equation (16) into equation (19) can
where P, σ , ε̇ , G, and J are the total power, flow stress, result in equation (20).
strain rate, dissipated power in heat form, and reserved
energy related to microstructure evolution (i.e., dynamic ξ (ε̇ ) =
∂ ln ( ) +mHot deformation behavior and processing maps of 9Cr3W3Co ODS steel 29
Based on the true stree–strain curves, m can be obtained parameters, necklace structure begins to appear at the
by cubic spline interpolation fitting at different hot com- grain boundary, as shown in Figure 7(b). Necklace struc-
pressive deformation parameters. The values of η and ξ , ture consists of fine and equiaxed new grains, which are
in addition, can be calculated through equations (18) distributed along austenite grain boundaries. Moreover,
and (20). this is a signal of the beginning of dynamic recrystalli-
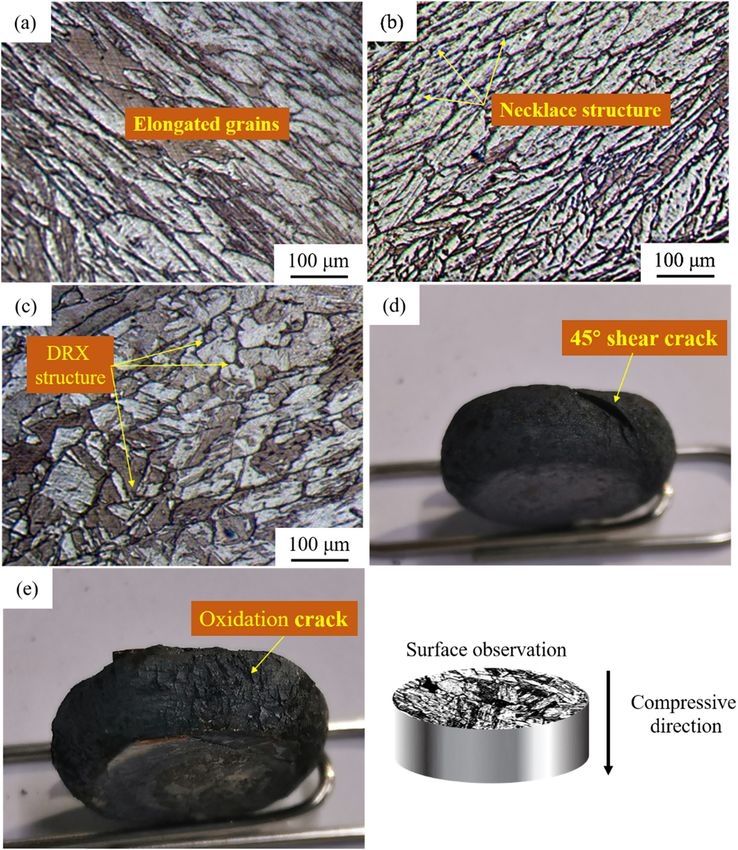
The processing maps of the studied 9Cr3W3Co-ODS zation. Figure 7(c) shows the optical microstructure in
steels with the true strain of 0.4 and 0.6 are shown in position Ⅲ compressed at 1,150℃ with a strain rate of
Figure 6. The gray-shaded areas represent unstable 1 s−1. In this position, the number of coarser DRX grains
regions. In Figure 6(a), the unstable region occurs increases and some elongated grains can be observed.
for 900–1,080℃ at strain rate range of 3.16–10 s−1. In Moreover, the power dissipation efficiency is up to
Figure 6(b), the unstable region occurs for 900–1,150℃ 40%, which indicates a higher microstructure evolution
at strain rate range of 0.32–10 s−1. Compared with the extent has taken place in the materials. Figure 7(d) and (e)
processing maps of Figure 6(a), the unstable region show the typical crack types in the unstable region. At
becomes larger and expands into the high-temperature the low hot working temperature and high strain rate
and low-strain rate region in Figure 6(b). region (ξ < 0), the fracture type is 45° shear fracture,
In the following, we focus the discussion on the pro- which is caused by plastic instability [24]. Compared
cessing map at the strain of 0.6 to analyze the effects of with Figure 7(d), the fracture type in Figure 7(e) changes
thermal deformation on microstructures of the studied to the oxidation crack at the highest strain rate and hot
9Cr3W3Co-ODS steels. Figure 6(b) shows five different working temperature, which is caused by high tempera-
deformation regions (I–V): safe regions, which include ture oxidation.
positions I, II and III (ξ > 0); unstable regions (gray- In conclusion, the hot processing maps of 9Cr3W3Co-
shaded area), which include positions IV and V. ODS steel and experimentally observed macro- and
Figure 7 shows the macro- and microstructure related microstructure have a great consistency. Moreover,
to these five positions. At a relatively low hot working flow instability occurs in the strain rate of 0.3–10 s−1.
parameter, the optical microstructure characteristics The high η occurs for 1,050–1,100°C at strain rates
of steady-state deformation are mainly the elongated range of 0.03–0.3 s−1. Meanwhile, a large number of
structures, as shown in Figure 7(a). This is because aus- DRX grains appear in this region, which can signifi-
tenite is seriously compressed along the axis direction cantly reduce the grain size and make the steel obtain
and shows obvious directionality. The result shows that high mechanical properties. So the optimal hot working
the evolution mechanism of hot deformation microstruc- parameters of the studied 9Cr3W3Co-ODS steels are sug-
ture is dynamic recovery. With increasing hot working gested to be T = 1,050–1,100°C and ε̇ = 0.03–0.3 s−1.
Figure 6: Processing maps of the studied 9Cr3W3Co-ODS steels at different strain: (a) 0.4; (b) 0.6. The gray-shaded area indicates unstable
region. I–V represent five different deformation regions. Contour lines denote power dissipation efficiencies.30 Wen-Sheng Yang et al.
Figure 7: Macro- and microstructure of the 9Cr3W3Co-ODS steels corresponding to the processing maps of Figure 6(b): (a) position I;
(b) position II; (c) position III; (d) position IV; (e) position V.
4 Conclusions 2. The constitutive equation of the studied 9Cr3W3Co-
ODS steel can be obtained as:
The hot deformation behavior of a 9Cr3W3Co-ODS was
−605248
systematically investigated. The regions of the processing ε̇ = 8.82 × 10²² × [sinh(0.0137σp)]4.507 exp
RT
maps are analyzed in terms of the microstructural evolu-
tion under different hot working parameters and detailed 3. Processing maps based of the true stress–strain curves
conclusions are listed below: can clearly describe this complex hot working process
1. The hot deformation process was affected by the work and help us obtain the optimal hot working para-
hardening and dynamic softening. The peak stress meters. The optimal hot working parameters of stu-
decreased as the hot deformation temperature increased died 9Cr3W3Co-ODS steels are suggested to be T =
or as the strain rate decreased. 1,050–1,100°C and ε̇ = 0.03–0.3 s−1.Hot deformation behavior and processing maps of 9Cr3W3Co ODS steel 31
Funding: This work was supported by the Science and electrolytic and room temperature organic methods. Metals,
Technology Program of Sichuan Province, China (Grant Vol. 8, No. 1, 2018, pp. 68–76.
No. 18SYXHZ0069). [10] Zhao, J. W., Q. Yang, and X. C. Wang. Physical modeling of flow
stress during the hot deformation of Nb steels. Materials
Science Forum, Vol. 944, 2019, pp. 247–253.
Author contributions: Wen-Sheng Yang analysed the results, [11] Barbosa, J. V., T. M. F. de Melo, and D. B. Santos. Dynamic and
and wrote the paper; Jia-Wei Wang assisted in revising the static softening behavior of a titanium added ultra-low carbon
paper; Lei Jiang supervised and designed the experiments; steel during hot and warm deformation. The Journal of
Tian-Jian Wang provided help in calculation; Yu-Bing Pei Materials Research and Technology, Vol. 9, No. 3, 2020,
pp. 2810–2817.
carried out the experimental work. All authors have read
[12] Cao, Y., H. S. Di, and R. D. K. Misra. Dynamic recrystallization
and agreed to the published version of the manuscript. behavior of AISI 420 stainless steel under hot compression.
High Temperature Materials and Processes, Vol. 34, No. 2,
Conflict of interest: The authors declare no conflict of 2014, pp. 155–161.
interest. [13] Ryan, N. D., H. J. Mcqueen, and E. Evangelista. Dynamic
recovery and strain hardening in the hot deformation of type
317 stainless steel. Materials Science and Engineering,
Data availability statement: The data used to support the
Vol. 81, 1986, pp. 259–272.
findings of this study are included within the article. [14] Chen, X. M., Y. C. Lin, D. X. Wen, J. L. Zhang, and M. He.
Dynamic recrystallization behavior of a typical nickel-based
superalloy during hot deformation. Materials and Design,
Vol. 57, No. 5, 2014, pp. 568–577.
References [15] Huang, L. J., F. Qi, P. T. Hua, L. X. Yu, F. Liu, W. R. Sun, et al.
Discontinuous dynamic recrystallization of inconel 718
[1] Yan, W., W. Wang, Y. Y. Shan, K. Yang, and W. Sha. 9–12 Cr superalloy during the superplastic deformation. Metallurgical
heat-resistant steels. Springer, Switzerland, 2015. and Materials Transactions A, Vol. 46, 2015, pp. 4276–4285.
[2] Stéphanie, H., E. Piozin, P. Mayr, C. Caës, and B. Fournier. [16] Li, H., C. Yang, L. X. Sun, and M. Q. Li. Influence of pressure on
Characterization of a boron alloyed 9Cr3W3CoVNbBN steel and interfacial microstructure evolution and atomic diffusion in the
further improvement of its high-temperature mechanical hot-press bonding of Ti-33Al-3V to TC17. Journal of Alloys and
properties by thermomechanical treatments. Journal of Compounds, Vol. 720, 2017, pp. 131–138.
Nuclear Materials, Vol. 441, No. s1–3, 2013, pp. 15–23. [17] Seeger, A., J. Diehl, S. Mader, and H. Rebstock. Work-hard-
[3] Prasad, Y. V. R. K, H. L. Gegel, S. M. Doraivelu, J. C. Malas, ening and work-softening of face-centred cubic metal crystals.
J. T. Morgan, K. A. Lark, et al. Modeling of dynamic material Philosophical Magazine A, Vol. 2, No. 15, 1957, pp. 323–350.
behavior in hot deformation: forging of Ti-6242. Metallurgical [18] Jonas, J. J., C. M. Sellars, and W. J. M. Tegart. Strength and
and Materials Transactions A, Vol. 15, No. 10, 1984, structure under hot-working conditions. Metallurgical
pp. 1883–1892. Reviews, Vol. 14, No. 1, 1969, pp. 1–24.
[4] Davenport, S. B., N. J. Silk, C. N. Sparks, and C. M. Sellars. [19] Abbod, M. F., C. M. Sellars, A. Tanaka, D. A. Linkens, and M.
Development of constitutive equations for modelling of hot Mahfouf. Effect of changing strain rate on flow stress during
rolling. Journal of Materials Science and Technology, Vol. 16, hot deformation of Type 316L stainless steel. Materials Science
No. 5, 2000, pp. 539–546. and Engineering: A, Vol. 491, No. 1–2, 2009, pp. 290–296.
[5] Lin, Y. C., and X. M. Chen. A critical review of experimental results [20] Zener, C. and J. H. Hollomon. Effect of strain rate upon plastic
and constitutive descriptions for metals and alloys in hot working. flow of steel. Journal of Applied Physics, Vol. 15, No. 1, 1944,
Materials and Design, Vol. 32, No. 4, 2011, pp. 1733–1759. pp. 22–32.
[6] Ebrahimi, G. R., H. Keshmiri, A. R. Maldad, and A. Momeni. [21] Raj, R. Development of a processing map for use in warm-
Dynamic recrystallization behavior of 13% Cr martensitic stain- forming and hot-forming processes. Metallurgical and
less steel under hot working condition. Journal of Materials Materials Transactions A, Vol. 12, No. 6, 1981, pp. 1089–1097.
Science and Technology, Vol. 28, No. 5, 2012, pp. 467–473. [22] Wu, H., S. P. Wen, H. Huang, X. L. Wu, K. Y. Gao, W. Wang, et al.
[7] Wang, B. Z., W. T. Fu, Z. Q. Lv, P. Jiang, W. H. Zhang, and Hot deformation behavior and constitutive equation of a new
Y. J. Tian. Study on hot deformation behavior of 12%Cr ultra- type Al‒Zn‒Mg‒Er‒Zr alloy during isothermal compression.
super-critical rotor steel. Materials Science and Engineering: Materials Science and Engineering: A, Vol. 651, 2016,
A, Vol. 487, 2008, pp. 108–113. pp. 415–424.
[8] Shao, Y., L. M. Yu, Y. C. Liu, Z. Q. Ma, H. J. Li, and J. F. Wu. Hot [23] Farnoush, H., A. Momeni, K. Dehghani, J. A. Mohandesi, and
deformation behaviors of a 9Cr oxide dispersion-strengthened H. Keshmiri. Hot deformation characteristics of 2205 duplex
steel and its microstructure characterization. International stainless steel based on the behavior of constituent phases.
Journal of Minerals, Metallurgy and Materials, Vol. 26, No. 5, Materials and Design, Vol. 31, No. 1, 2010, pp. 220–226.
2019, pp. 597–610. [24] Galiyev, A., R. Kaibyshev, and G. Gottstein. Correlation of
[9] Guo, J., K. M. Fang, H. J. Guo, and Y. W. Luo. Determination of plastic deformation and dynamic recrystallization in magne-
three-dimensional morphology and inner structure of second- sium alloy ZK60. Acta Materialia, Vol. 49, No. 7, 2001,
phase inclusions in metals by non-aqueous solution pp. 1199–1207.You can also read