Travel Check-In A Global Perspective - MASTERCARD RECOVERY INSIGHTS - Cision
←
→
Page content transcription
If your browser does not render page correctly, please read the page content below
MASTERCARD RECOVERY INSIGHTS

Travel Check-In
A Global Perspective
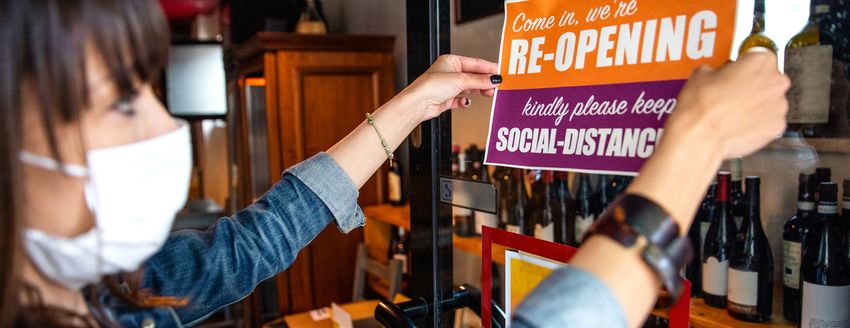
Covid-19 hit travel hard. Yet, despite many remaining challenges, there are
Trend to Watch:                         already signs of recovery. After all, travel consistently ranks as one of the most
                                        missed activities during the pandemic.1
Travel’s “Virtual”
Reality                                 Half a year has passed since the first stay-at-home orders were issued. Many
                                        domestic markets are now starting to relax restrictions on movement and are
Virtual reality, among other digital    establishing intra-regional “travel bubbles” with other markets. Still, progress
experiences, has been on travel’s       is neither even nor linear. Upticks in Covid-19, and the risk of second waves, are
horizon for some time.2 Like many
                                        provoking new restrictions within countries and between countries.
nascent trends, Covid-19 is
hastening its emergence in a
manner somehow fitting in today’s       This report, the second in our Recovery Insights series, looks for signs of
surreal reality.3 This is not           gradual improvement in travel spending. We approach the story of where,
surprising as travel is a natural       how and why people are traveling from two levels:
extension of “immersive
commerce” solutions that already
                                        • the travel story from the air
let consumers shop online as if in
a physical store.
                                        • the travel story from the ground

Being able to shop Paris’s              The Shift to Digital, our first Recovery Insights report, identified key retail
Champs-Élysées and New York’s           trends to watch. With online travel agents having steered almost all travel
5th Avenue in the same day—and          spend online well before Covid-19, many such trends also have implications
from the comfort of home—puts
                                        for travel. We weave some of those trends into this report.
a new twist on cross-border
shopping. It also adds a new
dimension to Mastercard Travel
Rewards, which connects                 The Travel Story from the Air
international travelers with
merchant offers at their
                                        Airline spend across Europe, North America, the Middle East & Africa and Asia
destinations and now includes
over 600 online luxury brand offers.
                                        Pacific was less than a tenth of 2019 levels by mid-April (see figure 1).

Viewing a sunset or learning about      Grounded airplanes meant the number of filled seats was even lower than the
a famous work of art through a          spend would suggest because flights could only be booked for departure dates
screen won’t ever replace visiting in   further out. Recent lifts in spend are an encouraging sign of growing demand,
person. But, as effective marketing
                                        but do not necessarily mean people are flying yet.
or creative revenue generation, it
will be hard to beat.
                                        As with filled seats, the prevalence of Covid-19 in a country doesn’t always
                                        correlate with travel spend either. Although the less steep drop in spend in
                                        Latin America & the Caribbean could be associated with a delayed Covid-19
                                        impact, Asia Pacific isn’t leading the recovery despite being the first region to
                                        be hit. Spending on air travel is recovering faster in Europe as a result of the
                                        opening of European corridors (see figure 1).

                                        1
                                           Mastercard proprietary survey. Australia, Brazil, Colombia, China, France, Germany, India, Italy, Japan, Mexico, Spain, Russia,
                                           UAE, USA, UK. N=150/country. May 11, 2020 – May 17, 2020.
                                        2
                                          “The Realities of Virtual Reality in the Customer Travel Experience,” Mastercard, 2019.
                                        3
                                          “Trending the Rules: Top Retail Trends are Trending at an Unprecedented Rate,” Retail Touchpoints (article by Mastercard),         2
                                           July 27, 2020; “No Rest for Restaurants,” Mastercard, 2020.
Figure 1: Percentage growth of airline spend by region in 2020 relative to the same time last year4

    40%

    20%

     0%

   -20%

   -40%

   -60%

   -80%

  -100%

  -120%

          Europe           Middle East / Africa                     Latin America / Caribbean                          North America                       Asia Pacific

Although many Asian countries are further along in navigating Covid-19 than their European counterparts,5 recovery is
more contingent on domestic sentiment than regional arrangements. For example, almost three-quarters of consumers
in Thailand said in April 2020 that they would postpone major purchases. Almost four-fifths had canceled or delayed
trips. But almost two-thirds also said they would resume travel after restrictions lifted.6 True to word, airline spend rose
quickly in July after the government announced its latest easing of restrictions, which included a limited resumption of
international flights (see figure 2).

    Figure 2: Percentage growth of airline spend in Thailand in 2020 relative to the same time last year7

   20%
                                                                                                                                                        Restrictions Eased
    0%

   -20%

   -40%

   -60%

   -80%

  -100%

  -120%

                            4
                              Based on anonymized and aggregated switched volumes across the Mastercard network—includes credit and debit, domestic and cross border.
                            5
                              “Sailing Against the Wind: How Businesses in Asia are Navigating Covid-19,” Mastercard, 2020.
                            6
                              “Mastercard Impact Studies—The Black Swan Series: Thailand,” Mastercard, May 2020.                                                             3
                            7
                               Based on anonymized and aggregated switched volumes across the Mastercard network—includes credit and debit, domestic and cross border.
Europe might be leading the regional recovery through intra-regional travel, but some larger individual countries are
recovering relatively quickly in terms of domestic airline travel. That’s noticeable in the BRIC countries of Brazil, Russia,
India and China. The impact of domestic and regional considerations means recovery varies across the four. China and
Russia stand out globally, while Brazil and India are recovering quickly relative to overall regional levels (see figure 3).

    Figure 3: Percentage growth of airline spend by country in July 2020 relative to last year8

                                                                                                                                                                    -23%

                                                                                                                                                                    -61%

                                                                                                                                                                    -100%

China and Russia also top the G20 nations in airline spend recovery. India and Brazil take the eighth and ninth spots.
Sandwiched between the BRICs are five geographically smaller countries—France, Italy, Turkey, Germany and the UK—
that all feature in the list of the top-10 most visited countries by international tourists, according to the UN World
Tourism Organization.9 They are benefitting from the opening of intra-regional travel in Europe (see figure 4).

    Figure 4: Recovery of airline spend in G20 countries in July 2020 relative to last year (July 2019 = 100)10

                         0   10                 20               30              40               50              60               70              80               90      100

              China
              Russia
             France
                 Italy
             Turkey
           Germany
    United Kingdom
                India
               Brazil
          Argentina
     United States
       South Africa
             Mexico
           Australia
            Canada
       South Korea
       Saudi Arabia
              Japan
          Indonesia

                             8
                                  Based on anonymized and aggregated switched volumes across the Mastercard network—includes credit and debit, domestic and cross border.
                             9
                                 “International Tourism Highlights, 2019 edition,” UN World Tourism Organization, 2019.                                                           4
                             10
                                  Based on anonymized and aggregated switched volumes across the Mastercard network—includes credit and debit, domestic and cross border.
Trend to Watch:
Loyalty Programs
Flex
With people unable to travel,
travel loyalty programs are using
creativity and flexibility to keep
members engaged.

For instance, American Airlines is
making it easier for passengers to
earn elite status by granting one
mile toward Million Miler status
for every $1 spent on eligible
AAdvantage credit cards between
May 2020 and December 2020.
And Singapore Airlines’ Miles of
Good campaign aims to raise
100 million miles to donate to
essential workers.

To meet the changing needs of
Mastercard cardholders, we shifted
the focus of our Mastercard Travel
& Lifestyle Services from activities
like booking trips to securing
grocery deliveries and even
sourcing masks. As the recovery
progresses differently around the      Looking at why people are traveling, consumer air travel is recovering faster
world, it will be interesting to see   than commercial air travel. This is a potential concern for airlines because
how loyalty programs continue          commercial travel is the more profitable for airlines of the two.11 Commercial
to flex.                               spend is likely lagging as a result of risk and cost management, while better
                                       video conferencing technology is helping fill the temporary need for in-person
                                       meetings as restrictions remain in place (see figure 5).

                                               Figure 5: Comparison of growth rates of consumer and commercial airline
                                               spend in July 2020 relative to last year12

                                                                        -73%
                                                                                                                                    -84%
                                                                      Consumer                                                   Commercial

                                       11
                                            “Why Airlines Are Rushing to Add Premium Economy Seats,” Financial Times, November 29, 2019.
                                       12
                                            Based on anonymized and aggregated switched volumes across the Mastercard network—includes credit and debit, domestic   5
                                            and cross border.
The Travel Story from the Ground

The number of travelers crossing European borders by land means the actual travel recovery story there is better than
the one told solely by the airlines.

In Europe, cross-border gasoline sales are now surging relative to the rest of the world. The resurgence seems influenced
by the current ease of driving across borders relative to flying, a perception of greater safety in an individual vehicle and
the ability to control the entire journey door to door (see figure 6).

    Figure 6: Percentage growth of cross-border spend at gas stations by region in 2020 relative to the same time last year13

    60%
    40%
    20%
     0%
   -20%
   -40%
   -60%
   -80%
  -100%

                       Europe          Middle East / Africa             Latin America / Caribbean                North America             Asia Pacific

When looking at spending across all modes of transportation, car rentals in Europe have remained relatively steady
compared to pre-Covid levels and now take a larger share of overall spend. While car rentals cover domestic as well
as cross-border travel, geographically small European nations are less reliant on domestic air travel than many larger
nations in other parts of the world. This supports the gasoline story by underlining the current importance of cars as a
mode of cross-border travel (see figure 7).

    Figure 7: Composition of transportation spend in Europe as a share of total transportation spend in 202014

                                                                                            100%

                                                                                              90%
                                                         Airline
                                                         Auto Rental                          80%                                    Other Transport
                                                         Other Transport                      70%

                                                                                              60%

                                                                                              50%

                                                                                              40%                                                Auto Rental
                                                                                              30%

                                                                                              20%                   Airline

                                                                                              10%

                                                                                                0%
                                                                                                     Jan         Feb          Mar         Apr         May         Jun            Jul

                            13
                                 Based on anonymized and aggregated switched volumes across the Mastercard network—includes credit and debit, domestic and cross border.
                            14
                                 Based on anonymized and aggregated switched volumes across the Mastercard network—levels of spending for Europe based on air, auto rental and         6
                                 other travel (e.g., bus, taxi / hire car, cruise ship). The chart on the right shows the same data as a proportion of the total.
Other transportation options in Europe have also grown in share, largely on
account of domestic public transport. Some early spikes were possibly also
influenced by consumers failing to cancel their monthly travel passes once
lockdowns came into effect. Nonetheless, the shift is noteworthy in countries
with a variety of public transportation options, such as Switzerland and
Germany (see figure 8).

      Figure 8: Share of non-air travel spend as a percentage of total travel spend
      in Switzerland and Germany in 202015

      90%

      80%

      70%

      60%

      50%

      40%

      30%

                                   Germany                                           Switzerland

Although Europe is leading the recovery in cross-border gasoline sales, many
countries all over the world are seeing some uptick in domestic gasoline sales as
consumers travel closer to home (see figure 9).

      Figure 9: Percentage growth of gasoline spend across all payment types, in-
      cluding cash, in Brazil, Canada, the UK and the US in 2020 relative to the same
      time last year16
     40%

     20%

     0%

 -20%

 -40%

 -60%

 -80%

                     Brazil                 Canada                    United Kingdom                      United States

15
   Based on anonymized and aggregated switched volumes across the Mastercard network—includes credit and debit, domestic
   and cross border. The chart includes all modes of transportation except air travel and does not include gasoline.
16
   Not price adjusted. Insights from Mastercard SpendingPulse, which measures overall retail sales across all payment types,   7
   including cash and check.
The tendency to travel closer to home also appears in the trajectory of rentals
Trend to Watch: of micromobility solutions, such as scooters and bicycles, in countries like the
United States (see figure 10).
Localism Takes Off as
Consumers Stay
Closer to Home Figure 10: Recovery of micromobility spend in the US in 2020 relative to a
2019 average17
It’s hard to find a bicycle for sale right
now. And it’s not just recreational 100
activities that are happening closer
to home. Auto rentals, bike rentals,
80
gas purchases—they all speak to
consumers getting out and spending but
maintaining a tighter footprint. In 60
The Shift to Digital report, we dubbed
that a “home-centered retail radius.” 40
The focus on local, neighborhood
20
shopping can be a lifeline for small
businesses. But it still doesn’t fully
compensate for overall reduced traffic 0
in their localities. In Canada, our recently Jan Feb Mar Apr May Jun Jul
launched Mastercard Preferred program
offers rebates to cardholders who
spend at partner merchants, including
small businesses. The program has seen Turning to broader entertainment spend, a resurgence in cross-border food &
a seven-fold increase in cardholders beverage sales supports the evidence from gasoline sales that Europeans are
spending at those merchants, and 29% moving across borders (see figure 11).
of cardholders have made a repeat
purchase two months out.
In addition, we’ve seen an uptick in
interest for our Local Market Intelligence
tool, which provides small businesses
insight into local retail sales patterns so
small businesses know how they fit in
the context of their broader market.
17
A seven-day moving average of micromobility solutions. Aggregated from transaction data based on a collection of merchants. 8
Data is indexed to 100 relative to the 2019 average.Figure 11: Percentage growth of cross-border spend on food & beverage by region in 2020 relative to the same
time last year18
60%
40%
20%
0%
-20%
-40%
-60%
-80%
Europe Latin America / Caribbean Asia Pacific North America Middle East / Africa
When looking at the recovery of broader travel & entertainment (T&E) spend,
the ranking of G20 countries is different from what we saw when just looking
at airline spend. While airline spend is limited domestically in smaller countries,
broader T&E spend is not. And Italy, one of the earliest places to be hit hard by
Covid-19, now tops the G20 list (see figure 12).
In this context, T&E includes such activites as flying, eating out and lodging,
but excludes activities like going to the cinema. Italy’s quicker recovery makes
sense in a country with a significant restaurant culture and extensive domestic
tourism down its north–south corridor, which includes the islands of Sardinia
and Sicily.
18
Food & beverage includes all types of restaurant and bar sales. Aggregated Mastercard switched volumes—includes credit and 9
debit, and cross border.Trend to Watch: Figure 12: Recovery of T&E spend in G20 countries in July 2020 relative to
Data Drives the last year (July 2019 = 100)19
Customer Journey 0 20 40 60 80 100
Personalization is nothing new. Italy
Consumers want highly relevant Russia
France
experiences at every stage of the
Australia
travel journey—from an offer for
Germany
a preferred flight to a smiling
United States
concierge at the door. The Brazil
challenge is that just around the Canada
time when pioneering companies South Africa
were starting to connect data Argentina
points across customer journeys, Mexico
the journeys—and the consumers— United Kingdom
dramatically changed. What was Indonesia
once a given may no longer Japan
be relevant. Turkey
Saudi Arabia
China
So, it’s no surprise that we’re
India
seeing increased demand for
South Korea
data-driven insights into evolving
consumer trends, preferences and
needs. In addition, testing which
personalized experiences and Moreover, despite having the largest supply of hotel rooms in Europe, the
offers work is essential.
penetration of international hotel chains in Italy is 5%. Only Albania’s percentage
is lower. By comparison, France has roughly three-fifths the number of hotel
For instance,
we’ve used our rooms and a chain hotel penetration of over four times as much.20 Italy is well
Test & Learn positioned to accommodate an emerging global trend of travelers opting to stay
experimentation in small independent hotels that allow for easier social distancing (see figure 13).
tool to take a
restaurant beyond curbside pickup
and improved delivery options to
adjust menu timing, options and Figure 13: Recovery of spending at small independent hotels in 2020
promotions to accommodate compared to large hotels (January 7, 2020 = 100)21
new behaviors. We’ve also
recently applied it to an airline’s 140
promotional strategy to identify
120
a potential 30% increase in
bookings on select routes. 100
80
60
40
20
-
Jan Feb Mar Apr May Jun Jul Aug
Large Hotels Small Hotels
19
Based on anonymized and aggregated switched volumes across the Mastercard network—credit and debit, domestic and cross
border. Entertainment includes all types of lodging, restaurants and bars.
20
“European Chains & Hotels Report 2019,” Horwath HTL, 2019.
21
Based on anonymized and aggregated switched volumes across the Mastercard network—credit and debit, domestic and cross 10
border. Classification of small versus large hotels are estimated using number of locations.As to why people are traveling, rental cars follow airlines in showing a quicker
recovery of consumer over commercial spend. The reasons are similar, but the
difference is less pronounced in car rentals than air travel presumably as a result
of differences in cost and ease. Land transportation, which includes buses,
taxis and cruise ships but not car rentals, shows a slightly faster recovery in
commercial. But the recovery is still slower in both categories and demonstrates
the overall preference for cars (see figure 14).
Figure 14: Comparison of growth rates of consumer and commercial
transportation in 2020 relative to last year22
Auto Rental Other Transportation
-41% -45%
-53% -50%
Consumer Commercial Consumer Commercial
Departing Words
Whatever the purpose, whether by country or region, or by domestic or cross-
border travel, travel’s horizon is not flat. There’s no escaping the downturn, but
there are also some promising upticks. Once the Covid-19 journey is over, the
story won’t be so much about how people stopped traveling. Rather, it will be
about how their travel behaviors changed along the way.
For more information, please visit
go.mastercardservices.com/recovery-insights
Mastercard SpendingPulse™ reports on national retail sales across all payment types in select markets
around the world. The findings are based on aggregate sales activity in the Mastercard payments
network, coupled with survey-based estimates for certain other payment forms, such as cash and check.
As such, SpendingPulse™ insights do not in any way contain, reflect or relate to actual Mastercard
operational or financial performance, or specific payment-card-issuer data.
The Mastercard SpendingPulse™ data services are intended for informational purposes and not as
investment advice or recommendations for any particular action or investment, and should not be relied
upon, in whole or in part, as the basis for decision-making or investment purposes. SpendingPulse™
reports are not guaranteed as to accuracy and the services are provided on an “AS IS” basis to
authorized users, who review and use them at their own risk.
Mastercard is a registered trademark, and the circles design is a trademark, of Mastercard
International Incorporated. © 2020 Mastercard
22
Aggregated Mastercard total switched volumes—includes credit and debit, domestic and cross border. 11
Other transportation includes buses, taxis / hire cars, cruise ships, etc.You can also read