Evaluation of Predictive Models for Wildlife Poaching Activity through Controlled Field Test in Uganda
←
→
Page content transcription
If your browser does not render page correctly, please read the page content below
Evaluation of Predictive Models for Wildlife Poaching Activity through Controlled
                              Field Test in Uganda
Shahrzad Gholami1 , Benjamin Ford1 , Debarun Kar1 , Fei Fang2 , Milind Tambe1 , Andrew Plumptre 3
  Margaret Driciru 4 , Fred Wanyama4 , Aggrey Rwetsiba4 , Mustapha Nsubaga3 , Joshua Mabonga3
                         1
                       University of Southern California,{sgholami, benjamif, dkar, tambe}@usc.edu,
                                       2
                                         Carnegie Mellon University,feifang@cmu.edu,
                       3
                         Wildlife Conservation Society,{aplumptre, mnsubuga, jmabonga}@wcs.org,
             4
               Uganda Wildlife Authority, {margaret.driciru, fred.wanyama, aggrey.rwetsiba}@ugandawildlife.org

                             Abstract                               account for this temporal component. Third, because poach-
                                                                    ing happens in the real world, there are mutual spatial and
  Worldwide, conservation agencies employ rangers to protect
                                                                    neighborhood effects that influence poaching activity. Fi-
  conservation areas from poachers. However, agencies lack the
  manpower to have rangers effectively patrol these vast ar-        nally, while field tests are crucial in determining a model’s
  eas frequently. While past work modeled poachers behavior         efficacy in the world, the difficulties involved in organizing
  so as to aid rangers in planning future patrols, those mod-       and executing field tests often precludes them.
  els predictions were not validated by extensive field tests. We      In this paper, we summarize our efforts for conduct-
  conducted two rounds of field tests in Ugandas Queen Eliza-       ing field tests in Ugandas Queen Elizabeth Protected Area
  beth Protected Area to evaluate our proposed spatio-temporal      (QEPA) which were reported in details in (Kar et al. 2017)
  model that predicts poaching threat levels. In the first round,   and (Gholami et al. 2017). Also, we discuss our attempts
  a one-month field test was conducted to test the predictive
  power of the model and in the second round an eight-month
                                                                    for extending of such field tests to other protected areas in
  test was conducted to evaluate the selectiveness power of the     Uganda.
  model. To our knowledge, this is the first time that a predic-
  tive model is evaluated through such an extensive field test
  in this domain. These field tests will be extended to another                          Related Works
  park in Uganda, Murchison Fall Protected Area. Once such
  models are evaluated in the field, they can be used to generate   (Nguyen et al. 2016) introduced a two-layered temporal
  efficient and feasible patrol routes for the park rangers.        Bayesian Network predictive model (CAPTURE) that was
                                                                    also evaluated on real-world data from QEPA. CAPTURE,
                        Introduction                                however, assumes one global set of parameters for all of
                                                                    QEPA which ignores local differences in poachers’ behavior.
Wildlife poaching continues to be a global problem as key           While CAPTURE includes temporal elements, it does not
species are hunted toward extinction. For example, the latest       include spatial components and thus cannot capture neigh-
African census showed a 30% decline in elephant popula-             borhood specific phenomena. In contrast to CAPTURE,
tions between 2007 and 2014 (Chase et al. 2016). Wildlife           (Kar et al. 2017) presented a behavior model, INTERCEPT,
conservation areas have been established to protect these           based on an ensemble of decision trees and was demon-
species from poachers, and these areas are protected by park        strated to outperform CAPTURE. While that model ac-
rangers. These areas are vast, and rangers do not have suffi-       counted for spatial correlations, it did not include a temporal
cient resources to patrol everywhere intensively.                   component. In contrast to these predictive models, our latest
   At many sites now, rangers patrol and collect data related       model addresses both spatial and temporal components.
to snares they confiscate, poachers they arrest, and other ob-
                                                                       In game theory literature, learning adversary models has
servations. Given rangers’ resource constraints, patrol man-
                                                                    been mostly done based on simulated games where data
agers could benefit from tools that analyze these data and
                                                                    is collected by human subject experiments in the labora-
provide future poaching predictions. However, this domain
                                                                    tory (Gholami et al. 2016) rather than real world poachers.
presents unique challenges. First, this domain’s real-world
                                                                    It is vital to validate predictive models in the real world,
data are few, extremely noisy, and incomplete. To illustrate,
                                                                    (Critchlow et al. 2016) conducted a controlled experiment
one of rangers’ primary patrol goals is to find wire snares,
                                                                    where their goal, by selecting three areas for rangers to pa-
which are deployed by poachers to catch animals. However,
                                                                    trol, was to maximize the number of observations sighted
these snares are usually well-hidden (e.g., in dense grass),
                                                                    per kilometer walked by the rangers. Their test successfully
and thus rangers may not find these snares and (incorrectly)
                                                                    demonstrated a significant increase in illegal activity detec-
label an area as not having any snares. Second, poaching ac-
                                                                    tion, but they did not provide comparable evaluation metrics
tivity changes over time, and machine learning models must
                                                                    for their predictive model. Also, our second field test was
Copyright c 2018, Association for the Advancement of Artificial     much larger in scale, involving 27 patrol posts compared to
Intelligence (www.aaai.org). All rights reserved.                   their 9 posts.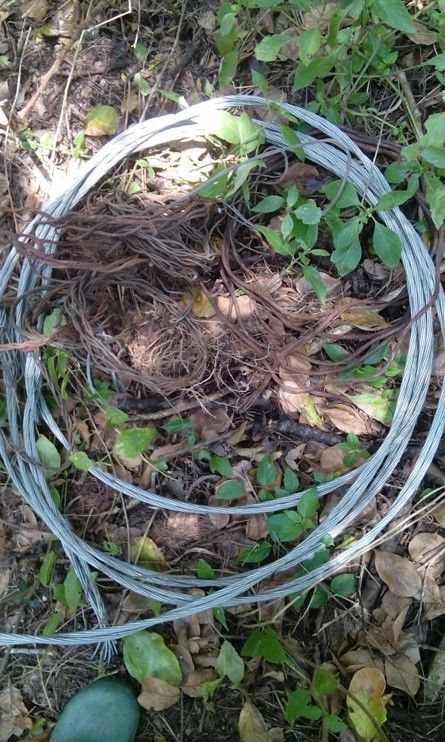
Wildlife Crime Dataset get. Due to the large amount of missing inspections and un-
This study’s wildlife crime dataset is from two wildlife con- certainty in the collected data, more complex models like
servation parks in Uganda. There are several patrol posts sit- MRF with hidden layer for latent poaching activity focuses
uated across the parks from which Uganda Wildlife Author- on learning poaching activity only over regions that have
ity rangers conduct patrols to apprehend poachers, remove been continually monitored in the past. The spatio-temporal
any snares or traps, monitor wildlife, and record signs of il- model is designed to account for temporal and spatial trends
legal activity. Along with the amount of patrolling effort in in poaching activities. However, since learning those trends
each area, both datasets contain 14 years (2003-2016) of the and capturing spatial effects are impacted by the variance
type, location, and date of wildlife crime activities. in local poachers’ behaviors, a geo-clustered model was ex-
Rangers lack the manpower to patrol everywhere all the amined which consists of multiple sets of local parameters
time, and thus illegal activity may be undetected in unpa- throughout QEPA with spatial effects.
trolled areas. Patrolling is an imperfect process, and there For geo-clustered models, for targets in the continually
is considerable uncertainty in the dataset’s negative data monitored subset (where temporally-aware models can be
points (i.e., areas being labeled as having no illegal activity); used practically), the MRF model’s performance varied
rangers may patrol an area and label it as having no snares widely across geo-clusters according to the experiments.
when, in fact, a snare was well-hidden and undetected. These Thus, for each geo-cluster, if the average Catch Per Unit
factors contribute to the dataset’s already large class imbal- Effort (CPUE), is relatively large, the MRF model is used.
ance. It is thus necessary to consider models that estimate In Conservation Biology, CPUE is an indirect measure of
hidden variables (e.g., whether an area has been attacked). poaching activity abundance. A larger average CPUE for
We divide the parks into 1 square kilometer grid cells, and each cluster corresponds to more frequent poaching activ-
we refer to these cells as targets. Each target is associated ity and thus more data for that cluster. Consequently, us-
with several static geospatial features such as terrain (e.g., ing more complex spatio-temporal models in those clusters
slope), distance values (e.g., distance to border), and animal becomes more reasonable. To compute CPUE, effort corre-
density. Each target is also associated with dynamic features sponds to the amount of coverage (i.e., 1 unit = 1 km walked)
such as how often an area has been patrolled (i.e., coverage) in a given target, and catch corresponds to the number of ob-
and observed illegal activities (e.g., snares). servations. Hence, boosting is done selectively according to
the average CPUE value; some clusters may not be boosted
by MRF, and so only Bagging ensemble model is used for
Hybrid of Markov Random Fields and making predictions on them. Experiments on historical data
Bagging Ensemble show that selecting 15% of the geo-clusters with the highest
(Kar et al. 2017) proposed INTERCEPT, which is a model average CPUE results in the best performance for the entire
based on an ensemble of decision trees. This model was hybrid model (Gholami et al. 2017).
shown to predict poachers’ attacks more effectively com-
pared to the previous models. The first round of experi- Experiment A: One-month Field Test
ments was conducted based on this technique. To improve In the first round of the experiments, INTERCPET (or in
the predictive accuracy even more, the next generation of the short INT) was tested to evaluate the predictive ability of
predictive models which was a hybrid of Markov Random the model. After development and evaluation of the model
Fields and Bagging ensemble was developed in (Gholami et on historical data, it was deployed to the field. Based on
al. 2017). the predictions, two patrol areas were chosen for QEPA
Since the amount and regularity of data collected by rangers to patrol for one month. These areas were selected
rangers varies across regions of QEPA, predictive models (approximately 9 square km each) such that they were (1)
perform differently in different regions. As such, the lat- predicted to have multiple attacks and (2) previously in-
ter paper proposed using different models to predict over frequently patrolled as rangers did not previously consider
different regions; first, a Bagging ensemble model is used, these as important as other areas (and thus are good areas to
and then predictions were improved in some regions us- test the model predictions). After providing the rangers with
ing the spatio-temporal model with graphical modeling ap- GPS coordinates of particular points in these areas, they pa-
proaches, i.e, Markov Random Fields (MRF). A Bagging trolled these areas on foot and utilized their expert knowl-
ensemble model or Bootstrap aggregation technique, called edge to determine where exactly in these areas they were
Bagging, is a type of ensemble learning which bags some most likely to find snares and other signs of illegal human
weak learners, such as decision trees, on a dataset by gen- activity (e.g., salt licks, watering holes). On each patrol, in
erating many bootstrap duplicates of the dataset and learn- addition to their other duties, rangers recorded their obser-
ing decision trees on them. Each of the bootstrap duplicates vations of animal sightings (i.e., 21 animals were sighted in
are obtained by randomly choosing M observations out of M one month) and illegal human activity. The key findings are
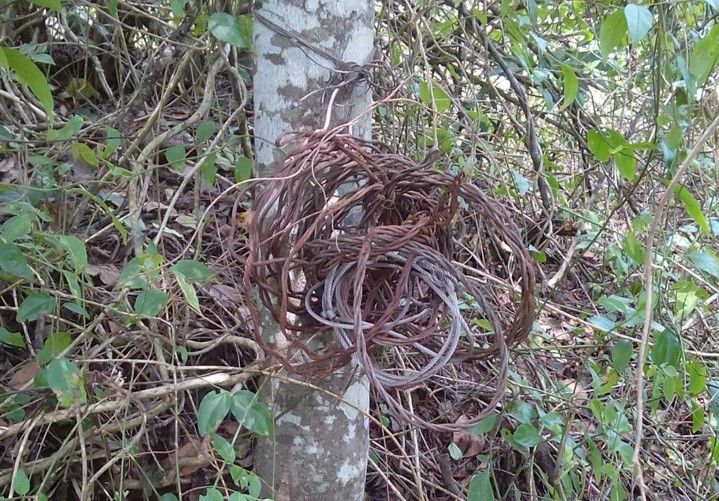
with replacement, where M denotes the training dataset size. demonstrated in Tables 1 and 2 and a selection of photos
Finally, the predicted response of the ensemble is computed taken by park rangers are shown in Figures 1(a) and 1(b).
by taking an average over predictions from its individual de- The most noteworthy findings of these patrols are those re-
cision trees. lated to elephant poaching; rangers, unfortunately, found one
Capturing temporal trends requires a sufficient amount of poached elephant with its tusks removed. However, this re-
data to be collected regularly across time steps for each tar- sult demonstrates that poachers find this area, predicted by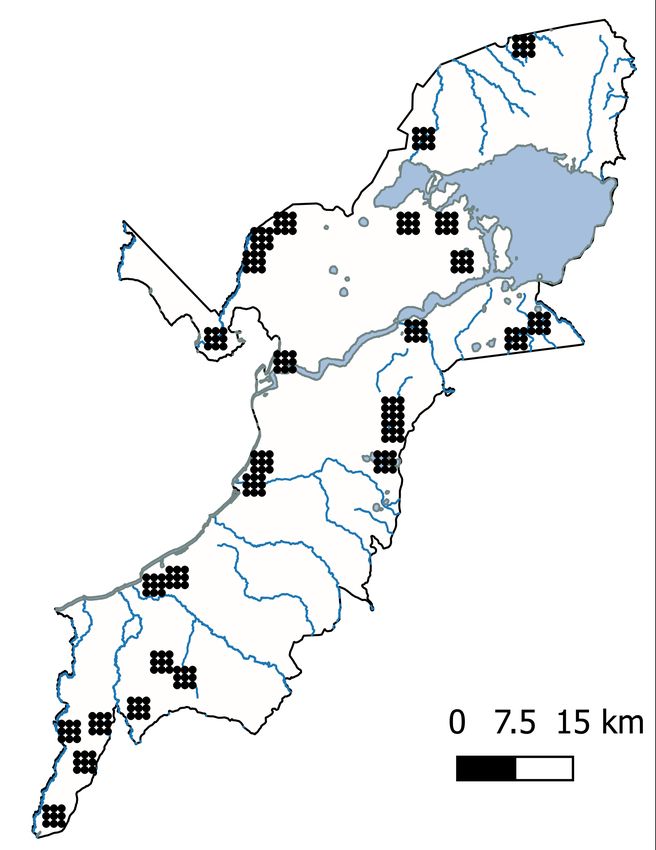
Week#     Illegal Activity      Count                          Crime Type        INT                      Average             Percentile
            2         Trespassing              19                          AnimalCom            1                        0.16                  89%
            3         Active Snares             1                          AnimalNoncom         3                        0.73                  91%
                      Plant Harvesting          1                          Fishing              1                        0.73                  79%
            4         Poached Elephants         1                          PlantNoncom          1                        0.46                  76%
                      Elephant Snare Roll       1                          Trespassing         19                        0.20                 100%
                      Antelope Snares          10                          Total               25                        2.28
                      Fish Roasting Racks       2
                                                                        Table 2: Base Rate Comparison: Hits per Month
    Table 1: Real World Patrol Results: Illegal Activity

                                                                                                                      8

                                                                                                    Number of Areas
                                                                                                                      6
                                                                                                                      4
                                                                                                                      2
                                                                                                                      0

                    (a)           (b)                                                                                     Area's Attack Prediction Rate

                                                                             (a) Patrolled areas                  (b) Prediction rates
Figure 1: Elephant snare roll found by rangers directed by
INT Photo credit: Uganda Wildlife Authority ranger
                                                                                 Figure 2: Patrol Area Statistics

the model, attractive for poaching but they had missed to
visit them thoroughly in the past. On a more positive note,       were shown to be outperforming the previous ones. Exper-
the model’s predictions led rangers to find many snares be-       iment A was conducted in collaboration with the Wildlife
fore they caught any animals: one large roll of elephant          Conservation Society (WCS) and the Uganda Wildlife Au-
snares, one active wire snare, and one cache of ten antelope      thority (UWA) and showed promising improvements over
snares. In fact, the machine learning model predictions as-       previous patrolling regimes. Due to the difficulty of organiz-
sisted rangers’ efforts in potentially saving the lives of mul-   ing such a field test, its implications were limited: only two
tiple animals including elephants.                                9-sq km areas (18 sq km) of QEPA were patrolled by rangers
   In addition to wildlife signs, which represent areas of in-    over a month. Because of its success, however, WCS and
terest to poachers, the findings of trespassing (e.g., litter,    UWA graciously agreed to a larger scale, controlled experi-
ashes) are significant as these represent areas of the park       ment: also in 9 sq km areas, but rangers patrolled 27 of these
where humans were able to enter illegally and leave with-         areas (243 sq km, spread across QEPA) over eight months;
out being detected; if we can continue to patrol areas where      this is the largest to-date field test of ML-based predictive
poachers are visiting, rangers will eventually encounter the      models in this domain. We show the areas in Figure 2(a).
poachers themselves.                                              Note that rangers patrolled these areas in addition to other
   So as to provide additional context for these results, set     areas of QEPA as part of their normal duties.
of base rates are presented in Table 2. These base rates,            This experiment’s goal was to determine the selectiveness
computed in and around the proposed patrol areas, corre-          of the hybrid model’s snare attack predictions mentioned
spond to the average number of observed crimes per month          earlier in this paper: does the model correctly predict both
from 2003-2015. Animal commercial (AnimalCom) crimes              where there are and are not snare attacks? We define attack
correspond to elephant, buffalo, and hippopotamus poach-          prediction rate as the proportion of targets (a 1 km by 1 km
ing; animal noncommercial (AnimalNoncom) corresponds              cell) in a patrol area (3 by 3 cells) that are predicted to be
to all other poaching and poaching via snares; and plant          attacked. We considered two experiment groups that corre-
noncommercial (PlantNoncom) corresponds to illegal har-           sponded to the hybrid model’s attack prediction rates from
vesting of non-timber forest products (e.g., honey). The per-     November 2016 - March 2017: High (group 1) and Low
centile rank corresponds to the number of months where the        (group 2). Areas that had an attack prediction rate of 50%
deployed patrols recorded more observations than in the his-      or greater were considered to be in a high area (group 1);
torical data. For animal noncommercial crime, there was an        areas with less than a 50% rate were in group 2. For ex-
average of 0.73 attacks observed monthly; for the deployed        ample, if the model predicted five out of nine targets to be
patrols, there were 3 separate observations (such as a roll of    attacked in an area, that area was in group 1. Due to the
elephant snares), and in 91% of the months from 2003-2015,        importance of QEPA for elephant conservation, we do not
2 or fewer observations were recorded.                            show which areas belong to which experiment group in Fig-
                                                                  ure 2(a) so that we do not provide data to ivory poachers. To
                                                                  start, we exhaustively generated all patrol areas such that (1)
     Experiment B: Eight-month Field Test                         each patrol area was 3x3 sq km, (2) no point in the patrol
As the efforts for improving model performance continued,         area was more than 5 km away from the nearest ranger pa-
it was important to extend the field test to evaluate the pre-    trol post, and (3) no patrol area was patrolled too frequently
dictive power and selectiveness of the new models which           or infrequently in past years (to ensure that the training data
the first of its kind for Machine Learning models in this do-
Table 3: Patrol Area Group Memberships main, demonstrated that the Machine Learning model’s su-
Group All Patrol Areas Final Patrol Areas
perior predictive performance in the laboratory extends to
High 50 (9%) 5 (19%)
Low 494 (91%) 22 (81%)
the real world.
Experiment C: Ongoing Field Test
Table 4: Field Test Results: Observations To evaluate the capability of the models to be generalized
Group Counts (%) Mean (std) Effort CPUE to other conservation areas, we aim to test it in Murchi-
High 15 (79%) 3 (5.20) 130 0.12 son Fall park in Uganda. Basically, two datasets (i.e., Queen
Low 4 (21%) 0.18 (0.50) 322 0.01 Elizabeth and Murchison Fall) have similar set of covari-
ates and features, however, the amount of poaching activi-
ties detected in them are different. So we are extending the
associated with all areas was of similar quality); in all, 544 field tests in collaboration with Wildlife Conservation So-
areas were generated across QEPA. Then, using the model’s ciety and the Uganda Wildlife Authority. While the target
attack predictions, each area was assigned to an experiment regions are selected from three groups of low, medium and
group. Because we were not able to test all 544 areas, we se- high in terms of likelihood of poaching activity occurrence,
lected a subset such that no two areas overlapped with each they are transferred to the park rangers without group labels.
other and no more than two areas were selected for each pa- The field tests are planned to begin in late November, 2017.
trol post (due to manpower constraints). In total, 5 areas in Acknowledgments: This research was supported by
group 1 and 22 areas in group 2 were chosen. Note that this MURI grant W911NF-11-1-0332, NSF grant with Cornell
composition arose due to the preponderance of group 2 areas University 72954-10598. We are grateful to the Wildlife
(see Table 3). Conservation Society and the Uganda Wildlife Authority for
We provide a breakdown of the areas’ exact attack pre- supporting data collection in QEPA.
diction rates in Figure 2(b); areas with rates below 56%
(5/9) were in group 2, and for example, there were 8 areas References
in group 2 with a rate of 22% (2/9). Finally, when we pro- Chase, M. J.; Schlossberg, S.; Griffin, C. R.; Bouché, P. J.;
vided patrols to the rangers, experiment group memberships Djene, S. W.; Elkan, P. W.; Ferreira, S.; Grossman, F.; Kohi,
were hidden to prevent effects where knowledge of predicted E. M.; Landen, K.; et al. 2016. Continent-wide survey re-
poaching activity would influence their patrolling patterns veals massive decline in african savannah elephants. PeerJ
and detection rates. The field test data we received was in 4:e2354.
the same format as the historical data. However, because
rangers needed to physically walk to these patrol areas, we Critchlow, R.; Plumptre, A. J.; Alidria, B.; Nsubuga, M.;
received additional data that we have omitted from this anal- Driciru, M.; Rwetsiba, A.; Wanyama, F.; and Beale, C. M.
ysis; observations made outside of a designated patrol area 2016. Improving law-enforcement effectiveness and effi-
were not counted. Because we only predicted where snaring ciency in protected areas using ranger-collected monitoring
activity would occur, we have also omitted other observa- data. Conservation Letters.
tion types made during the experiment (e.g., illegal cattle Gholami, S.; Wilder, B.; Brown, M.; Thomas, D.; Sintov, N.;
grazing). We present results from this eight-month field test and Tambe, M. 2016. Divide to defend: Collusive security
in Table 4. To provide additional context for these results, games. In GameSec, 272–293. Springer.
QEPA’s park-wide historical CPUE is also computed (from Gholami, S.; Ford, B.; Fang, F.; Plumptre, A.; Tambe, M.;
November 2015 to March 2016): 0.04. Driciru, M.; Wanyama, F.; Rwetsiba, A.; Nsubaga, M.; and
Areas with a high attack prediction rate had significantly Mabonga, J. 2017. Taking it for a test drive: a hybrid
more snare sightings than areas with low attack prediction spatio-temporal model for wildlife poaching prediction eval-
rates (15 vs 4). This is despite there being far fewer group 1 uated through a controlled field test. In Proceedings of the
areas than group 2 areas (5 vs 22); on average, group 1 areas European Conference on Machine Learning & Principles
had 3 snare observations whereas group 2 areas had 0.18 and Practice of Knowledge Discovery in Databases, ECML
observations. It is worth noting the large standard deviation PKDD.
for the mean observation counts; the standard deviation of Kar, D.; Ford, B.; Gholami, S.; Fang, F.; Plumptre, A.;
5.2, for the mean of 3, signifies that not all areas had snare Tambe, M.; Driciru, M.; Wanyama, F.; Rwetsiba, A.; Nsub-
observations. Indeed, two out of five areas in group 1 had aga, M.; et al. 2017. Cloudy with a chance of poaching: Ad-
snare observations. However, this also applies to group 2’s versary behavior modeling and forecasting with real-world
areas: only 3 out of 22 areas had snare observations. poaching data. In Proceedings of the 16th Conference on
Catch per Unit Effort (CPUE) results are presented in Autonomous Agents and MultiAgent Systems, 159–167. AA-
Table 4. When accounting for differences in areas’ effort, MAS.
group 1 areas had a CPUE that was over ten times that of
Nguyen, T. H.; Sinha, A.; Gholami, S.; Plumptre, A.; Joppa,
group 2 areas. Moreover, when compared to QEPA’s park-
L.; Tambe, M.; Driciru, M.; Wanyama, F.; Rwetsiba, A.;
wide historical CPUE of 0.04, it is clear that the new hybrid
Critchlow, R.; et al. 2016. Capture: A new predictive anti-
model successfully differentiated between areas of high and
poaching tool for wildlife protection. 767–775. AAMAS.
low snaring activity. The results of this large-scale field test,You can also read