Thomas Uva Director of Environmental Science & Compliance Narragansett Bay Commission - Rhode Island ...
←
→
Page content transcription
If your browser does not render page correctly, please read the page content below
Thomas Uva
Director of Environmental Science & Compliance
Narragansett Bay Commission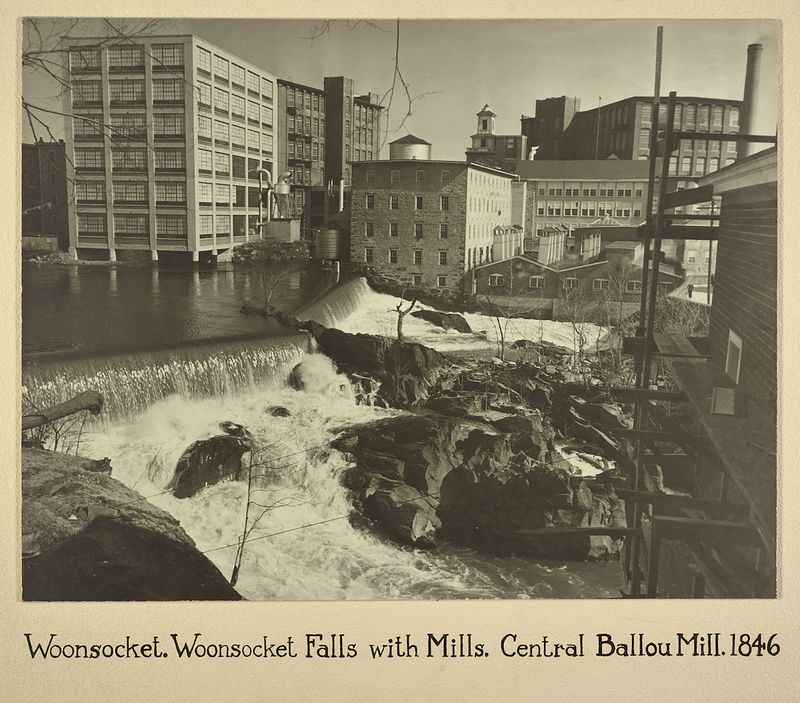
Dissolved
                           Habitat                                                                   Eelgrass
                                                                  Oxygen
                          Diversity                                                                   Beds
                                                                 >4.8 mg/L

                                                            Dissolved Oxygen                     Eelgrass Beds
                      Habitat Diversity                         >4.8 mg/L

                                                              Ecosystem
Navigable                                                       based                                                      Harvestable
 Rivers                                                      management                                                     Shellfish
(fish & humans)                    Sustainable                                            Holistic

Navigable Rivers                                                                                                   Harvestable Shellfish
    (fish & people)
                                                          EPAGoal:
                                                              GOAL:
                                                           Fishable
                                                            Fishable
                                                           Swimmable
                                                          Swimmable
  Viable
 Fisheries
(safe to eat)                  Cooperation                                                Collaboration                      Clean
                                                                                                                           sediment
Viable Fisheries
     (safe to eat)
                                                 Shared Vision               Compromise
                                                                                                                      Clean Sediment

             Increased                                                                                          Open Upper
               Water                                             Biological
                                                                                                                   Bay
               clarity                                           Diversity
                                                                                                                 Beaches
                                                                                                                Open Upper Bay
   Increased Water Clarity                                Biological Diversity
                                                                                                                   Beaches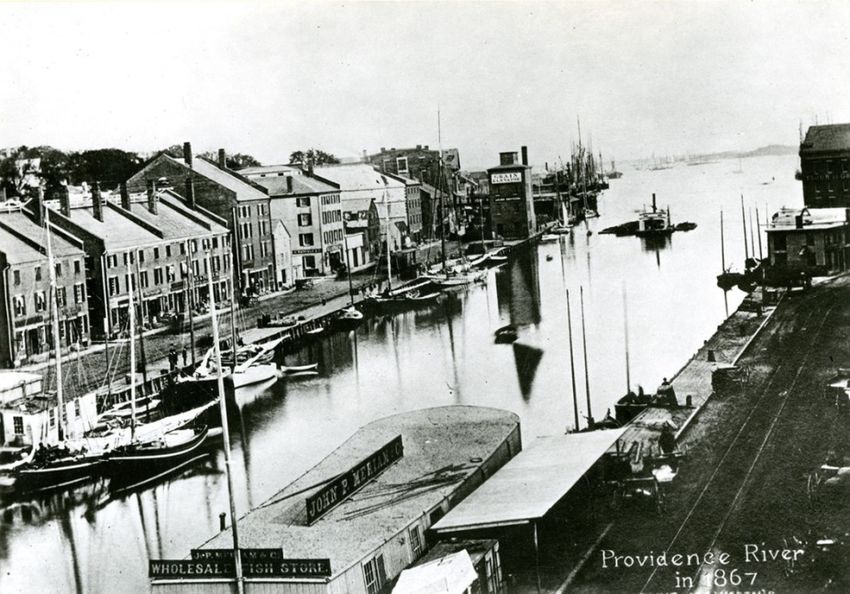
•   Loss of wetlands & eelgrass
                                    •   Contaminated Sediments
                                    •   Alteration of coastline
                                    •   Circulation and Flushing Issues
                                    •   Climate Change
                                    •   Installed Dams & Breakwalls
                                    •   Silted up Rivers/Filled Bay
                                    •   Impervious cover/Runoff
                                    •   Stratification of the Water Column
                                    •   Changes in Bay Fisheries
   www.waikatoregion.govt.nz

Many Ecosystem-wide problems
   began decades ago…
                               Need to look at Historical Record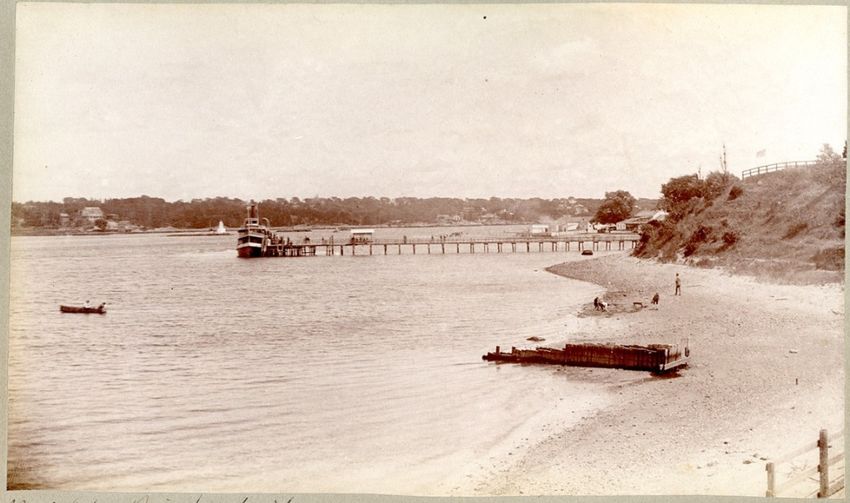
•   Mid 1800s                                                                                               Tallman &
     •   Fishermen report hugely abundant and diverse                                                       Mack Fish &
         fish populations
                                                                                                            Trap Co. Inc.
     •   Atlantic salmon, herring, smelt, scup, tautog, sea
                                                                                                            Spring Wharf,
         bass, cod, striped bass and shad
     •   Lobster and shellfish were abundant
                                                                                                            Newport, RI,
                                                                                                            date unknown
•   Late 1800s                                                                                              Providence Public Library,

     • Highest oyster yield in Providence River
                                                                                                            Providence, RI

     • Scallops and clams abundant in Greenwich Bay,
       Pawtuxet, Apponaug
•   1870 - Atlantic salmon fishery is lost
•   Early 1900’s: 500 dams in RI
•   1930s
     •   River herring fishery is significantly depleted
     •   Eel grass beds die from waste disease
     •   Scallops decline due to habitat loss, decreased
         water clarity
•   1950s
     •   Improved fishing technologies lead to
         overfishing and declines in commercial stock
         species                                              Scalloptown, East Greenwich, RI,
                                                              date unknown https://patch.com/rhode-
                                                              island/eastgreenwich/scalloptown-really-was-here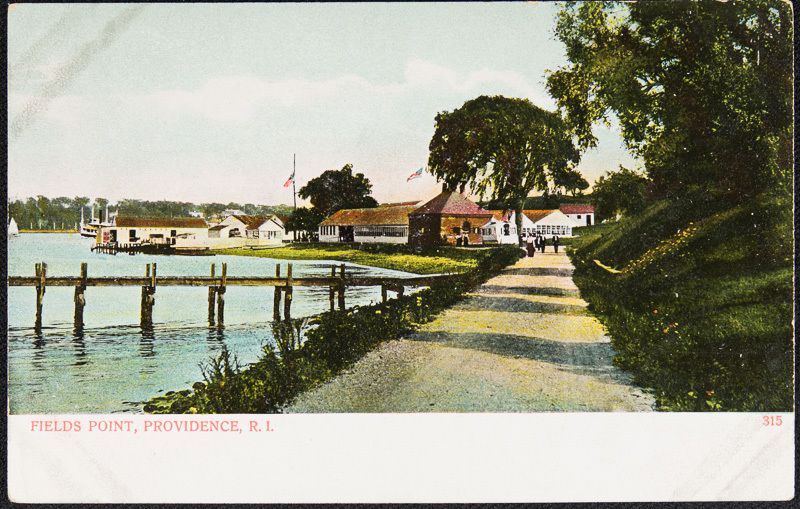
• Present Day:
  • Over 700 dams in RI
    üCaused excess siltation, decreasing river depth,
      deprecation of benthic habitats, loss of fish runs
    üDam removal and fish ladder restorations
     look promising
                                                           Slater Mill.
  • More than 50 percent of Narragansett Bay’s                                       Rhode Island Collection, Providence
                                                           Public Library, 1955, Pawtucket, RI.

   salt marshes have been destroyed in the past
   300 years
  • Winter flounder stocks have declined 90%
   since the 1980s   (NOAA)

  • Since 1981, annual winter flounder landings
   have dropped from nearly 10 million pounds to
   less than 2 million (DEM)
                                                            Fish ladder, Manton Dam,
  • Lobsters have been in decline since 2001                Woonasquatucket River.
                                                            http://johnstonsunrise.net/stories/a-fish-swims-through-
                                                            them,123103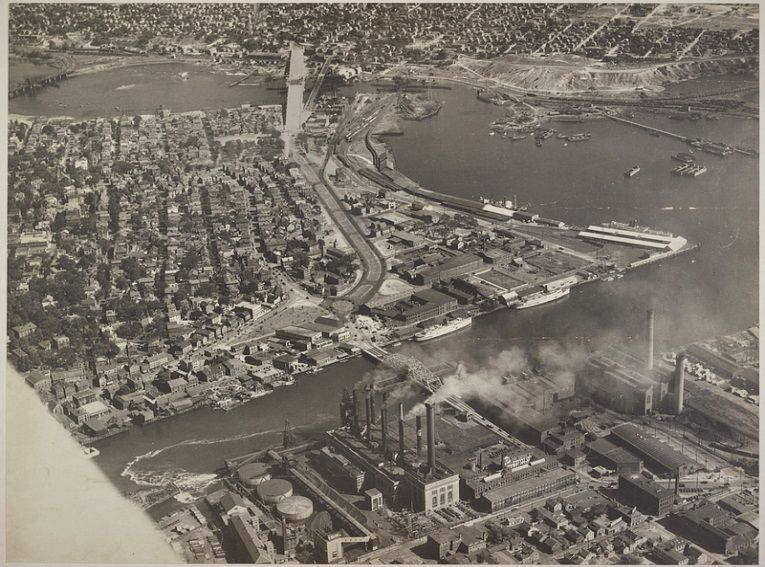
• Major changes in species of                            Oviatt et al., 2003
  Shellfish harvested over time
• Oyster Productivity Reached its
  peak in 1910
• Leased oyster beds covered 5,000
  acres in the Providence River &
  upper Bay (Fuller 1905)
• Generated $45,000 in 1903 dollars
  from lease fees (Fuller 1905)
• Produced ~7,000 metric tons of
  oysters a year (Rice et al 2000)
• People became sick from
  contaminated oysters due to
  bacterial pollution
• Fishery began to decline in 1911 due
  to anthropogenic inputs, disease &
  Great Hurricane of 1938
                                         Field’s Point, 1911; Photo in 41°N (vol 4; issue 2); from 1912 annual report
                                         of the RI Shellfisheries Commission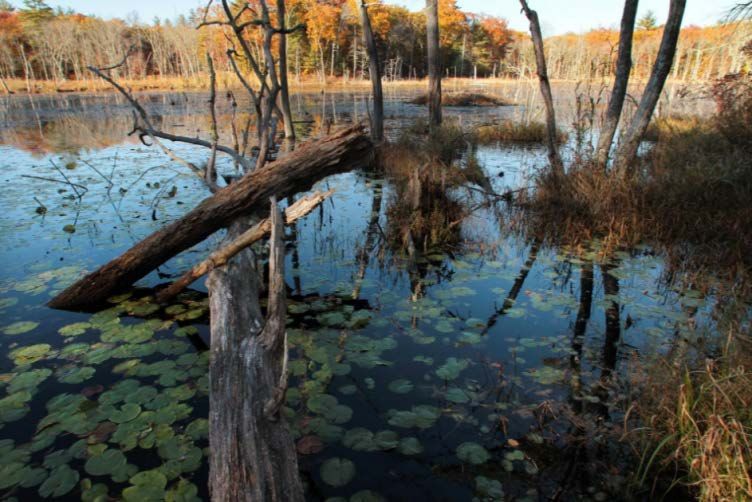
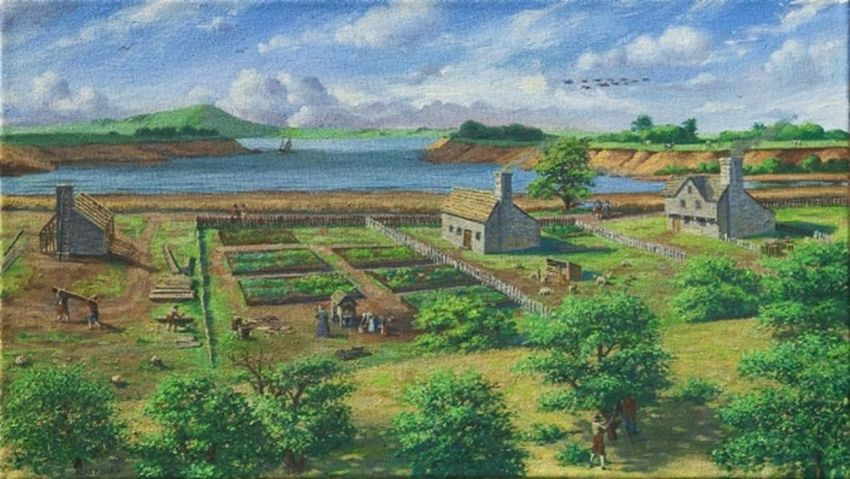
• The “Great Salt
 Cove” in Providence
 circa 1650
• The RI Statehouse
 would later be built
 on the plateau on the
 right

                                 https://www.npca.org/parks/roger-williams-national-memorial

                         •View of the cove from
                         Smith Hill in 1880…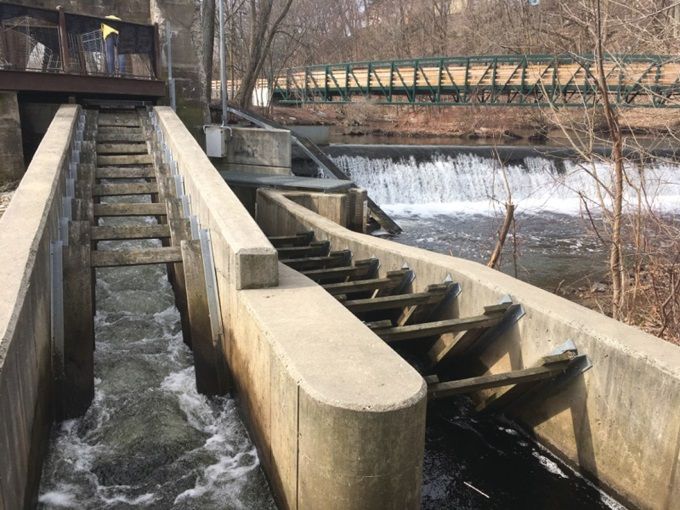
• 1636
   ü First European settlement at Providence
   ü RI population remains low through Colonial Period
• 1660
   ü Beaver population in Narragansett Bay is depleted by fur
     trade
   ü Removal of beavers increases stream flow and sedimentation
• 1700
   ü Land cleared for agriculture                                 Beaver Pond, Exeter, RI
                                                                  http://www.providencejournal.com/article/20151026/NE
   ü ~78% of RI is forested (95% pre-European)                    WS/151029423

• 1775 - Jewelry industry begins in Providence, RI
• 1790 – Birth of the Industrial Revolution
   üSamuel Slater introduces factory system at Moses Brown’s
     cotton factory on the Blackstone River
• 1800 - A period of rapid population growth begins in
  Providence, averaging 3.1% per year from 1800-1910
• 1820 - ~54% of RI is forested
• 1830 – 27 Jewelry Firms/280 Workers
• 1840 - Cotton mills concentrated on Blackstone, woolen          Farm family, Portsmouth, RI, 1885
          mills in SW RI                                          Rhode Island Collection, Providence Public Library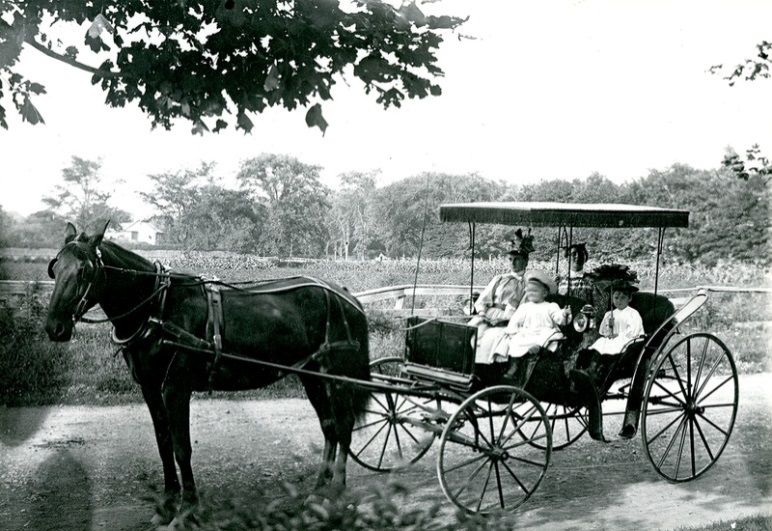
•   1850
     ü 9,200 farms exist in the Narragansett Bay watershed
           ü More cleared land used for animals than for crops
     ü Cleared land increases sedimentation
•   1853
     ü First dredging in Providence River
•   Late 1850s
     üCoal-tar dyes introduced in textile industry (contain heavy
       metals)
     ü57 Jewelry Firms/590 Workers
•   1860
     ü     Providence leading industrial center in south NE, manufactures
           steam engines
     ü     RI most industrialized state in nation from Civil War through 1900
                                                                                  Providence Public Library, Providence, RI
     ü     RI became one of the most industrialized states with large numbers
           of textile factories
     ü     The state also had significant machine tool, silverware, and costume
           jewelry industries
•   Late 1800’s
     ü     Rhode Island Largest Jewelry Manufacturer in country
     ü      Produces 25% of Nations Jewelry
     ü      Sediment core samples show significant increases in Metals
         including zinc, copper, lead, and chromium during this time period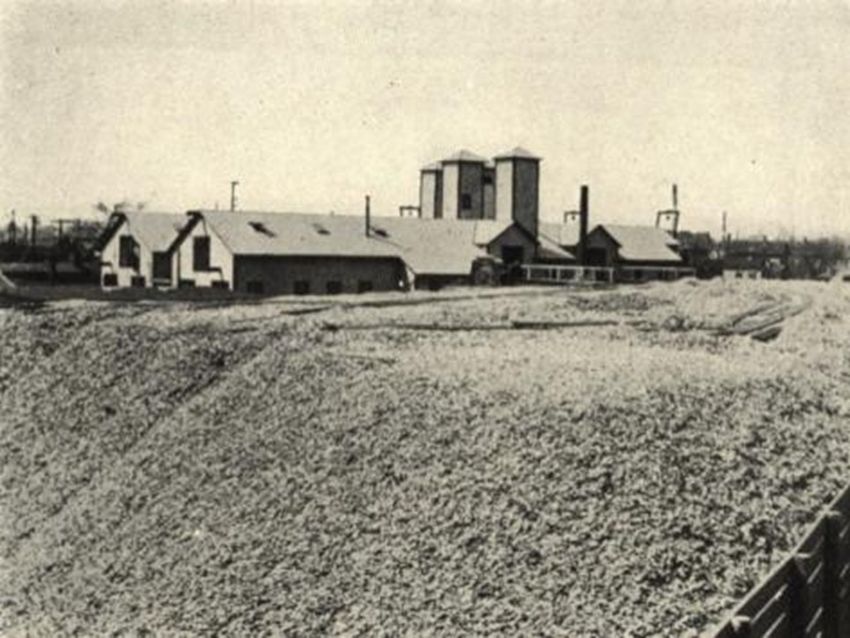
• 1938
   üThe Bay has changed from mostly hard-
    bottomed to mostly soft-bottomed due to
    siltation
   üGreat New England Hurricane of 1938
• 1966 – Providence Hurricane Barrier Completed
• 1970s:
   üJewelry Manufacturing peaked. Providence is                       Providence River, 1895

    the “Jewelry Capital of the World”
   ü32,500 jewelry workers in RI
• Present Day
   üManufacturing and jewelry production
    declined in Rhode Island
   üExisting Manufacturing Firms Treat toxics to
    remove pollutants
   ü ~59% of state (393,000 acres) still forested
    (DEM)
                                                    Fox Point, Providence, 1930
                                                    Rhode Island Collection, Providence Public Library
• Field’s Point in 1800s:
Farmlands, Fishing & Trade
Providence Public Library, Providence, RI•Field’s Point in 1800s:
Farmlands, Fishing & Trade
Rhode Island Collection, Providence Public Library• Field’s Point was noted for its
famous Clam Bakes and
waterfront picnic grounds in
the 1800s
Providence Public Library, Providence, RI•Field’s Point in 1800s:
Farmlands, Fishing & Trade
Providence Public Library, Providence, RI
https://onerhodeislandfamily.com/2012/10/02/a-walk-through-downtown-providence-1908/•Field’s Point early 1900s:
Fishing & Trade
•Oystering was the major
business
Rhode Island Collection, Providence Public Library
Rhode Island Collection, Providence Public Library•Field’s Point early 1900s:
Farmlands and Fishing
•Oystering was the major
business
Rhode Island Collection, Providence Public Library• Industrial Working Waterfront • Significant Shipping Port
• Scrap Metals Operations
• Rhode Island’s Largest Export
• Salt Storage and Distribution
• Where does all this salt end
  up???
• Coal Storage and
  Distribution
• Coal Storage and Distribution
• Where does that dust settle???
• Fuel Oils, LNG Storage
  & Distribution
• Cement Storage &
  Distribution
• NBC Sewage Treatment
  plant, a university,
  lumber yard, chemical
  mfg, and various other
  businesses…
Environmental Regulation is Relatively new in the Bay’s Timeline:

• 1842 - Commission of Shellfisheries established
               •   Regulates the leasing of public lands to oyster cultivation
• 1870 - Commission of Inland Fisheries established
               •   Regulates inland fisheries
• 1899 - Commission of Birds established
               •   Enforces laws relating to game and birds
• 1935 - Commissions of Shellfisheries, Birds, and Inland Fisheries              joined under the
 Division of Fish and Game
• 1965 - Division of Fish and Game replaced by Department of Natural Resources
• 1971 – RI Coastal Resources Management Council established
• 1972 - Clean Water Act Established
• 1978 - Department of Natural Resources replaced by Department of Environmental
 Management (RIDEM)
• RI Pretreatment Programs began to enforce Clean Water Act regulation for toxics in 1980s • Pretreatment Programs have been very successful reducing toxic pollutants to the Bay • 97.4 % Reduction toxics discharged to Field’s Point since 1981 • Similar Reductions in Toxics Discharged to Bay
• 1700s -Sewage flows directly
 into local rivers, in the belief
 that dilution will render the
 waste harmless

• 1870s -The City of Providence
 constructs a sewer system to
 discharge City’s waste into
 Providence’s urban rivers and
 harbor

• 65 sewer outfalls built to
 directly discharge to Rivers
• Animal waste would be
 flushed off streets into
 the rivers

• 1884 - Providence
 recognizes need to treat
 sewage City. Engineer
 Samuel M. Gray
 recommends
 interceptors to a
 chemical precipitation
 plant at Field’s Point

• 1892 - Interceptor
 sewers began carrying
 sewage from the city of
 Providence to Field’s
 Point, where it is
 conveyed into the Bay
• 1901 - The Providence Sewage
 chemical precipitation plant opens at
 Field’s Point. Sewage was dewatered
 and sludge used as fill on site.
• 1908 - The plant’s capacity is no longer
 adequate. Sludge was dumped east of
 Prudence Island in the Bay.                 Field’s Point Filter Station, 1908
• 1910 - A Shellfish Commission study
                                             Providence Public Library, Providence, RI

 finds significant sewage contamination
 in oyster beds
• 1912 - Bleaching of the effluent is
 added at Field’s Point, reducing
 bacteria in the effluent by 97%

                                             Field’s Point Sludge Train, 1910
                                             Providence Public Library, Providence, RI
• 1930s
ü Field’s Point plant upgraded to activated sludge process
ü Woonsocket secondary treatment plant build
• 1942
ü Cranston secondary treatment plant built
• 1949
ü Sludge from Field’s Point is no longer dumped directly
into the Bay
• 1965 Field’s Point 1984
Providence Public Library, Providence, RI
ü Warwick builds secondary treatment plant
• 1970's
ü Field’s Point plant in poor repair; nearly 65 MG of untreated sewage flow into Bay daily
ü East Providence WWTF upgraded to secondary treatment in 1976
• 1980’s
ü NBC acquires the Field’s Point WWTF and begins transforming the failing facility
ü $100 million Field’s Point upgrade complete
• 1991
ü Newport WWTF upgraded from primary to secondary treatment
• 1992
ü NBC begins operating Bucklin Point WWTF• 1998 - Sodium hypochlorite wet weather
disinfection systems installed at Field’s
Point and Bucklin Point
• 1999 - Sodium bisulfite dechlorination
added at Field’s Point
• 2004-2005 - NBC upgrades Bucklin Point
WWTF to meet a TN limit of 8.5 mg/L &
install UV at a cost of $77 million
• 2008 - NBC’s Phase I CSO Tunnel is put
into operation, cost $359 million
• 2013 - IFAS system at Field’s Point
complete; cost $31 million
• 2014 - Present
üBNR upgrades are complete at Bucklin
Point; cost $13 million
üCSO Phase II Complete, Costs $270
Million
üCSO Phase III Project Begins - will cost
about $850 Million• 1854 – Providence’s 2nd cholera outbreak
in 5 years (150 die)
• By the early 1900s, it became apparent that
the discharge of untreated wastewater was
causing detrimental effects to receiving
waters and public health.
• Field’s Point effluent treated with bleach
beginning in 1912
• Water disinfection a huge public health
success.
• By 1940, incidence of waterborne
diseases had decreased dramatically http://waterandhealth.org/drinkingwater/whitepapercl.html
across the United States, due to the
prevalence of proper wastewater and water
treatment systems.
• Typhoid mortality decreased 96% from
1900-1936 (Cutler and Miller 2004).• Field’s Point
• Sodium hypochlorite chlorination (installed in 1998)
• Sodium bisulfite dechlorination (added in 1999)
üConverts remaining residual chlorine to chloride ion
(constituent of seawater)
• Bucklin Point
üUltraviolet (UV) disinfection system
• NBC Total Residual Chlorine
• Averages 2.5 µg/L
ü 96% below permit limit https://www.alibaba.com/product-detail/UV-Disinfection-China-wastewater-
treatment-plant_60106086822.html
• RIDEM limit = 65 µg/L
ü Meets EPA limit to prevent chronic and acute effects in
aquatic organisms• Began in 2010
• 5 beaches tested for Enterococci
• Sabin’s Point, EP
• Rosa Larissa Park, EP
• Bold Point Park, PVD
• Field’s Point, PVD
• Gaspee Point, Warwick
RIDOH, Beach Report, 2015
ü Closures at Conimicut
Point and Barrington
Beach have decreased by
~45% since CSO tunnel• Feb 2009: DEM and FDA agree on new monitoring procedures to allow DEM
to re-open Conditional Areas A & B to shellfish harvesting as soon as the data
demonstrates it is safe to do.
§ Has resulted in ~ 36 days of early opening since 2009 due to good water
quality
• May 2011: Conditional Area A, closed after 0.8 inch of rainfall, up from 0.5
inch. Conditional Area B closed after 1.5 inches of rainfall, up from 1.0 inch
§ Area A: open ~ 65 more days/year;
§ Area B: open ~ 45 more days/year
§ Closure criteria remained at 0.5 inches rainfall at Conimicut Triangle
• May 2013: 462 acre area in Lower PR: rainfall closure criteria increased from
0.5 inches to 0.8 inches of rainfall received in the Providence area. Size of the
"Conimicut Triangle" will be reduced and the size of Conditional Area A will
increase
• May 2016: Lower portion of Providence River is showing promise and may be
reopened conditionally to shell fishing in future years, though shellfish
management plans must be developed
§ 2 most southern monitoring stations have shown results in compliance with
shellfishing standards in 3 of the past 4 years!• Nitrogen loadings to the Bay have steadily increased from the 1880s • Nitrogen loadings increased as population increased in watershed • Largest contributions from sewerage plants • Some WWTFS began to treat to reduce nitrogen in early 2000s • Dramatic nitrogen reductions by POTWs implemented in past few years
•   Optimize conditions for nitrification and denitrification
 •   NBC Permit limit (5 mg/L) in effect May – October
 •   Total NBC Upgrade Cost: $44 Million

             Field’s Point                                  Bucklin Point
• Integrated Fixed Film Activated Sludge        •   Initial upgrades to 8 mg/L
  (IFAS) – Largest in the world!                    completed in 2006
• 5 mg/L Permit limits in effect                •   5 mg/L limit in effect July 2014
  May 2014
Data includes 11 WWTFs: Burrilville Cranston East Greenwich East Providence NBC (Field’s Point & Bucklin Point) Smithfield Warren Warwick West Warwick Woonsocket
• Professor Nixon expressed his
 concern regarding the “Grand
 Experiment” to dramatically
 reduce nitrogen loadings to the
 Bay by 50%
• How will the nitrogen reductions
 ultimately impact primary and
 secondary productivity of the
 Bay?
• “Would Goldilocks say a 50%
 Nitrogen Reduction was just
 right????” (Oviatt)                   Professor Scott Nixon touring the
                                        NBC CSO Tunnel Pump Station
• Time will tell, but observed water           (Photo Veronica Berounsky)

 quality improvements look
 promising.
Compared to National Coastal Condition Assessment Guidelines
•   Based on 1865 – 1878
    “Hydrography”
•   Some Water Quality
    issues are Localized
•   Let’s look at the
    Historical Changes to
    Providence Harbor
• Map Clearly Shows:
ü Wetlands & Eel
Grass Beds
ü Oyster Beds
(5000 leased acres)
ü Seekonk River -
37’ deep
ü Prov River Channel
– dredged to 25’
depth• 1910 Coast Line in Red
• City plans to Fill Bay and
Build Roads
• Note:
ü Much Shallower River
ü Starved Goat Island
• What was flow circulation
pattern in 1910?1910 Coastline in Red
• We Filled the Bay &
Wetlands
• Built the Hurricane Barrier
• Built Pawtuxet River
Breakwall
• Allowed Rivers to Silt up
• Dredged Channel to 50+’• Edgewood Shoals area is DO impaired!!! WHY??? ü We Changed Flow Circulation Patterns ü Poor flushing ü Nitrogen enrichment ü Stratification
ROMS Model
    Indicates:                           GYRE
ü    Jet of water down the shipping
     channel
ü    Sets up a clockwise Gyre on
     Shoal
ü    Bottom waters from Pawtuxet
     River transport Nitrogen onto the
     shoal
Possible Sustainable
Solutions
• Lets take a Holistic Approach to
Watershed Management
• Can we Improve the Bay with
“Smart Engineering”?
ü Selective Dredging?
ü Redirect flows to improve
circulation?
ü Remove or open breakwalls to
improve circulation?
ü Create Islands, Wetland Habitats,
natural buffers?
ü Establish Bio-extraction or
Aquaculture Projects?• Wetlands & salt marsh restoration – remove
250 to 630 g N m-2 yr-1
• Bio-extraction –
ü Ribbed Mussels 1.2 % N
ü Algae…
• Relay aquaculture
ü Oysters - 0.52 g N/oyster
ü Quahogs -16.2 g N/kg meat
• Goals & Benefits:
ü Improved Fisheries - Shellfish & Benthic species
Restoration & Enhancement
ü Habitat Creation & Restoration
ü Create Green Jobs for the Future
ü Best WQ Improvement for the Buck
Photos courtesy of: http://www.jaxshells.org/gdim.htm,
http://viudeepbay.com/2012/02/12/design-and-construction-report-solar-flupsy-project/, algaebiodiesel.com,
Cape Cod Cooperative Extension•Began in 2011 - Attempt to
survey monthly
•Goal: note observable changes to
benthos
•Underwater camera towed on
custom sled
•Even the Upper Bay is Alive!!!
http://wnpr.org/post/rhode-islands-beluga-whale-mystery-continues
http://www.thenewportbuzz.com/humpback-whale-spotted-breaching-in-narragansett-bay/5867•Whales
http://wnpr.org/post/rhode-islands-beluga-whale-mystery-continues
http://www.thenewportbuzz.com/humpback-whale-spotted-breaching-in-narragansett-bay/5867•Dolphins WPRI.com
• Seals
• What are these Bay’s
 visitors feeding on???

             https://www.ecori.org/natural-resources/2016/4/6/record-number-of-seals-counted-in-narragansett-bay
üThe Bay is Alive and definitely NOT Sterile!!! üMan has Negatively Impacted the Bay over the past 350+ years üWater Quality is Improving significantly, at a rapid rate, but Clean Water is very costly üThe Bay is Changing and so are it’s inhabitants
Questions ???
        Special thank you to the NBC Science Team:
Sarah Flickinger, Eliza Moore, Christine Comeau, Karen Cortes,
  Jim Kelly, John Motta & Kim Kirwan for assistance with this
                 presentation and data analysis

NBC Data is available on our Snapshot of the Bay Website at
               http://snapshot.narrabay.com
You can also read