Instruction manual nv charts App - NV Chart Group GmbH Carlshöhe 75 24340 Eckernförde +49 4351 860990
←
→
Page content transcription
If your browser does not render page correctly, please read the page content below
Instruction manual
   nv charts App

              NV Chart Group GmbH
 Carlshöhe 75 24340 Eckernförde • +49 4351 860990
              •
               info@nvcharts.com

            © Copyright: NV Chart Group GmbH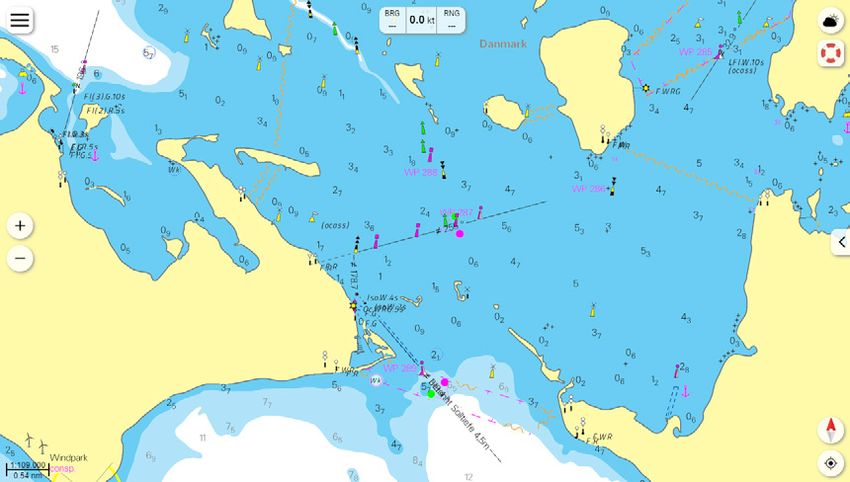
Table of contents

        List of abbreviations .........................................................................................................................04

        1. Introduction ..................................................................................................................................05

        2. Devices and operating systems ...................................................................................................05
               2.1 iOS Devices ...................................................................................................................05
               2.2 OS X Devices .................................................................................................................05
               2.3 Android Devices .............................................................................................................06
               2.4 Windows Devices ...........................................................................................................06

        3. Conditions and installation ...........................................................................................................06

        4. First use of the app ......................................................................................................................06
                 4.1 Sign in ............................................................................................................................06
                 4.2 Create account ...............................................................................................................07
nv charts

                 4.3 Create account later .......................................................................................................08
                 4.4 Home screen ..................................................................................................................08

        5. Overview of the features ..............................................................................................................09

        6. Chart interactions ........................................................................................................................09

        7. Weather .......................................................................................................................................09
              7.1 Tidal currents .................................................................................................................10
              7.2 Wind ..............................................................................................................................10
              7.3 Settings ..........................................................................................................................10

        8. Man overbord (MOB) ..................................................................................................................11

        9. Ship’s position and chart orientation ............................................................................................11

        10. Dashboard .................................................................................................................................12

        11. Routes .......................................................................................................................................12
               11.1 Display of route ...........................................................................................................12
               11.2 Create new route ..........................................................................................................12
               11.3 Edit route ......................................................................................................................13
        		              11.3.1 Editing menu .................................................................................................14
        		              11.3.2 Interaction with the route ...............................................................................14
               11.4 Check route ..................................................................................................................14
               11.5 Navigation along the route ............................................................................................15

                                                                                                                                           ®
        12. Marker .......................................................................................................................................15
              12.1 Display of marker .........................................................................................................15
              12.2 Create new marker .......................................................................................................16
              12.3 Edit marker ...................................................................................................................16
        		              12.3.1 Editing menu .................................................................................................16
        		              12.3.2 Interactions with the marker .........................................................................16
              12.4 Navigation to the marker ..............................................................................................17
              12.5 Add photographs ..........................................................................................................17
              12.6 Image gallery ...............................................................................................................17

        NV Chart Group GmbH                                                                                                               Bedienungsanleitung
        15.07.2019                                                                                                                              nv charts App   2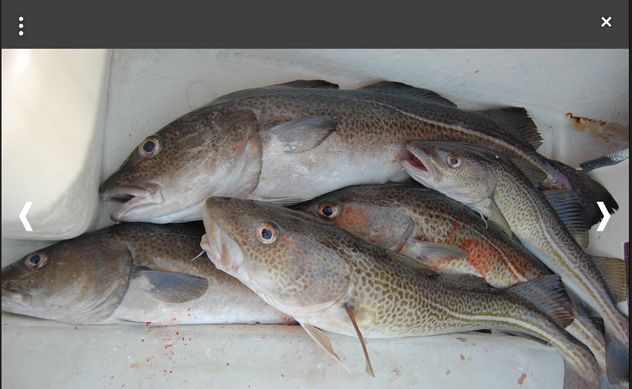
13. Ruler ..........................................................................................................................................18

        14. Anchor Alarm ..............................................................................................................................18

        15. Charts ........................................................................................................................................19
               15.1 Add charts ...................................................................................................................19
               15.2 Buy offline charts ..........................................................................................................19
        		               15.2.1 Digital subscription ........................................................................................20
        		               15.2.2 Paper and Digital ...........................................................................................20
               15.3 My charts .....................................................................................................................20
        		               15.3.1 Loading charts ...............................................................................................20
        		               15.3.2 Updating charts .............................................................................................21
               15.4 Chart settings ...............................................................................................................21

        16. Logbook .....................................................................................................................................21
               16.1 Create activity ..............................................................................................................22
               16.2 Add photographs ..........................................................................................................22
               16.3 Image gallery ...............................................................................................................22
nv charts

        17. On the location ...........................................................................................................................23
               17.1 Report information .......................................................................................................23
               17.2 Highlighted lighthouse display ......................................................................................23
               17.3 Tidal information ...........................................................................................................23
               17.4 Navigation to the location .............................................................................................24

        18. Settings ......................................................................................................................................24
                18.1 Sail mode and App ......................................................................................................24
                18.2 Chart settings ..............................................................................................................25
                18.3 GPS/AIS ......................................................................................................................27
                18.4 Weather .......................................................................................................................28
                18.5 Privacy .........................................................................................................................28

        19. Feedback ...................................................................................................................................28

        20. Help ...........................................................................................................................................29

        21. About .........................................................................................................................................29

        22. User profile ................................................................................................................................29
               22.1 With user account ........................................................................................................29
               22.2 Without user account ...................................................................................................29

                                                                                                                                             ®

        NV Chart Group GmbH                                                                                                                 Bedienungsanleitung
        15.07.2019                                                                                                                                nv charts App   3
List of abbreviations

        AIS                   Automatic Identification System

        AIVDO                 AIS broadcast format

        BRG                   Bearing

        BSH                   Bundesamts für Seeschifffahrt und Hydrographie

        COG                   Course Over Ground

        CPA                   Closest Point of Approach

        ETA                   Estimated time of arrival

        GPS                   Global Positioning System
nv charts

        kt                    Knots

        LAT                   Latitude

        LON                   Longitude

        MOB                   Man Over Bord

        nm                    Nautical Miles

        NMEA                  National Marine Electronics Association

        RNG                   Range

        SOG                   Speed Over Ground

        WLAN / WiFi           Wireless Local Area Network

        WP                    Waypoint

        XTE                   Cross Track Error

                                                                               ®

        NV Chart Group GmbH                                                    Bedienungsanleitung
        15.07.2019                                                                   nv charts App   4
1. Introduction
        Dear NV customers,

        this user manual is intended to give you a simple introduction to our new nv charts app and can be
        used both as a manual and as a reference book for to answer any questions that may arise.

        All charts of the NV Verlag / nv charts can be downloaded in the nv charts app and used for offline
        navigation. The charts are available as a combination pack of paper and digital charts either in the
        NV Onlineshop or at various nautical chart dealers. In addition, they can be purchased in purely
        digital form directly via the nv charts app. The nv charts app is therefore the ideal software for navi-
        gation with the popular NV nautical charts. A clearly structured nautical app with intuitive operation
        and extensive tools for dynamic navigation, it is ideal for all activities on the water.

        It is part of the concept of the nv charts app to constantly improve and further develop itself. Exis-
        ting functions are continuously updated and new features are added for an even better use is
        made available. One of the many new features from now on, for example, is the use of the app
        without the need for maps. must be purchased in advance or demo cards must be downloaded in
nv charts

        the app.

        2. Devices and operating systems
        The nv charts app is available for mobile devices as well as for desktop PCs or laptops. The use of
        GPS is recommended for optimal use. The following operating systems and versions for using the
        nv charts app are supported:

        2.1 iOS Devices                                        2.2 OS X Devices

        from iOS 12                                            from Mojave 10.14

        • iPhone 6 und iPhone 6 Plus                           • MacBook ab Anfang 2015
          (nicht Vektorkarten geeignet)                        • MacBook Pro ab Mitte 2012
        • iPhone 6s und iPhone 6s Plus                         • MacBook Air ab Mitte 2012
          (nicht Vektorkarten geeignet)
        • iPhone 7 und iPhone 7 Plus                           • Mac Mini ab Ende 2012
        • iPhone 8 und iPhone 8 Plus
        • iPhone X                                             • iMac ab Ende 2012
        • iPhone XS und iPhone XS Max                          • iMac Pro ab 2017
        • iPhone XR
                                                               • Mac Pro ab Ende 2013
        • iPad Air (nicht Vektorkarten geeignet)
        • iPad Air 2

                                                                                                    ®
        • iPad (2017 & 2018)
        • iPad Mini 2
        • iPad Mini 3
        • iPad Mini 4
        • iPad Pro (1. Generation)
        • iPad Pro (2. Generation)
        • iPad Pro (3. Generation)

        NV Chart Group GmbH                                                                         Bedienungsanleitung
        15.07.2019                                                                                        nv charts App   5
2.3 Android Devices                                         2.4 Windows Devices

        General system requirement:                                 General system requirement:
        • Android 7.0 or higher                                     • Windows 7 or higher
        • 4 GB RAM (DDR4)                                           • 64 bit version
        • 500 MB disk space                                         • 4 GB RAM (DDR4)
                                                                    • 500 MB disk space

        3. Conditions and installation

        In order to use the nv charts app, you must first install it on the devices you want to use (maximum
        five). Make sure in advance that the app is compatible with your devices (see 2. Devices and ope-
        rating systems).

        Installation steps
nv charts

                   1. Click on the following link or type the following lines directly into the address bar of your
                      browser: http://www.nvcharts.com/app/eu

                   2. Click on „Get this app“.

                   3. Select from the four options the operating system of your device and click on the
                      corresponding button.

                   4. iOS: Click on „Load“.

                      Android: Click on „Install“.

                      Windows: Click on „Save file“ and open the saved file with a double click.
        		                     Then follow the displayed instructions.

                      OS X: Follow the instructions shown.

        Once you have completed the installation, you can click the app icon (double-click on the compu-
        ter) to open the app and start it.

        4. First use of the app
        4.1 Sign in

        If you already have an nv charts app account, click on the „Login“ button (see Fig.1).
        Then enter your e-mail address and password in the fields provided and tick the box when you
        have read and accepted the Terms of Use and Privacy Policy.

                   Only if you have read both the Terms of Use and the Privacy Statement you can use the
                                                                                                         ®
                   nv charts app.

        Then click on the „Login“ button and you can start using the app.

        NV Chart Group GmbH                                                                             Bedienungsanleitung
        15.07.2019                                                                                            nv charts App   6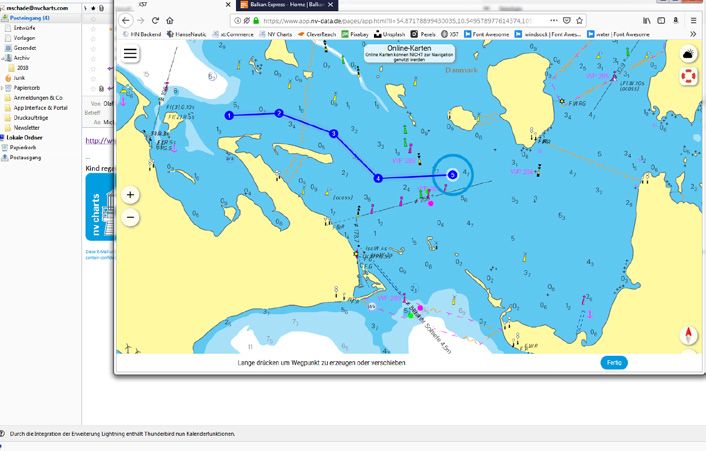
If you have forgotten your password, click on „Reset Password“ below the login button and you will
        be taken to a new page. Here you‘ill have to enter your e-mail address again and request a new
        password by clicking on the „Request“ button. You will then receive an e-mail with instructions on
        how to proceed to the e-mail address you entered previously.
                                                                        Fig.1
                                                                        Sign in with existing account
nv charts

        4.2 Create account

        If you do not yet have an nv charts App account, you can click on the button „Create account“, to
        create a new account. Then enter in the fields provided your e-mail address and choose a pass-
        word, which will have to be repeated once again. Check the box when you have read and accepted
        the Terms of Use and Privacy Policy (see Fig.2) and click on the button „Create account“.

                   Only if you have read both the Terms of Use and the Privacy Statement you can use the
                   nv charts app.

        You can now start using the app. At the same time, you will receive an e-mail with a confirmation
        link to the e-mail address you entered previously. Please confirm this link within seven days in
        order to continue to use the app to the full extent.
                                                                        Fig.2
                                                                        Accepting Terms of Use and Privacy Policy

                                                                                                              ®

        NV Chart Group GmbH                                                                                  Bedienungsanleitung
        15.07.2019                                                                                                 nv charts App   7
4.3 Create account later

        Click on the „Create account later“ button if you wish to use the nv charts app without an account
        for the time being.

                   If you use the „Create account later“ button to access the nv charts app, you can only
                   use it to a limited extent. For example, navigation along a route or the in-app purchase of
                   charts is not possible.

        After clicking on the button you can start using the app.

        If you are already in the app and now want to create an account, you can do so via the main menu
        and the „User profile“ tab at the bottom of the menu. Please read on under 22.2 Without user ac-
        count.

                                                  Fig.3
nv charts

                                                  Entering informations about your boat

        4.4 Home screen

        The following figure shows the home screen of the nv charts app and describes which functions
        can be found.

                                                                                                                   Fig.4
                                                                                                                   Home screen
                     main menu                                                              weather features       in navigation
                                                                                                                   mode
                                                                                               set MOB mark

                                 navigationinfo

                     zoom in/out                                                                 dashboard

                                                                                                                 ®
                                                                                          orientation north-up
                   present scale of chart
                                                                                  move to current position

        NV Chart Group GmbH                                                                                      Bedienungsanleitung
        15.07.2019                                                                                                     nv charts App   8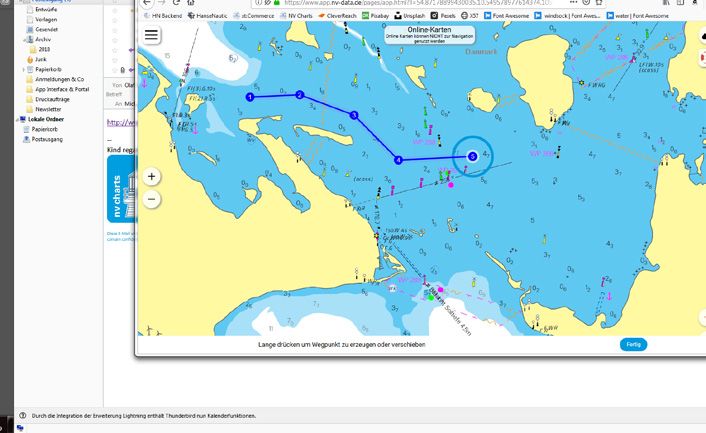
5. Overview of the features
        The main functions of the app are listed below. You will find a more detailed explanation of the indi-
        vidual functions in the further course of this operating manual. Please refer to the table of contents
        to find out exactly where you can find the corresponding explanations.

        • Plan your route                                     • Expert mode with extended displays
        • Check your route                                    • Tidal current display in real time
        • Navigation along a route                            • Wind display in real time
        • Input of waypoints with coordinates
                                                              • Man overboard function
        • Create marker                                       • Highlighted lighthouse display
        • Navigation to a marker
                                                              • Tidal curve
        • Ruler
                                                              • Information on each chart location
        • Anchor alarm (also in standby mode)
                                                              • Vector charts
nv charts

        • In-App purchase of charts
        • Management of purchased charts                      • Chart adaptation to the ship‘s draught
                                                                and height
        • Track recording with logbook entry
        • Manual logbook entry                                • Error report & feedback function

        6. Chart interactions

            Aktion                       Mobile device                        Desktop-PC/Laptop
                                         • Single tap on the chart
            Close menu                                                        • Single click on the chart
                                         • Swipe the menu to the left
                                         • Drag the chart with two fingers • Turn the mouse wheel up
            Zoom into the chart
                                         • Double tap on the chart         • Double click on the chart
            Zoom out of the chart        • Pull the chart with two fingers    • Turn the mouse wheel down
                                         • Long tap on the chart              • Press and hold on the chart
            Open informations
                                         • Long tap on an object in the       • Press and hold on an object
            „On position“
                                           chart                                in the chart
                                         • Tap, hold and move in the          • Press, hold and move in the
            Move in the chart
                                           chart                                chart
                                         • Long tap on the chart and          • Press and hold on the chart
            Fast creation of a route/
                                           selecting the appropriate            and selecting the appropriate
            marker/ruler
                                           function                             function
        Tab.1
        Chart interactions
                                                                                                     ®
        7. Weather

        To open the weather menu, click on the weather icon in the upper right corner        .
        To use the weather function, you will need a constant internet connection.

        NV Chart Group GmbH                                                                         Bedienungsanleitung
        15.07.2019                                                                                        nv charts App   9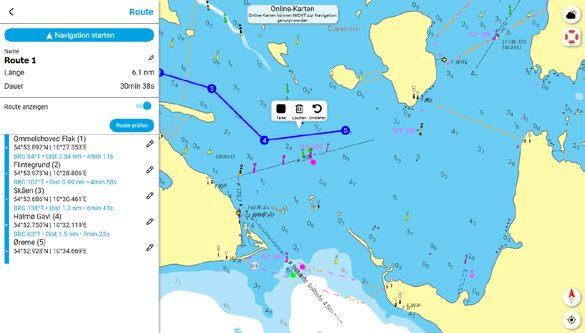
7.1 Tidal currents

        By clicking on the flow symbol     the current flows in the area of the selected chart section are di-
        splayed. The arrows describe the current direction, the colour of the water and the displayed knots
        determine the current intensity.
        You can also read the strength of the current in the scale on the left side of the screen.

        7.2 Wind

        Click on the wind symbol        to display the current wind data in the area of the selected map
        section. The arrows indicate the direction in which the wind blows, the colour of the water and the
        marks on the arrows determine the wind strength. You can also read the strength of the wind in the
        scale on the left side of the screen.
        gepasst und entsprechend geändert.

            Bft        Kn       m/sec     Bft        Kn        m/sec     Bft          Kn      m/sec
             0         64      > 32,7
             3     7 - 10     3,4 - 5,4   8     34 - 40   17,2 - 20,7   Tab.2
                                                                        Wind speed
             4    11 - 15     5,5 - 7,9   9     41 - 47   20,8 - 24,4

        7.3 Settings

        Using the menu at the top of the screen, you can select the exact day and time for the current/wind
        display. To do this, click on the arrow keys to the right and left of the current date display to jump
        back and forth step by step.
        Alternatively, select the desired date directly from the list, which opens by clicking on the pop-up
        menu (see Fig.5).

                                                                               Fig.5
                                                                               Wind presentation
                                                                               Opening the date list

                                                                                                       ®
        By clicking on the play symbol you can display currents and wind interactively and in real time.
        The interactive view can be ended by clicking on the stop symbol .

        A click on the gearwheel    symbol opens an extended menu on the left side of the screen for both
        the current and the wind display.
        Under „Area“ you can define in which area the current and wind data should be displayed. Let the
        settings „Load automatically“ so that the data is always displayed on the currently selected map
        section.

        NV Chart Group GmbH                                                                            Bedienungsanleitung
        15.07.2019                                                                                           nv charts App   10
If the slider „Update automatically“ is active, the data will be continuously adjusted. and amended
accordingly.
We recommend that you only set this function to inactive if you want to save power on the
device or if your device is experiencing display problems.
If the slider is active with „Show colors“, the water is colored according to the intensity when the
current / wind display is activated. Set this slider to inactive to display only the knot information on
the map.
Fig.6
Menu wind / tidal currents
„Show colors“ deactivated
nv charts
8. Man overbord (MOB)
If a person has gone overboard, you can use the MOB symbol in the upper right corner of the
home screen. At your current ship position a MOB marker appears automatically, which is also
displayed to other users of the nv charts App so that they can help quickly if necessary.
In addition, the navigation to the MOB mark is started. If you are navigating to another position on
the map, this navigation is automatically stopped.
If you have set the MOB mark unintentionally or if the person to be rescued is again to safety, you
can delete the marker by pressing the button „Stop navigation“ and confirm the following question
with „Yes“ (see Fig.7).
Fig.7
Stopping the MOB route
®
9. Ship’s position and chart orientation
Click on the compass needle to align the map to the north. Click on the location symbol below
the compass needle to jump directly to your ship‘s position on the map.
NV Chart Group GmbH Bedienungsanleitung
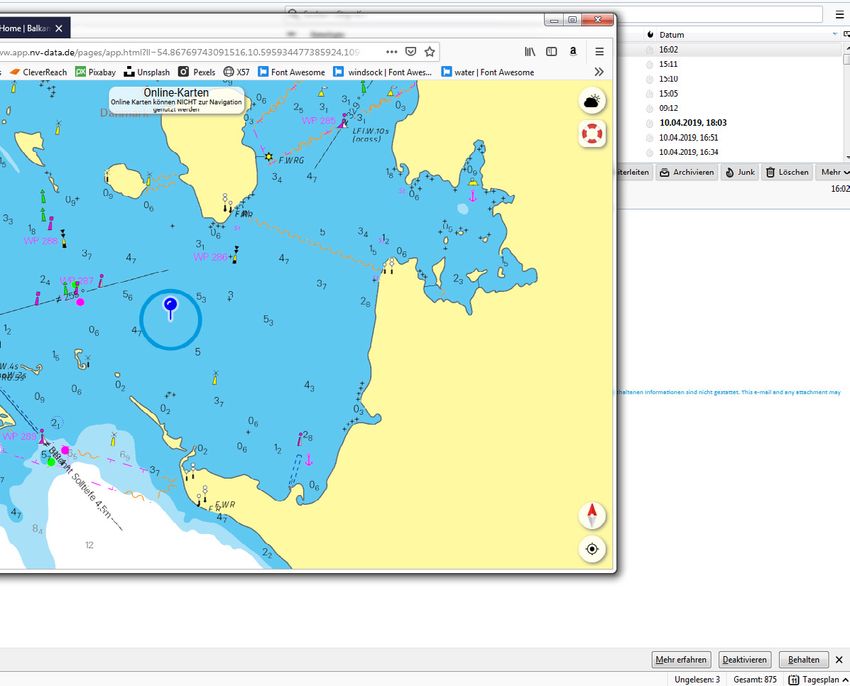
15.07.2019 nv charts App 1110. Dashboard
Use the arrow on the right side of the screen to expand or collapse the information panel. It pro-
vides you with various information such as your ship`s position or the current wind conditions and
also displays a list of existing AIS targets.
If you have activated the expert mode in the settings (see 18.1 Sail mode and App), a bar with the
current XTE will also be displayed.
Fig.8 Fig.9
Open dashboard Close dashboard
nv charts
11. Routes
11.1 Display of route
Click on the „Route“ tab in the main menu to get to your route view. At this point you will see a list
of all the routes you have already created. The green bar at the bottom of the route view allows
you to create a new route. (see 11.2 Create new route).
Click on the visibility symbol in front of the respective route to hide it on the chart. The cor-
responding route will then be grayed out in the list and the eye symbol will be crossed out (see
Fig.10). Another click on the now crossed out symbol shows the route on the chart again.
Click directly on one of the listed routes to jump to it on the chart and open the Edit menu at the
same time (see 11.3 Edit route).
Fig.10
Route list
®
11.2 Create new route
Click on the green bar with the plus icon at the bottom of the route view to create a new route. The
route view will close and you will be taken to the chart.
NV Chart Group GmbH Bedienungsanleitung
15.07.2019 nv charts App 12To set the first waypoint, click on the place you want to set on the chart and hold the click for about
two seconds. A blue bar will appear, which shows you how long you have to hold until the waypoint
is created (see Fig.11). You can place the next waypoints in the same way and you can also set a
waypoint between two already created points by pressing for about two seconds to press the corre-
sponding route section. If you are satisfied with your route, click the „Done“ button at the bottom of
your screen.
Fig.11
Press and hold to create new waypoint
nv charts
Another way to create a route is the long press on the chart. A small menu will open in the appro-
priate place and you can select to create a new route or a new marker (see Fig.12).
Fig.12
Press and hold to create route or marker
11.3 Edit route
To edit your route, either select it from the route view or click on the corresponding route directly on
the chart (see Fig.13). In both cases, an editing menu opens on the left edge of the screen as well
as three editing buttons directly on the route. In the upright view of mobile phones, the menu opens
at the bottom of the screen and can be opened in full screen by clicking on the menu icon .
Fig.13
Open the editing menu of a route
®
NV Chart Group GmbH Bedienungsanleitung
15.07.2019 nv charts App 1311.3.1 Editing menu
In the editing menu you can start the navigation along the route (see 11.5 Navigation along the
route), change the name of the route - click on the editing icon next to the name - and you‘ll get
the length of the route as well as the duration from the first to the last waypoint displayed.
The duration displayed in the edit view is calculated using the speed information you have
entered in the settings for your ship (see 18.1 Sail mode and App). The duration may vary
depending on your actual speed. Once you have started navigation, the duration is contin-
uously recalculated and adjusted (see 11.5 Navigation along the route).
You can also use a slider to specify whether the route should be displayed on the map or not, and
you can check your route for obstacles/hazards (see 11.4 Check route).
At the end of the edit view you will see all created waypoints and the distance between each
waypoint. At this point you have the opportunity to adjust the position of the waypoints again. To do
nv charts
this, click on the edit icon next to the respective waypoint and enter the corresponding position
data.
11.3.2 Interaction with the route
The three buttons on the route allow you to change the colour of the route , reverse the direction
or delete the route .
To add more waypoints to your route, you have two options:
If you would like to add one or more new points at the end, click on the last waypoint of your route
•
and then on the „Append“ button . You can now add further points as described in 11.2 Create
new route and confirm your changes with „Done“.
If you want to create a waypoint between two existing points, click on the corresponding route
section and hold the click for about one second. A blue bar will appear showing you how long you
need to hold until the waypoint is created (see Fig.11).
If you want to move one of the set waypoints to another location, click on the corresponding point
and hold the click again for about one second.
To remove a waypoint, just click briefly on the point and then on the „Delete“ button .
11.4 Check route (only possible with vector charts)
The „Check route“ button allows you to check your route for obstacles and/or traffic bans using the
draft and maximum ship height specified in the settings (see 18.1 Sail mode and App). To do this,
click on the button once. If your route leads through a corresponding area, the obstacle is indicated
by a red mark at the respective route section as well as between the affected waypoints.
®
Depending on the length/position of the route, the check process may take a few seconds.
If you have adjusted or changed your route again afterwards, you need to click on the „Check rou-
te“ button again for a new check.
NV Chart Group GmbH Bedienungsanleitung
15.07.2019 nv charts App 14Fig.14
Presentation of a checked route
11.5 Navigation along the route
By clicking on the „Start navigation“ button, you start the navigation along the route. The editing
menu closes and a bar appears at the bottom of your device showing the remaining distance and
time until the route is completed.
nv charts
The bar at the top of your device will show you - in addition to the permanently displayed speed -
the direction and distance to the next waypoint.
You‘ll also see a dashed line from your boat to the first waypoint on your route.
To stop the navigation again, click on the button „Stop navigation“ below.
Fig.15
Started navigation to the first waypoint
12. Marker
Setting markers allows you to personally mark specific locations on the chart. In this way, you can
identify for example special anchorages or very good fishing posts and find them quickly and easily
on the chart.
12.1 Display of marker
Click on the „Marking“ tab in the main menu to go to your marking view. At this point you will see
a list of all the markers you have already created. The green bar at the bottom of the marker view
allows you to create a new marker (see 12.2 Create new marker).
Click on the visibility symbol in front of the respective marker to hide it on the chart (see Fig.16).
®
The corresponding marker in the list will then be grayed out and the visibility symbol will be cros-
sed out. Another click on the now crossed out symbol will show the marker on the chart again.
Click directly on one of the listed markers to jump to the respective marker on the chart and simul-
taneously open the editing menu for this marker (see 12.3 Edit marker).
Fig.16
Marker list
NV Chart Group GmbH Bedienungsanleitung
15.07.2019 nv charts App 1512.2 Create new marker
Click on the green bar with the plus symbol at the bottom of the marker view to create a new mar-
ker. The Marker View will close and you will be taken to the chart.
To set a marker, click on the desired position on the chart and hold the click for about one second.
A blue bar will appear indicating how much longer you need to hold before the marker is created.
Another way to create a marker is the long press on the chart. A small menu will open in the appro-
priate place and you can select to create a new route or a new marker (see Fig.12).
Fig.17
Press and hold to set marker
12.3 Edit marker
nv charts
To edit your marker, either select it from the marker view or click on the corresponding marker
directly in the map. In both cases, an editing menu opens on the left edge of the screen as well as
two editing buttons directly on the marker. In the upright view of mobile phones, the menu opens at
the bottom of the screen and can be opened in full screen by clicking on the menu icon .
Abb.18
Bearbeitungsmenüs einer Markierung öffnen
12.3.1 Editing menu
In the editing menu you can start a navigation to the marker (see 12.4 Navigation to the marker),
change the name and the exact position of the marker - click on the editing icon - and you can
use sliders to determine whether the marker should be displayed on the map or not.
You also have the option of adding images to your marker (see 12.5 Add photographs).
12.3.2 Interactions with the marker ®
If you want to move a set marker to another location, click on the corresponding marker and hold
the click again for about one second.
To remove a marker, just click briefly on the marker and then on the „Delete“ button .
NV Chart Group GmbH Bedienungsanleitung
15.07.2019 nv charts App 1612.4 Navigation to the marker
By clicking on the „Start Navigation“ button, you start navigating to the selected marker. The editing
menu closes and an automatically generated route to the marker is displayed. In addition, a bar
appears at the bottom of your device showing the remaining distance and duration until the route is
completed.
If you have activated the expert mode in the settings (see 18.1 Sail mode and App), the bar at the
top of your device will show you - in addition to the permanently displayed speed - the direction
and distance to the next waypoint.
To stop the navigation again, click on the button „Stop navigation“ at the bottom.
12.5 Add photographs
If you want to add a photo to your marker, click on „More“ and then on the camera icon located
at the bottom of the editing menu. You will then be given the option of either taking a new photo or
selecting an image directly from the gallery of your device.
nv charts
If you have selected a photo, it will appear at the bottom of the edit menu. If you add more pictures,
they will be placed underneath.
The icon of your marker receives a camera icon as soon as you add a picture to it.
12.6 Image gallery
If you have added at least one photo to your selection, it will be displayed as a preview at the
bottom of the editing menu. Click on this thumbnail to enter the image gallery (see Fig.19). At this
point the already added pictures are displayed in large size and you can move through the gallery
by swiping to the right or left (only on mobile devices) or by clicking on the arrows on the right and
left edges of the picture.
Via the menu in the upper left corner of the picture gallery you can define the displayed photo as
a preview picture. The corresponding image will then be displayed in the editing menu of the mar-
ker and if you have activated the public display of the marker, the respective photo will be display-
ed first when another app user clicks on your marker. The menu also allows you to split, delete or
add more images to the currently displayed image.
Click on the cross in the upper right corner to close the image gallery and return to the editing
menu of the selection.
Fig.19
Open menu in image gallery
®
NV Chart Group GmbH Bedienungsanleitung
15.07.2019 nv charts App 1713. Ruler
To use the ruler, click on the chart for about one second. This will open a small menu and you can
choose whether you want to create a new marker, a route or a bearing at this place (see Fig.11).
If you have selected the ruler using the mentioned menu, a bearing with start and end point will ap-
pear on the chart. Above the bearing is the direction, below the length and the travel time display-
ed. Two dashed lines help you align in the chart.
By holding and moving the start or the end point of the bearing, you can adjust the position and
length.
If you would like to delete the bearing, click on the delete button at the bottom of your device (see
Fig.23). If the delete button is not displayed, you have to select the bearing by clicking first.
Fig.20
Delete selected ruler
nv charts
14. Anchor Alarm
Click on the „Anchor alarm“ tab in the main menu to open the corresponding editing menu. The
menu allows you to activate an alarm and show or hide it on the chart. You will automatically be
taken to your current location and an alarm circle will appear with your location as the center (see
Fig.21). A slider allows you to activate the alarm. If it is active, the alarm is permanently displayed
on the map. If the alarm is deactivated again, the circle disappears on the chart.
By clicking on the button „Set on location“ you jump directly to your location on the chart and the
anchor alarm is displayed with the ship as the center.
You can set the radius of the alarm in two ways: Either enter the size of the radius manually in the
upper left corner of the editing menu or hold down the orange circle for about one second and then
drag the circle to the right or left to increase it or make it smaller (see Fig.21).
®
You can move the alarm by holding down the blue circle in the middle of the alarm for about one
second. If you are not able to click on the blue circle because your ship is exactly above it, please
zoom further into the chart.
Fig.21
Press and drag to set the radius of the alarm
NV Chart Group GmbH Bedienungsanleitung
15.07.2019 nv charts App 1815. Charts
Use the slider to select if you want to see online maps. The use of online charts requires an inter-
net connection.
If this function is active, you will always be shown all chart areas in the app, but you can not navi-
gate with these charts. If you start a navigation, the app automatically switches to the offline charts,
if you‘ve already purchased nautical charts for the respective area. Otherwise, you will get a mes-
sage that navigation with online charts is not possible.
If the function is not active, only the already acquired charts will be displayed and all other areas
will be displayed as a gray area.
15.1 Add charts
By clicking on the tab „Add charts with product-id“ you will be taken to a new view where you can
enter the 16-digit product ID of your chart and activate it this way.
Once you have entered the code in the the appropriate field, click on „Activate“. If the entry is
nv charts
incorrect, a corresponding message will appear and you can enter the product ID again. If the entry
is correct, the corresponding chart will be displayed as an image and you can activate it by cli-
cking on the „Install“ button. You will automatically be taken to the chart management (see 15.3 My
charts) afterwards.
Fig.22
Add chart (the shown product ID is just an example)
15.2 Buy offline charts
The „Buy offline charts“ tab takes you to a selection page where you can choose between a digital
subscription or paper and digital charts.
With the digital subscription, you receive the charts for one year, in purely digital form,
directly in the nv charts app. The subscription is automatically renewed, but can also be
cancelled at any time. Choose Paper & Digital if you want to purchase the cards as a
®
combination pack of paper and digital charts directly in the NV Onlineshop.
NV Chart Group GmbH Bedienungsanleitung
15.07.2019 nv charts App 1915.2.1 Digital subscription
If you have clicked on the field „Digital subscription“, you will be shown all available nautical charts
as frames on the map (not in the upright view for mobile phones) and in a list view.
You can select the charts either by clicking on the corresponding frame or directly in the list. Only
one chart can be selected at a time. If you want to change your selection, either click on another
frame or go back using the arrow at the top left and select another chart from the list.
Once you have selected a chart, it will be displayed with a picture and a short info text. You can
buy the chart by clicking on the „Subscribe“ button, which also lists the price of the respective
chart. This opens a system-specific window on which you have to confirm the purchase again.
15.2.2 Paper and Digital
If you have clicked on the field „Paper & Digital“, you will be shown all available nautical charts as
frames on the map (not in the upright view for mobile phones) and in a list view.
nv charts
You can select the charts either by clicking on the corresponding frame or directly in the list. Once
you have selected a chart, your browser opens and you are automatically taken to the correspon-
ding product in the nv online shop.
15.3 My charts
In the chart manager, all the charts you have already added are displayed in a list. The list is orde-
red according to the alphabet, whereby charts for which an update exists are always at the top and
already loaded maps are displayed in front of non-loaded maps.
If there is a new chart edition, there is a link in orange under the corresponding chart. Click on this
link to go directly to the respective chart in the nv online shop.
15.3.1 Loading charts
To display an added chart in the app, you have to download it. You can do this by clicking on the
download arrow on the right side of the chart. Under the arrow you will always see the file size
and thus the required storage space of the chart to be loaded.
If you have started the download by clicking on the arrow, the text under the symbol changes to
„Loading...“ and the progress of the download is shown in percent (see Fig.23).
When the chart is completely loaded, the arrow turns blue and points upwards . In addition, the
loaded chart jumps up in the list so that all already loaded charts are always displayed at the top.
Another click on the now blue arrow releases the memory space that the loaded chart occupies on
your device.
®
The chart will not be deleted or removed from the list, it just jumps down and has to be
reloaded if it wants to be used in the app again.
NV Chart Group GmbH Bedienungsanleitung
15.07.2019 nv charts App 20Fig.23
Display of the chart management and
loading of series 1
15.3.2 Updating charts
Charts with an update available are always displayed at the top of the list. The arrow on the right
side of the corresponding chart is colored green and points to the right . By clicking on this up-
nv charts
date arrow you can update the respective chart. How much memory space the update requires is
always shown below the arrow.
15.4 Chart settings
Please see 18.2 Chart settings.
16. Logbook
By clicking on the tab in the main menu, you will reach the logbook. If you have activated the acti-
vity recording in the settings (see 18.1 Sail mode and App), your routes will automatically be saved
as an activitie and displayed in this menu as a list.
Click on the listed entries to go directly to the respective activity. Here you have the possibility to
change the name of the activity, delete the activity , show it on the chart or add + or delete
further waypoints. In addition, you can add photos to your activity (see 16.2 Add photographs).
Fig.24
Activity display
®
NV Chart Group GmbH Bedienungsanleitung
15.07.2019 nv charts App 2116.1 Create activity
Click on „Start activity“ at the bottom of the logbook view. The current date and time are automa-
tically created as the start of the new activity and you will be taken from the logbook view to the
single view of the activity.
Finish the activity by clicking „Activity end“ below. The current time is created as the end point of
the activity and as described above, you can use the plus icon + to add more waypoints between
the start and end points.
16.2 Add photographs
If you want to add a photo to your activity, click on „More“ and then on the camera icon located
at the bottom of the editing menu. You will then be given the option of either taking a new photo or
selecting an image directly from the gallery of your device.
If you have selected a photo, it will appear at the bottom of the edit menu. If you add more pictures,
they will be placed underneath.
nv charts
16.3 Image gallery
If you have added at least one photo to your selection, it will be displayed as a preview at the
bottom of the editing menu. Click on this thumbnail to enter the image gallery (see Fig.25). At this
point the already added pictures are displayed in large size and you can move through the gallery
by swiping to the right or left (only on mobile devices) or by clicking on the arrows on the right and
left edges of the picture.
Via the menu in the upper left corner of the picture gallery you can define the displayed photo as
a preview picture. The corresponding image will then be displayed in the editing menu of the mar-
ker and if you have activated the public display of the marker, the respective photo will be display-
ed first when another app user clicks on your marker. The menu also allows you to split, delete or
add more images to the currently displayed image.
Click on the cross in the upper right corner to close the image gallery and return to the editing
menu of the selection.
Fig.25
Open manu in the image gallery
®
NV Chart Group GmbH Bedienungsanleitung
15.07.2019 nv charts App 2217. On the location
You can select any position, every beacon and all buoys in the chart by press and hold on the ob-
ject. to obtain information about these places. In addition to the option to create a marker or a route
(see Fig.12), an info window opens on the left edge of the screen (in the upright view of mobile
phones, the menu opens at the bottom of the screen and can be opened in full screen by clicking
on the menu icon ) and you can view the various information by clicking on the appropriate
headings.
The selected location is indicated by a blue flashing circle graphic in the map. A single click on the
chart closes the info window again and the circle disappears.
Furthermore, you can select different objects in the map with a single click to open information to
the corresponding places. The following objects are clickable:
Important information about the chart area
Port information
nv charts
Photos and information about the location
17.1 Report information
If you have discovered an error in the listed data, you can report this error to us.
To do so, open the info window as described above and click on the „Report something about this
chart“ button at the bottom of the window. This takes you to a new page with a large input field in
which you can enter your error description. Describe the error as accurately as possible.
When you are finished and satisfied with your details, click the „Send“ button and you will receive a
copy of your message via e-mail.
Once w‘ve received your message, we will take care of correcting the error as soon as possible.
17.2 Highlighted lighthouse display
Click on a lighthouse on the chart for about a second to not only open the info window, but also to
visually display the individual sectors on the map. The identifiers of the individual sectors are also
recognizable in this way.
The visual presentation is closed as soon as you select another position or another location on the
chart by press and hold.
17.3 Tidal information
If tidal information is available for certain locations on the chart, you will be shown a rhombus at
the appropriate position on the nautical chart. If you zoom into the chart, these rhombi will be filled
®
at a certain point according to the tides.
Is the upper part of the rhombus colored, the tide is in, is the lower part of the rhombus
colored, the tide is out.
By clicking on the rhombus, a tidal curve opens at the upper edge of your device. You can close
the graphic by single clicking on the chart.
NV Chart Group GmbH Bedienungsanleitung
15.07.2019 nv charts App 23Fig.26
Tidal curve with Tönnings as example
nv charts
17.4 Navigation to the location
By clicking on the „Start navigation“ button, you begin navigating to the selected location. The
editing menu closes and an automatically generated route to the location is displayed. In addition,
a bar appears at the bottom of your device showing the remaining distance and duration until the
route is completed.
If you have activated the expert mode in the settings (see 18.1 Sail mode and App), the bar at the
top of your device will show you - in addition to the permanently displayed speed - the direction
and distance to the next waypoint.
To stop the navigation again, click on the button „Stop navigation“ at the bottom.
18. Settings
18.1 Sail mode and App
Record activity
Use the slider to select whether you want your route to be recorded automatically. If this function is
active, your routes will always be saved as an activity in the logbook.
Nightmode
Use the slider to select whether night mode should be activated or not. If this is active, mainly dark
colors are used in the app, so that you will not be dazzled by the screen of your device in the dark.
®
Boat name
Enter the name of your ship here. This name will also be displayed to other users of the nv charts
app.
Boat speed
Enter the speed of your ship here. The entered speed is used to calculate the duration of a route that
is displayed in the editing menu before the navigation along this route is started (see 11.3 Edit route).
Boat draft
Enter the draft of your ship here. Based on the entered value, shallows are detected when che-
cking a route (see 11.4 Check route) and displayed as an obstacle/hazard area.
NV Chart Group GmbH Bedienungsanleitung
15.07.2019 nv charts App 24Boat airdraft
Enter the maximum air draft of your ship here. Based on the entered value, height obstacles are
detected when checking a route (see 11.4 Check route) and displayed as a danger point.
App settings
Expert mode
Use the slider to select whether expert mode is to be activated. The following table shows the diffe-
rences between the normal mode and the expert mode as a graphical comparison:
Normaler Modus Expertenmodus
nv charts
Dashboard Dashboard XTE
Route display Route display with XTE
Tab.3
Comparison of normal mode and expert mode
Language
Select via a drop-down menu whether you want to use the app in German, English or French.
Units
®
Units speeds
Use a drop-down menu to select the unit in which speeds are to be displayed.
Units soundings (vector)
Use a drop-down menu to select the unit in which the depths are to be displayed on your vector
charts.
NV Chart Group GmbH Bedienungsanleitung
15.07.2019 nv charts App 25Units distances
Use a drop-down menu to select the unit in which distances are to be displayed.
Coordinates
Use a drop-down menu to select the unit in which coordinates are to be displayed.
Trackline
Heading line
Use a drop-down menu to select how far you want the forecast line of your course to be displayed.
Show tracks for
Use a drop-down menu to select how long the route you have travelled should be displayed on the
chart.
Time interval
Use a drop-down menu to select the time interval at which the points for your course line are to be
set.
nv charts
Distance interval
Use a drop-down menu to select the spatial distance at which the points for your course line are to
be set.
New track after
Use a drop-down menu to select the distance after which a new course recording is to be started.
Max. XTE (Cross Track Error)
Use a drop-down menu to select the maximum course deviation above which you want to be war-
ned by a note.
18.2 Chart settings
Show vector charts
Use the slider to select whether you want to show vector charts or not.
Chartframes raster
Use the slider to select whether you want to show the raster chart frames or not.
Chartframes vector
Use the slider to select whether you want to fade in the frames of the vector charts.
On click navinfo
Use the slider to select whether the information markers for the respective map area should be
shown or hidden.
North up
Aligns the chart so that North is always at the top. ®
Lookahead
Aligns the chart so that your ship is in the lower quarter of the chart so that you are always shown
more in the direction of travel.
Head up
Aligns the chart so that your course is always at the top.
NV Chart Group GmbH Bedienungsanleitung
15.07.2019 nv charts App 26Follow route
Aligns the chart according to the route being travelled.
More
Fontsize
Select the size of the font on your vector charts via a drop-down menu.
Symbolsize
Select the size of the symbols on your vector charts via a drop-down menu.
Safety contour
Use a drop-down menu to select which contour line should be highlighted in red.
Safety depth
Use a drop-down menu to select the security depth. All depths below your selection are highlighted
in black on the chart.
nv charts
Hide roads
Use the slider to select whether streets should be shown or hidden on the chart.
Hide cities
Use the slider to select whether cities should be shown or hidden on the chart.
Hide warning areas
Use the slider to select whether warning areas should be shown or hidden on the chart.
Hide military areas
Use the slider to select whether military training areas should be shown or hidden on the chart.
18.3 GPS/AIS
Position from
Use a drop-down menu to select how your position is to be determined.
The internal GPS describes the integrated GPS of your device. Normally, you can switch it on for
any mobile device.
External GPS must always be additionally connected to your device - for example via Bluetooth or
USB. AIS describes the use of the GPS via the AIS hardware.
Background tracking
Use the slider to select whether your activities should be recorded in the background.
More
Show AIS class A
®
Use the slider to select whether AIS class A targets should be displayed. These are mainly com-
mercial ships.
Show AIS class B
Use the slider to select whether AIS class B targets should be displayed. These are mainly recrea-
tional or fishing vessels.
AIS headingline
Use a drop-down menu to select how far you want to display the AIS destinations‘ advance lines.
NV Chart Group GmbH Bedienungsanleitung
15.07.2019 nv charts App 27AIS track
Use a drop-down menu to select the steps in which the course recording of the AIS destinations
should take place.
AIS label 1
Use a drop-down menu to select, which AIS label should be displayed above.
AIS label 2
Use a drop-down menu to select, which AIS label should be displayed below.
Choose WiFi router
Use a drop-down menu to select whether you want to save one, two or three routers.
The corresponding IP addresses and port numbers of the routers can be entered in the following
fields. Once you have entered the respective data, click on the „Connect“ button.
18.4 Weather
nv charts
Under „Area“ you can define in which area the current and wind data should be displayed. Here
you can set the settings to „Load automatically“ so that the data is always displayed on the current-
ly selected map section.
If the „Update automatically“ slider is active, the data will be continuously adjusted and changed
accordingly.
We recommend that you only set this function to inactive if you want to save power on the
device or if your device is experiencing display problems.
If the slider is active with „Show colors“, the water is colored according to the intensity when the
current / wind display is activated. Set this slider to inactive to display only the knot information on
the map.
18.5 Privacy
Activate Live-Position
Use the slider to select whether you want to activate the „Live-Position“.
Is this function activated, your position and boat name will be visiable to other app users.
Sync with other devices
Use the slider to select whether to enable synchronization with other devices.
If you use the nv charts app on several devices - for example, on the PC at home and on the tablet
on board - it makes sense to synchronize, so that your created routes, markers etc. as well as your
already activated charts are displayed on all devices.
If the synchronization is deactivated, your data will only be displayed on the device you are using.
The automatic synchronization happens about every 5 minutes. If you would like to synchronize
your data faster, you can do so via the „Synchronize now manually“ button.
®
19. Feedback
By clicking on „Feedback“ in the main menu you have the opportunity to send a message directly
to us. After clicking on the corresponding tab, you will be taken to a new window with an input field.
Here you can write your message and send it to us via the button „Send feedback“.
NV Chart Group GmbH Bedienungsanleitung
15.07.2019 nv charts App 28You will receive a copy of your message by e-mail.
You can use the feedback function if you‘ve noticed problems using the app, if you have sugge-
stions for improvements or, of course, if you have noticed something particularly positive.
Your opinion helps us to further adapt and improve the nv charts app in the future.
20. Help
The „Help“ tab takes you to a gallery where you can click through pictures and videos to help you
operate the app. In addition, you will find this manual at the end of the gallery.
21. About
By clicking on the corresponding tab, you can access the terms of use, the privacy policy and the
nv charts
licenses and can read them by clicking on the corresponding link. In addition, the current version of
the nv charts app is displayed.
22. User profile
Click on the field with your username and e-mail address at the bottom of the main menu to view or
change your profile.
22.1 With user account
Change profile avatar
Click on the camera icon and choose to either take a new photo or select one directly from the
gallery of your device.
Change username
Click on the edit icon behind your username and customize it.
Change your e-mail address
Click on „Change Email“ and then on the edit icon behind your email address and customize it.
Following you have to enter your password again and by clicking on the button „Change Email“
you can confirm your customization. You will now receive an e-mail with a confirmation link to the
previously entered address.
Change password
Click on „Change password“. First enter your old password and then your newly selected pass-
word, which you‘ll have to repeat once again. You can then confirm your customization by clicking
on the „Change password“ button.
®
After the change, you will first be logged out of the nv charts app, in order to log in again with your
new password.
22.2 Without user account
If you have accessed the nv charts app via the button „Create account later“ (see 4.3 Create ac-
count later), you have the option to add your own account in the user profile by clicking the button
„Create user account“. You will get back to the login screen of the app and can now follow the
instructions in 4.2 Create account.
NV Chart Group GmbH Bedienungsanleitung
15.07.2019 nv charts App 29You can also read