GETTING STARTED WITH SNAP SURVEYS
←
→
Page content transcription
If your browser does not render page correctly, please read the page content below
GETTING STARTED WITH
SNAP SURVEYS

                                                                             Reference V11/R Ganz/29/01/2015:17:11: Revision: 8

Should you require any technical support for the Snap survey software or any assistance with software licenses,
training and Snap research services please contact us at one of our offices.
Details can be found at www.snapsurveys.com or under About Snap in the Help menu of the software.

CONTENTS

    AN INTRODUCTION TO SNAP SURVEYS                                                                                                                            5

    SET UP A SURVEY FRAMEWORK                                                                                                                                  7

    DESIGN A QUESTIONNAIRE                                                                                                                                     9
    Start with a heading for the survey ..............................................................................................................9
    Add your first multiple-choice question .....................................................................................................10
    What about those "other" questions ..........................................................................................................11
    Add a question grid .....................................................................................................................................11
    Allow for any free-form comments.............................................................................................................12
    Pick a demographic question from the SurveyPak library ........................................................................12
    Add a logo to the title..................................................................................................................................14
    Format the screen layout ............................................................................................................................15
    Add routing/skip instructions .....................................................................................................................16

    PUBLISHING THE QUESTIONNAIRE                                                                                                                            18
    Upload the published survey to Snap WebHost.........................................................................................19
    Test the survey.............................................................................................................................................21
    Set up the survey and make it available.....................................................................................................22

    4. COLLECTING ONLINE SURVEY REPLIES IN SNAP WEBHOST                                                                                                     23

    ANALYZE THE SURVEY RESULTS                                                                                                                              25
    Looking at the survey reports .....................................................................................................................25
    Analyze the entire questionnaire ...............................................................................................................27
    Analyze a single question ...........................................................................................................................28
    Cross-tabulating a group of questions.......................................................................................................29
    Producing a stacked bar chart....................................................................................................................31
    Moving the legend on the chart..................................................................................................................32
    Changing from a bar chart to another chart type......................................................................................32
    Saving and retrieving tables and charts ....................................................................................................33

    ACCESS AN ONLINE CUSTOMER PANEL WITH SNAP WEBHOST                                                                                                       35
    Create a customer panel .............................................................................................................................35
    Add a login ID to the questionnaire............................................................................................................36
    Link the survey to the customer panel........................................................................................................37
    Upload the survey to Snap WebHost ..........................................................................................................41

3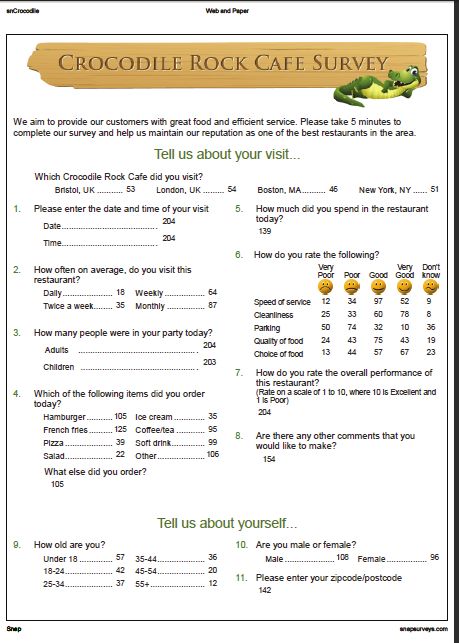
Test the survey login ...................................................................................................................................42
    Set up the survey and make it available.....................................................................................................44

    CREATE A PAPER VERSION OF THE SURVEY                                                                                                                       46
    Setting up the design for the paper version ...............................................................................................46
    Enter the replies from the paper questionnaire .........................................................................................48

    IMPROVING RESPONSE RATES                                                                                                                                   50
    Reminders....................................................................................................................................................50
    Incentives.....................................................................................................................................................50
    Improving the online experience................................................................................................................51

4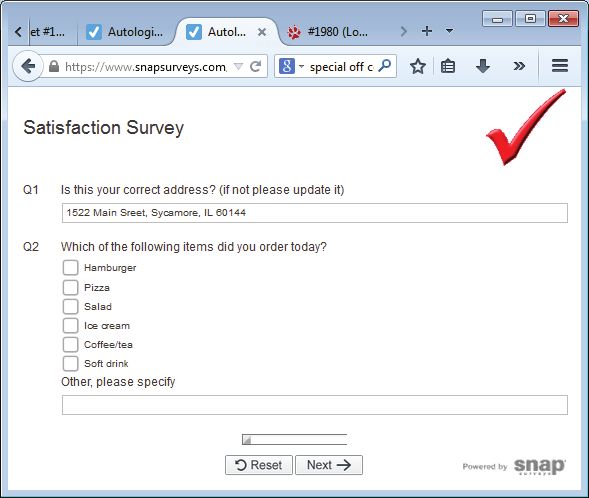
AN INTRODUCTION TO SNAP SURVEYS
Snap can produce surveys for all formats, including online, paper, scanning, email, smartphone,
kiosk, tablet, laptop and phone.
To complement Snap's online help, this Getting Started guide focuses on designing and publishing
an online survey. It also covers online customer panels, analyzing the results and creating a paper
version of the survey.
Snap online surveys are easy to create and deploy. Features include:
routing/skip patterns
dynamic text substitution
rotation and randomization of questions
rotation and randomization of question codes
range checks
Must Answer option
images and color
full Rich Text formatting
sound and video
email invitation/reminders and social media links
automated scheduling of surveys and email invitations/reminders
survey login facility (with optional password)
pre-seeding surveys with database data (Excel, Access or SQL)
quota controls
saves of partially completed survey response data for analysis and "dropout" review
attaching files to survey responses
full survey analysis capability on the server (including real-time updates of predefined and ad
hoc analysis)
5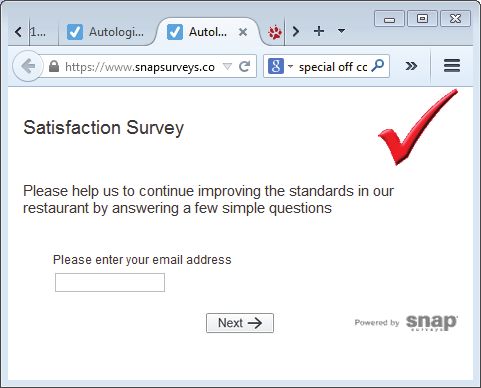
automatic topline reports
and much more.
Online surveys created with Snap may be hosted on a Snap WebHost server maintained by Snap
(subscription service). You can also purchase the Snap WebHost software and install it on your own
server.
6SET UP A SURVEY FRAMEWORK
When you first start Snap you are presented with the Survey Overview window showing a list of
all the surveys that have been stored in your current working folder.
1 To start a new survey, click at the top of the Survey Overview window. A new dialog will appear
entitled Survey Details.
2 Type a name in the Survey field e.g. Quick
3 Press [Tab] and enter a description of QuickStart Satisfaction Survey in the field marked Title.
4 Below the Title field is a series of fields marked New Survey Settings, which set out the look and
feel of the questionnaire.
The setting for Publication Medium is Web: Snap WebHost.
The default setting for Language is set by your system.
The default Style Template is set to Default Web.qsf. This creates an initial layout for your
web questionnaire, together with the fonts and the buttons used in your questionnaire.
These settings can all be modified but leave them as they are.
75 Click [OK] to create the framework for the new survey. Snap will then display the Questionnaire-
Design Mode window, which at present contains no questions. At the top of the screen you will
see lines marked "Hidden". These tell you that Snap will store information about the survey
responses, such as the completion date.
8DESIGN A QUESTIONNAIRE
Snap has over a dozen different types of styles and questions. These range from multi-choice
questions to open questions, from free text to numeric answers, from titles and subtitles to notes
and instructions. Each of these has a style defined in Snap. You enter the question text and answer
labels and Snap will format the questionnaire for you.
Snap comes with style templates that have been created for particular tasks. The Default Web
template has been designed for web surveys and includes all the buttons, the colors, the
background, the fonts, the drop down lists and the layout for a basic web survey. None of the
templates are fixed – you merely use them as guides. If you want to alter a specific question layout,
you can. Snap will keep all your changes with that particular survey.
Start with a heading for the survey
Headings and sub-headings can be placed anywhere in your survey, but Snap assumes that a new
survey has a heading at the beginning together with some instructions. The Default Web template
has been set up so that the styles Title and Sub Title are assumed to start the questionnaire.
The toolbar at the top of the Questionnaire window already shows Title as the Style Name for the
first item. (The default settings for Title are for the text to be blue in an Arial font).
(The Questionnaire – Design Mode window should already be open. If not, then click the
button on the main toolbar. You will see a blank questionnaire showing a highlighted area for the
Title of the survey).
Immediately below the toolbar is an area that lists information that is automatically added to the
survey. Below this there is a highlighted area for you to enter the title.
1 In the area marked Click here for text, type Satisfaction Survey. The default style is Arial 20 point
but you can change the look of the text by highlighting any of the words and selecting an
alternative font on the toolbar.
2 Press [Enter] when you have set up your title. An area for a Sub Title will then appear.
3 Type Please help us to continue improving the standards in our restaurant by answering a few simple
questions in this area. The default setting for Sub Title is Arial 16 point.
4 Press [Enter] when you have set up your sub-title.
That's how to put headings in your survey. Along with instructions, they can be placed anywhere in
a questionnaire. Now move on and set up a few questions.
9Add your first multiple-choice question
After you’ve entered the subtitle and pressed [Enter], Snap automatically creates the first question.
By default, this is created as a single response question and the question style is shown as Single
Choice on the toolbar. It is stored as Q1, but only the number is displayed on screen, as defined by
the style template.
Our first question is about the items purchased in the restaurant. The respondent will be presented
with a list of options, and they can select as many as they wish. This is a question that accepts
multiple responses so you need to change the style to Multi Choice.
1 Select the dropdown list on the toolbar where it says Single Choice and change it to Multi Choice.
The shape of the response boxes changes from a radio button to a square.
2 An area is marked Click here for text. Type Which of the following items did you order today?
3 Press the [Tab] key on your keyboard. The cursor moves into an area by the selection box. Type
Hamburger and press [Tab] to move to the next line. Snap creates a selection box for that option.
4 Continue with the text for the other items and press [Tab] after each one:
Pizza [Tab]
Salad [Tab]
Ice cream [Tab]
Coffee/tea [Tab]
5 For the last code, Soft drink, type it in but at the end, instead of pressing [Tab] press [Enter], which
will tell Snap that you want to finish this question and start a new question.
10What about those "other" questions
It’s likely that your list of items will not be exhaustive, so it’s wise to add a space to allow the
respondent to key in anything that is not mentioned on the list. This is done using an Other
question, which collects any combination of text or numbers.
1 With the window showing 2 as the next question, use the button to the right of the words
Single Choice to display the full list of other question style names. Select Other. This allows the
respondent to enter free format text and moves the question up to the question above.
Snap does create this question as Q1a, but the question number is hidden from view.
You can quickly create an Other type question by entering [Ctrl]+[Enter] at the end of your multi-
choice question instead of [Enter].
2 Click the box marked Click here for text and type Other, please specify. Snap creates a box that
expects up to 100 characters. This should be sufficient to store whatever’s written. You’ll see later
how to alter the size of the box to hold more data.
3 That’s all you need to create this type of question, so press [Enter] and Snap will move on to create
the next question (Q2).
Add a question grid
The next task is to create a Grid which is simply a series of Single Response questions organized in
the form of a grid.
If you haven't already done so, press [Enter] to complete question 1. Snap creates the structure to
set up question 2. Click the button to the right of the words Single Choice on the toolbar to
display the other style names and select Grid First.
1 In the area marked Click here for text, type How did you rate the following? and press the [Tab] key
on your keyboard.
2 The cursor moves to the list of codes across the top of the grid.
Type Very good and press [Tab].Type Good and press [Tab]. Type OK and press [Tab]. Type Poor and
press [Tab]. Type Very poor and since this is the last code to be set up, press [ ] instead of [Tab].
3 The cursor will move to the text of the first Grid label. Type Service and press [Tab]. Type Quality
and press [Tab].
11For the last Grid label, type Price but instead of pressing [Tab], press [Enter] to complete the grid
and move to a new question (Q3).
Allow for any free-form comments
The last question is totally free format to allow the respondent to record feedback comments. Snap
has automatically started to create Q3 and all you need to do is to change it from a Single Choice
question to an Open Ended.
1 Use the button to the right of the words Single Choice on the toolbar. A drop-down list will
appear, displaying the other style types, and you should select Open Ended. This will allow the
respondent to enter free format text as a reply. Type Do you have any other comments?
2 The default capacity for this box is 100 characters and it appears as a single line. If this is not
enough space, it is easy to increase. Make sure that Q3 is selected, then use [Ctrl] + [+] to increase
the size.
3 You’ve now successfully created a short questionnaire. Click on the toolbar to save your work.
In the next few steps, you'll see how to access preset questions from one of the libraries and add
images and routing instructions.
Pick a demographic question from the SurveyPak library
SurveyPaks contain frequently used questions that can be copied directly to a Snap survey,
avoiding the need to specify the question from scratch. You can then edit the question within the
survey. You access the SurveyPaks from the Reference window.
Close all windows except for the Questionnaire- Design Mode window. Open the Reference
window by clicking on the button of the main program toolbar.
1 Select Window | Tile so that the two windows are arranged side by side.
2 Double-click on the Personal Demographics category in the Reference SurveyPak.
123 Double-click the Age topic to display a number of age related questions. Highlight the first age
question Age of respondent. The text of the question and the codes are displayed in the bottom
part of the window.
4 Drag the Age question from the SurveyPak into the questionnaire. With the pointer hovering over
the Age question, press and hold the left button, and as you move it, the pointer will change to
. Keep the left button pressed and drag the question from the Reference window on the left to the
Questionnaire window on the right. As you move the pointer over the questionnaire, it will alter
once again:
insert the new question before this question.
replace this question with the new one.
insert the new question after this question.
5 When you release the mouse button, the new question is dropped in the position indicated and
will adopt the same look and feel as all the existing questions in your survey.
Wherever you place the question, it is now part of your questionnaire. You can make changes to
the text or add, edit or delete codes in the list. Snap will allocate a number to your new question
wherever you’ve placed it.
6 To move your Age question, click anywhere on the question. An aqua border appears around the
question. You can use the [Ctrl] + [ ] or [Ctrl] + [ ] to move the question. Snap will automatically
renumber the question as you move it. Move the Age question until it appears as Q3.
137 The Age question is currently shown with radio buttons. To change this to a drop-down list,
highlight the Age question so that an aqua box appears for editing.
Access the first list on the toolbar currently showing Multi Choice and select Drop down. If this is
not visible, select More Styles… to see more alternatives on the Style Picker list. Select the Drop
down style and then click [OK] to close the Style Picker.
8 You’ve finished with SurveyPak libraries in this exercise so you can close the Reference window,
and make the Questionnaire – Design Mode full screen.
Add a logo to the title
1 Select the Title field showing Satisfaction Survey. When you’ve selected it, an aqua border will
appear around it.
2 Select Background in the toolbar topic dropdown list and click the [Picture] button.
The Picture dialog will open, allowing you to select an image to insert, and choose its position.
3 Click the [Browse] button. The folder Images\ opens by default. Change to the sub-folder
Images\Icons.
4 Select the file tick_icon.gif and click [Open].The Picture dialog displays your choice. Select the
Horizontal Alignment drop-down list and change it to Right. This inserts the picture at the right-
hand end of the title text. Set the radio buttons for both Horizontal and Vertical Alignment to Fit
to put a single copy of the picture in a fixed position. You may wish to alter the color of the image
by using Colourize Gif.
145 When you’ve made your changes, click [OK] to return to the Questionnaire – Design Mode window
showing the logo added to the title of the survey.
The logo is larger than the space for the title text, so it may appear cropped when you do this.
Don’t worry, when you publish the survey as a web page, it will appear normally.
6 Click to save the changes to the questionnaire.
Format the screen layout
When you are creating a web survey, it is important that respondents do not miss any questions
because they are not immediately visible. Snap adds buttons at the bottom of each screen to help
navigation through the survey.
1 Click on Q2 to select it.
2 To introduce a page break, you have three alternatives:
Click the right-hand button on the mouse and select Break.
Press [Ctrl] + [Shift] + [B] to insert a page break above the question.
A third alternative is to change the Toolbar setting from Background to Break and checking
the Page Break box.
3 When you’ve added the page break, click to save the changes to the questionnaire.
15dd routing/skip instructions
You rarely ask every respondent every question. It is quite typical to only ask questions based on
replies to other questions in the survey. To show this in operation, create an extra question of What
would you expect to pay? and only ask this question of those people who rated the restaurant as
Poor or Very poor in terms of Price in Q2. Anybody who replied either Very good, Good or OK
will not be asked the question.
1 The first step is to create an extra question after Q2. Highlight Q3 and select to create a new
question. Snap generates a new question with the same type (in this case, a Drop down). For a
question to record a number (such as price) it needs to be Open Ended.
2 On the Toolbar options, alter the style from Drop down to Open Ended to allow any character or
number to be entered in the box.
3 In the area marked Click here for text, type What would you expect to pay?
4 By default, open-ended questions have a response type of literal. This means that any characters
can be entered in the box. To ensure that respondents enter a number, you must convert the
response type to Quantity. You can then perform calculations on the result.
Click on to display the Variable Properties for Q3. Alter the Response value from Literal to
Quantity. This question will now only accept numbers. Since you know that the respondent is
entering currency information, you can set the parameters to be slightly more specific.
Scroll down and change the Source Pattern from (Default Quantity) to Currency. Snap will now
recognize not only a number, it will also accept a currency character such as $ or £.
5 Click [OK] to return to the questionnaire.
Now to create the routing rules…
161 Right-click the mouse on Q3 and select Routing Rules from the context menu. Alternatively, click
the button on the Questionnaire Design toolbar. The Routing Rules dialog will appear.
2 Click [Add] to create a new routing rule.
3 Select Conditionally Ask Question from the Type box and click [OK]. This means that the
question will only be seen if the conditions you set are met.
4 The Rule Details dialog appears. The cursor is located in the If box.
5 Type Q2c=(4,5). This means that the question will be shown if the answer to Q2c (price rating, the
third part of Q2) is code 4 or 5 (Poor or Very poor). Click [OK].
6 A small arrow appears to the left of the question. You can double-click it to see the Rule Details
dialog.
7 Press [Ctrl] + [Shift] + [B] to insert a page break above this question. Repeat the process to add a
page break to Q4. Click to save the changes to your questionnaire.
17PUBLISHING THE QUESTIONNAIRE
Your questionnaire is now ready for publication, a process that will transform your questionnaire
into a form that is accessible by any standard web browser. It is worthwhile selecting the Preview
option as it will enable you to see how the questionnaire will appear in a web browser and will
allow you to enter some test replies and try out the routing instructions. Should you need to make
any changes, you can simply return to the questionnaire in Snap and then publish again to
overwrite the files that have been created.
1 Select File | Publish to display the Publish Questionnaire dialog. This allows you to specify exactly
how your survey will be published.
2 Select in the left-hand column headed Section if it not selected.
3 Snap has entered a name to identify the file in the field marked Access Name. Change it if you
wish, but note what name you use.
4 Select Publish with Preview as the Output Method. The Preview will open a new window and
display your survey as it would appear in a web browser immediately after it has been published.
Use this previewed survey to test your web survey prior to placing in on the web server for
execution.
5 Click to set the Output Path to a folder where you wish Snap to place the published survey and
associated images.
186 Select in the left-hand column headed Section of the Publish Questionnaire dialog.
In the Responses field, clear the Email responses box and check the Save responses on server
box. This stores the completed survey responses on the Snap WebHost server. You can download
them to your PC (or other PCs) to analyze them there, and view uploaded analyses on the server.
You can also enter an address in the Web Page after Submitting field. Respondents will be taken
to this address when they submit the survey.
7 Click [Publish] to publish the survey and create a zip file containing all the necessary files for your
Snap WebHost survey in the folder you specified.
You must now upload the survey to the Snap WebHost server so that it is accessible by
respondents.
Upload the published survey to Snap WebHost
1 Log into your Snap WebHost account via the Snap website (www.snapsurveys.com/login).
When you have logged in successfully, Snap WebHost displays the list of surveys in your account.
192 Select Upload a new survey to display the Upload New Survey dialog.
3 Browse your PC/laptop to find the quick.zip file for the survey in the folder you specified as the
Path when you published the survey.
4 Click [Upload Archive] to upload the survey from your PC to Snap WebHost.
5 When Snap WebHost has uploaded the survey, a message appears to confirm that the survey has
been uploaded. Click the [Close] button.
The list of surveys is updated for the current user account, showing the survey using the Access
name of quick.
6 Click the name (quick) to show the details of the survey.
20Test the survey
The Summary screen is the place where you start the survey. It shows the link that you can place on
a website or email people to take the survey, and allows you to test the survey.
To test the survey, click the Test URL.
21Set up the survey and make it available
1 Select the Setup tab. If you want to start and finish the survey on preset dates, enter these on the
Project Start date and Project End date fields and click [Save].
Because you set Save responses on server when you published the questionnaire in Snap on your
PC, the Save responses box is checked here.
2 Start the survey from the Summary tab. If you have set up a start date, you must click the Wait for
Schedule link, if not, click the Start Questionnaire Now link.
3 Once the survey has started, provide the respondents with the survey URL (provided as "URL will
be:" in the Summary tab for the survey). When a respondent clicks on the URL, the survey starts.
When the respondent clicks the [Submit] button at the end of the survey, the data is sent to the
Snap WebHost server and stored in a file for later download.
224. COLLECTING ONLINE SURVEY REPLIES IN SNAP WEBHOST
Once you've created and published your questionnaire, you're ready to analyze the replies from
respondents. The responses have been stored on the Snap WebHost server. You can either
download them to your PC for analysis or view analyses on Snap WebHost. Setting up the Snap
WebHost analyses is not covered in this short introduction, but you can find full details in the
online help (index topic "Data Analysis with Snap WebHost").
1 In Snap WebHost, choose the section .
2 Click the survey link for quick.
3 It will open in the tab. Towards the bottom is a link Download Snap data (if the link is not
present then there are no respondent cases to be downloaded).
4 Click the link.
5 You will be asked if you wish to open or save the file. Click [Save].
6 Depending on the operating system of your PC, you may be able to save the file to a specific
location. It is a good idea to have a standard folder into which you place response data for each
survey. Note that, by default, the file will be saved under the name of the survey and the time/date
of the download.
7 In the desktop copy of Snap 11, open the Quick survey.
8 Open the Data Entry window for the survey and choose File | Import. The Data Import dialog
appears.
9 Set the Format to be WebHost responses.
2310 Set the Folder to be the same folder as specified when you downloaded the data from Snap
WebHost.
11 Click [OK] to import the responses.
24ANALYZE THE SURVEY RESULTS
You can view your analyses and reports on Snap WebHost as soon as the data comes in. You must
first create the analyses and reports you want to view.
To help you start analyzing a survey, we’ve provided you with a sample survey called Crocodile. It
already has over 200 completed replies.
1 Click to open the overview window. If the Crocodile survey is not visible in the window, you will
have to click [Browse] on the toolbar to find the folder where it is.
2 Double-click the survey to open it.
Looking at the survey reports
A unique feature of Snap is its ability to create two reports for you automatically.
The Questionnaire report generates a top-line summary report showing the counts/percentages
of responses in the questionnaire layout.
The Summary report generates a chart, table or list for every question, as appropriate.
You can find these in the Reports window.
1 Click on the Snap toolbar to open the Reports window.
2 Select the Questionnaire report in the window.
3 Click the button on the Reports window toolbar to run the report.
4 The Report Execution dialog will open. It will send a report straight to your printer. If you want to
use a different printer (such as a PDF writer), click [Printer] to choose a printer
255 Click [OK] to run your report.
Running the Summary report
1 Select the Summary report in the Reports window.
2 Click the button on the Reports window toolbar to run the report.
3 The Report Execution dialog will open. It will send a report straight to your printer. If you want to
use a different printer (such as a PDF writer), click [Printer] to choose a printer.
264 Click [OK] to run your report.
Analyze the entire questionnaire
You can create your own topline report and print it from the Questionnaire window.
1 Click the button on the main toolbar to display the Questionnaire - Design Mode window.
272 Select the Paper tab at the bottom of the survey window to show the version of the questionnaire
for printing.
3 Click the button in the Questionnaire window to switch to Questionnaire - Data View Mode.
4 Click the button next to Case Data, and select Counts. Check the Percentage box to show the
percentage of respondents giving each answer. For example, 9% of visitors ate at the restaurant
every day.
Clear the Percentage box and select the Absolute check box. The questionnaire will now be
presented with the number of respondents giving each answer. You’ll now see that 18 of the 204
visitors ate at the restaurant every day. Use the vertical scroll bar to view more of the questionnaire.
Analyze a single question
Frequency tables are the quickest and easiest method of tabulating single questions. You can
produce them in Snap just by specifying the name of the question or questions.
You can then use Snap to calculate percentages in tables, filter results to look at subsets of data
and apply scores to results.
1 Click on the main Snap toolbar to create a results table. The Analysis Definition dialog will then
appear.
2 In the Analysis field, type q2. The drop-down list for the Calculate field should show Counts and
Percents.
3 In the Style field, use to select a style for the appearance of the table. Choose Font Size 10.
284 In the Show Options section, select Counts and Base Percents. Counts shows how many cases
fall into each category and Base Percents shows all answers as a percentage of the base, i.e. total
number of respondents.
5 Click [OK] to build the frequency table.
6 Click to save the table. The name of the saved table, AN18: Frequency of visit, will appear as
the window title. If the Questionnaire – Design Mode window is still open, you will get a message
asking you to close it before the table can be saved.
Do not close the window containing this table, as it will be used in the instructions on the next few
pages.
Cross-tabulating a group of questions
You can also cross-tabulate one question against other questions. For example, you could analyze
the frequency of visits and break the results down by age. This example drags the question
response to be analyzed directly into the table from the Variables window (instead of using the
button to show the definition).
291 Click the button to open the Variables window.
You should now have two open windows: one containing a list of variables in the survey and
another showing the table produced in the previous section.
If the table is not open:
Click the button to open the Analyses window.
Double-click the table, or select it and click the button.
2 Arrange the two windows with the Variables window on the left and the table of Q2 on the right.
3 Check the list of variables to make sure that Q9 is showing.
4 Click and hold on Q9. As soon as you move the mouse, the cursor changes to . Drag Q9 into the
box above the base figure.
30The cursor changes to to show you are adding a column. Release the mouse to build the new
table.
5 To alter the table further, click to display the Analysis Definition dialog box. Snap supports
Counts and any combination of the three percentages – Analysis Percents, Break Percents or
Base Percents. Select any of these in the Options field and click [OK].
You can now convert the cross-tabulation into a chart.
Producing a stacked bar chart
1 Click to display the Analysis Definition dialog showing the definition of the table you’ve just
created. It has Q2 in the Analysis field and Q9 in the Break field.
2 In the Type field, select Chart rather than Table.
3 Choose Horizontal Stacked Bar Counts as the style from the drop-down list and click [OK]. A
stacked bar chart will be displayed.
31Moving the legend on the chart
1 With the cursor anywhere over the chart, right-click and select Chart Designer from the context
menu. The Chart Designer dialog appears.
2 Select Legend.
3 Click the Location tab and make sure Visible is checked.
4 Click the radio button at the position where you want the legend to appear.
5 Click [OK] to apply the changes.
Changing from a bar chart to another chart type
You can easily change the type of chart. There are three ways of changing the format of your
charts.
Select a different template from the Analysis Definition dialog
Use the Chart Designer to make small adjustments
Use the Chart Wizard option to quickly alter the layout.
1 Open the window containing the bar chart from the previous section if it is not already open.
2 Right-click to display the context menu and then select the Chart Wizard option.
323 Select a chart type from the Gallery dialog. For simplicity, produce a 2-D vertical chart. The 2-D
radio button and the Bar style should be selected. Click [Next>].
4 With the Style dialog displayed, select any of the layouts from the list. For this tutorial, select
option 1.
5 Click [Next>] to see the Layout options. You may need to change the position of the Chart
Legend to the Bottom to make it clearly visible.
6 Click [Next>] to display the Axes options. You do not need to change them.
7 Click [Finish] to build the chart and return to the Analyses window in Snap.
Saving and retrieving tables and charts
Any analyses that you’ve defined can be saved with the survey, so that the next time you access the
survey they are automatically updated to reflect any new respondents that have been added.
1 To save an analysis you have created, click in its window toolbar.
2 If you do not wish to save it click .
3 To view your saved tables and charts, click or select View | Analyses.
33The Analyses window displays the list of saved analyses. Select the one you wish to look at and
double-click on it to open it.
There are several different layouts of tables and charts in the Crocodile survey, many with added
images and color schemes.
When a survey that includes analyses is uploaded to Snap WebHost, the reports and analyses can
be seen over the Internet. They are updated with new responses whenever you view them.
34ACCESS AN ONLINE CUSTOMER PANEL WITH SNAP WEBHOST
There’s often a requirement to link a survey with a database containing information that might be
relevant to the survey, for example, a Customer Panel of people who’ve signed up to take part in
regular surveys. This database might hold a unique login code for each member of the panel,
together with information about the panel member such as gender, age, address etc. You can
avoid asking demographic questions by holding such information in an external database, as Snap
can use the information directly.
This section shows how this works in Snap. It assumes you have access to Snap WebHost. You will:
Create a simple database using Excel.
Modify the questionnaire created earlier, to include a login code.
Link the survey to the database and create email invitations for your panel.
Publish the questionnaire and upload it to Snap WebHost.
Carry out the survey from Snap WebHost.
Create a customer panel
The database displayed is a simple Excel spreadsheet and contains just 2 fields – an email address
that can be used as a Login ID and a mailing address that can be imported into the questionnaire,
enabling the panel member to check it and update it as necessary. Other fields such as Date of
Birth, Gender, etc. could be included in such a database. For the purposes of this demo, we’ve
created the XLS and named it as Customer Panel.xls.
When the panel member logs into the survey on Snap WebHost, the email address they have used
to log on is checked against the data from the Customer Panel database. If it is valid, they will see
their mailing address as the Address in the questionnaire.
35Add a login ID to the questionnaire
1 To add a login ID to the questionnaire, click on to display the Questionnaire Properties dialog
box. Scroll down the options on the left to locate the Paradata section. Once selected, highlight
the Respondent field and check the box marked Use in survey. Press [OK] to return to the
questionnaire.
(If a dialog box should appear reporting that the questionnaire is locked, press [OK] to unlock the
questionnaire and continue editing.)
The ID.name variable will appear below the title.
2 Select the ID.name and using [Ctrl] + [ ], move it to just below the sub-title entitled “Please help us
to…”
3 Although Snap gives a name to each variable, you do not need to show the name on the
questionnaire. Highlight ID.name, and select the Show toolbar option.
4 Select Name in the next dropdown list if not displayed and uncheck the Show box. The ID.name
will be hidden.
5 Change the default text to “Please enter your email address”.
6 To add a question relating to the mailing address field in the Customer Panel database, highlight
the current Q1 and click to add a new question numbered Q1. Snap automatically renumbers all
the existing questions from Q2 onwards.
367 From the toolbar list, change the question style from Multi choice to Open Ended and type in a
question text of “Is this your correct address? (If not, please update it)”.
8 Click on Q2 and press [Ctrl] + [Shift] + [B] to insert a page break above this question.
9 Save your changes to the questionnaire by selecting the icon in the Questionnaire Design
window.
If a dialog box should appear reporting that the questionnaire is locked, select [Yes] to unlock the
questionnaire and continue editing.
Link the survey to the customer panel
Now you've included both an ID and a mailing address, you can link the contents of the Customer
Panel database to variables within the Snap survey.
1 Select File|Database link to open the Database Linkage dialog.
372 Click [New…] to start the Database Linkage Wizard.
3 Select Webhost Survey/Invites as the Linkage Type and press [Next>].
4 Click on [Select Database File] to locate your XLS Customer Panel. Once selected, click Open.
5 The Database Linkage Wizard reappears so you can specify the Table to use. It automatically
chooses the most likely one (in this case, Customers of the Excel spreadsheet). Once you've
selected the correct details for your database, press [Next>] to continue.
386 Select Identify respondent with manual or automatic login.
For the Login, select the right-hand drop-down and select the Customer ID in the database.
You must choose a field that is tagged with [Unique Values]. If it has not been tagged, then check your
database for duplicates.
For the purposes of this demonstration, no password is required.
7 Select the boxes for Send email invitations and reminders and Seed database data into
questionnaires. This lets you populate the questionnaire with the email address for each
respondent.
Setting up the email
1 Click [Next>] to see the email invitation dialog.
2 Set the email address field to Address (unique values) in the drop-down list if it has not been
selected automatically.
3 Type the subject heading of your email in the first box and type the email message in the large box.
Use the [Insert...] button to insert a Survey Location. This will be replaced with a link when the
message is uploaded to Snap WebHost.
39If you want to create a reminder email to be sent to people who have not responded, click the
Reminder tab and create a Reminder email message in the same way. The default reminder
message has the same text as the invitation, but you can edit it independently.
4 Press [Next>] to continue.
5 The final dialog box links the fields in the database to the variables in the questionnaire. On the left
of the dialog box are the fields in the database. For the field marked Address, click on the
equivalent box on the right and a drop-down list of Snap questionnaire variables will be displayed.
Select Q1- Is this your correct address? and press [Next>].
6 The task is complete once a unique name has been provided for this database link. Enter Panel of
Respondents and press [Finish] to close the wizard.
7 With the task complete and the Database Linkage dialog box showing Panel of Respondents,
press [Close] to return to the questionnaire.
408 The final step is to select the Questionnaire Properties icon and access the option from
the left-hand list to select the Panel of Respondents as the Database link to be used for the
survey. Pressing the [OK] button will return you to the Questionnaire – Design Mode window.
Upload the survey to Snap WebHost
Snap WebHost will provide each respondent with a login screen and display the full questionnaire
when the respondent logs in.
1 Publish the survey as you did in Publishing the questionnaire (see page 18).
2 Log into your Snap WebHost account via the Snap website (www.snapsurveys.com/login) if
you are not still logged in.
3 The survey list appears.
4 Because you have made changes to the number of variables in the survey, you should load the
survey as a new survey. (If you had just made changes to how the survey looked, you could use the
Reload option).
Click Upload a new survey to open the Upload new survey dialog.
5 Browse for the zip file for the survey and then click Upload Archive to upload the new version of
the Quick survey from your PC to Snap WebHost.
6 When Snap WebHost has uploaded the survey, the Close dialog will appear and will confirm that
the survey has been uploaded under the name quick_1 (since you have already uploaded a survey
called quick).
417 The list of surveys will be updated.
Test the survey login
It is worth testing the survey to confirm that the login works as expected.
1 Double-click the survey name to open the Summary tab for the survey. Note that 3 respondents
have been uploaded.
2 Click on the Test URL for the survey.
423 The survey will start and display the login screen requesting an email address. Enter one of the
email addresses from the spreadsheet.
When a valid email address has been entered, the current mailing address appears.
4 From there all the other questions on the questionnaire will be displayed.
Any data captured when testing the survey with the Test option will be kept in a separate data
file from the file containing the replies from the respondents.
43Set up the survey and make it available
1 Select the Setup tab.
In the Responses section, you will that the Enable respondent login option has been selected.
This is because the respondents are being identified in the survey. The Allow multiple responses
option is now available. This allows you to permit or stop them completing the survey multiple
times.
The Allow multiple responses box should be deselected to limit each respondent to completing
the survey once.
2 In the Project section, set up start and end dates if you wish to limit the duration of the survey.
3 Save your changes by clicking [Save].
4 Go to the survey Summary tab and start the survey.
44You can view analyses on Snap WebHost in the same way that you can view them on your PC.
Using analyses in Snap WebHost is not covered in this short introduction, but you can find full
details in the section "Data Analysis with Snap WebHost" in the online help).
45CREATE A PAPER VERSION OF THE SURVEY
You may be distributing your survey via the web, but a paper version of the same survey can also
be very useful. You can mail a paper version to any respondents who do not have access to the
internet.
A printed paper version of the questionnaire allows colleagues to comment on the design and
content of the survey.
Setting up the design for the paper version
1 Open your survey in Questionnaire - Design Mode window using the button.
2 Click the Editions and Style Templates button to display the Editions and Style Templates
dialog.
463 Click [New...] to create a new edition, and in the Publication Medium field, select Paper.
You may be asked if you want to alter the page size of the questionnaire to match your current printer.
4 Select Load Style to choose a new style for the layout of the paper questionnaire. Select
Default.qsf from the drop-down list to access the template for a paper survey. You can also browse
for style files by clicking the button.
5 Click [OK] to close the New Survey Edition dialog.
6 Click [OK] to return to the Questionnaire – Design Mode window.
Snap creates a new tab entitled Paper:Keyed to display the paper version of the same
questionnaire.
You can make changes to different editions of the same questionnaire, and all the responses will
still be analyzed together:
Certain questions can be hidden…
Other questions can be phrased slightly differently.
Page breaks can be placed in different places for different types of surveys.
An entire questionnaire can be presented in a different language.
These capabilities are fully covered in the help and worksheets available online. As a quick example
here, hide the question checking people's address and remove the page breaks set up for the web
survey, so that the questionnaire will fill a full printed page.
7 The login question will be hidden automatically, but you need to hide the address question. Click
anywhere in the text of Q1 to select it.
8 Select Show in the list of toolbar topics, (All) in the second list and clear the checkbox for (All).
9 Click anywhere in the text of Q2 to select it. Press [Ctrl] + [Shift] + [B] and the page break will
disappear. (Pressing [Ctrl] + [Shift] + [B] again will put the page break back.)
10 Now remove all the other page breaks in the same way.
11 To publish and print your paper questionnaire, select File|Publish or click the Print Preview
button .
A dialog may appear if you’ve altered the questionnaire asking you to select [Yes] to keep the changes
or [No] to ignore the changes.
The Printing Options dialog appears. It has a [Publish] button if you have selected File|Publish,
and a [Print] button if you selected print preview.
4712 To print a single proof copy, click [Publish] (or [Print]). Once you have proofed and checked your
questionnaire, you can print multiple copies by clicking the [Number of Copies...] button.
Enter the replies from the paper questionnaire
1 From the Survey Overview window, open the Quick survey, i.e. the survey that you created at the
beginning of this tutorial.
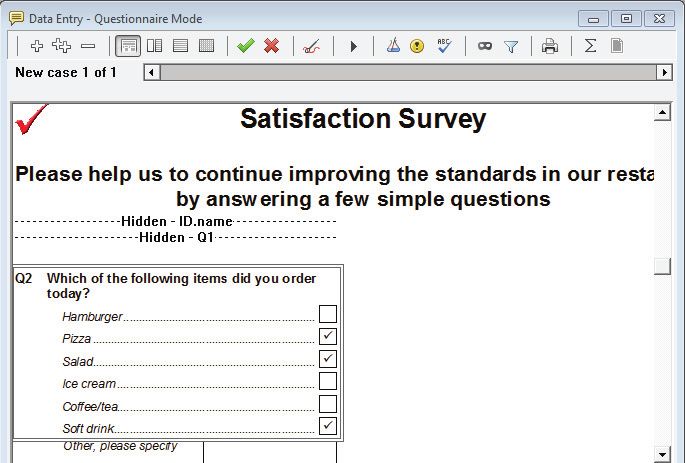
2 Click the button on the main toolbar to open the Data Entry window.
3 Click the button on the Data Entry window toolbar to switch to Questionnaire Mode. The
window title should be Data Entry - Questionnaire Mode (Test Case).
4 Click the button to tell Snap that you wish to enter data for a new case. The text just below the
button should change from Test Case to New case 1 of 1.
5 Click on the code boxes for Pizza, Salad and Soft drink. A tick will appear in each box. If you
accidentally clicked on one of the other boxes then simply click that box again to remove the tick.
6 Press [Enter] to move to the next question. In this case the next question asks for other foods
bought. Type Apple Pie and press [Enter] to move to the next question. Depending on the way your
copy of Snap has been set up, a warning message may appear if you press [Enter] without entering
a reply. Click [Yes] to continue.
7 In the grid question, you can also use the keyboard. Press [1] to select the first code when the
question is selected. Press [Enter] to move to the next part of question 2 and enter another
response (1, 2, 3, 4 or 5).
488 Press [Enter] to move to the next question. Note that the routing functions here too. If you selected
Poor for Q3c, you will be taken to Q4 What would you expect to pay. If not, you will be taken to
the age question.
9 Enter appropriate responses (including a comment such as The food was cold) and press [Enter]
after each question.
10 When you have completed the questionnaire you are given the options:
11 Select [Continue] to save the data and move on to Case 2.
12 When you have finished the last case, select [End] and all the data will be saved.
By default, you must press [Enter] after each completed reply in Snap. This is a safety setting for
new users. Experienced users can tailor Snap so that the [Enter] key is not required after each reply
and the software moves from one question to the next as a valid reply is keyed in. To do this, open
the Tailor | Data Entry dialog and select Continuously instead of Individually.
You’ve now completed your whistle-stop tour of Snap, and in a short time, you’ve designed and
published a survey and analyzed the results. Now you’re ready to go.
49IMPROVING RESPONSE RATES
It’s generally agreed that the advantages of web surveys are:
They can provide a faster response than more traditional methods.
They can be less expensive to administer.
They can be more attractive to complete than paper surveys.
It’s also generally agreed that the disadvantages of web surveys are:
Overall response rates are often no higher than other methods if no reminders are sent out.
The costs of design are often higher than paper based surveys because so much more can be
done with a web survey in terms of layout, colors, images etc.
Web surveys do require computer access, and although internet access is improving across all
nations, there can still be disadvantaged groups who might be excluded by using surveys only
available on the web.
For many years, the cynics of online surveys always quoted low response rates as a reason for
remaining with the more traditional methods of paper and telephone surveys. However, these
comparisons were often made between paper or telephone with reminders against online surveys
without reminders. When reminders were incorporated into online surveys, very similar response
rates to paper or telephone were achieved. With online reminders becoming increasingly
automated, online response rates will increasingly be comparable with the more conventional
techniques.
There are a number of techniques for improving response rates. They include:
Reminders
Incentives
Improving the online experience
Reminders
Online reminders are available as an option with Snap WebHost but it is highly recommended that
the feature is always used and used regularly. There is no point in launching the survey and then
simply issuing a reminder after one month. It is important to plan out regular reminders and to
ensure that the message is varied – not just a one sentence reminder but one that stresses the
importance of completing the questionnaire and the benefits from doing so. As the project reaches
the closing date, the message should become increasingly stronger, but stop short of begging!!
Incentives
Incentives are a tried and tested method of increasing response rates within commercial market
research. If it is appropriate and legal to do so, you can use them in web surveys in both the private
and public sectors. Many incentives can be very cost effective, and may be as simple as a Prize
Draw. The prize might be a discount on products and services offered by your organization.
Alternatively it might be a “desirable” product such as an Apple iPod or a memory stick. Make sure
that the prizes will work in other countries if the survey is international, and that they're not too
expensive to deliver by mail or courier.
50Improving the online experience
When researchers design paper questionnaires, they usually take great care to ensure that they are
inviting to complete. Perhaps it is the cost of printing and reprinting that motivates researchers
into “getting it right”.
We’ve all been faced with online surveys that have been poorly designed. We may put it down to
the fact that they’ve been designed by non-researchers, but it’s often the case that too little design
thought has been given. Perhaps it’s the thought that it can always be changed if it’s wrong or not
clear. This is no defense. More care should be taken to design online questionnaires. All too often,
there are no explanations on how and why to complete the questions. Make sure you allow
yourself enough design time to consider layout, colors and images, and ensure that online surveys
are easy to complete.
51You can also read