Classifying Math Knowledge Components via Task-Adaptive Pre-Trained BERT
←
→
Page content transcription
If your browser does not render page correctly, please read the page content below
Classifying Math Knowledge Components via
                                                   Task-Adaptive Pre-Trained BERT

                                             Jia Tracy Shen1 , Michiharu Yamashita1 , Ethan Prihar2 , Neil Heffernan2 ,
                                                         Xintao Wu3 , Sean McGrew4 , and Dongwon Lee1
                                                         1
                                                           Penn State University, University Park, PA 16802, USA
arXiv:2105.11343v1 [cs.CL] 24 May 2021

                                                                             jqs5443@psu.edu
                                                     2
                                                         Worcester Polytechnic Institute, Worcester, MA 01609, USA
                                                                           ebprihar@gmail.com
                                                          3
                                                            University of Arkansas, Fayetteville, AR 72701, USA
                                                                            xintaowu@uark.edu
                                                                  4
                                                                    K12.com, Herndon, VA 20170, USA
                                                                             smcgrew@k12.com

                                                 Abstract. Educational content labeled with proper knowledge compo-
                                                 nents (KCs) are particularly useful to teachers or content organizers.
                                                 However, manually labeling educational content is labor intensive and
                                                 error-prone. To address this challenge, prior research proposed machine
                                                 learning based solutions to auto-label educational content with limited
                                                 success. In this work, we significantly improve prior research by (1) ex-
                                                 panding the input types to include KC descriptions, instructional video
                                                 titles, and problem descriptions (i.e., three types of prediction task),
                                                 (2) doubling the granularity of the prediction from 198 to 385 KC la-
                                                 bels (i.e., more practical setting but much harder multinomial classifica-
                                                 tion problem), (3) improving the prediction accuracies by 0.5-2.3% using
                                                 Task-adaptive Pre-trained BERT, outperforming six baselines, and (4)
                                                 proposing a simple evaluation measure by which we can recover 56-73%
                                                 of mispredicted KC labels. All codes and data sets in the experiments
                                                 are available at: https://github.com/tbs17/TAPT-BERT

                                                 Keywords: BERT · Knowledge Component · Text Classification · NLP

                                         1     Introduction
                                         In the math education community, teachers, Intelligent Tutoring Systems (ITSs)
                                         and Learning Management Systems (LMSs) have long focused on bringing learn-
                                         ers to the target mastery over a set of skills, also known as Knowledge Com-
                                         ponents (KCs). Common Core State Standards (CCSS)5 is one of the most
                                         common categorizations of knowledge components skills in mathematics from
                                         kindergarten to high school in the United States with a full set of 385 KCs. For
                                         example, in the CCSS code 7.NS.A.1, 7 stands for 7-th grade, NS stands for
                                         the domain Number system, A.1 stands for the standard number of the code [5].
                                         5
                                             www.corestandards.org
2 J. Shen et al.
Table 1: Examples of three data types, all having the KC label “8.EE.A.1”
Data Type Text
Know and apply the properties of integer
Description Text
exponents to generate equivalent numerical expressions
Apply properties of integer exponents to generate
Video Title
equivalent numerical expressions
Simplify the expression: (z2)2 *Put parentheses around
Problem Text
the power if next to coefficient, for example: 3x2=3(x2 ),x5=x5
In the process of using KCs, the aforementioned stakeholders often encounter
the challenges in three scenarios: (1) teachers need to know what KCs a stu-
dent is unable to master by describing the code content (S1 ), (2) ITSs need to
tag instructional videos with KCs for better content management (S2 ), and (3)
LMSs need to know what KCs a problem is associated with in recommending
instructional videos to aid problem solving (S3 ).
The solutions to these scenarios typically framed the problem as the multi-
nominal classification–i.e., given the input text, predicts one most relevant KC
label out of many KCs: I(nput) 7→ text and O(utput) 7→ KC. Prior research so-
lutions included SVM-based [12], Non-negative Matrix Factorization (NMF) [6],
Skip-gram Representation [17], Neural Network [18] or even cognitively-based
knowledge representation [20]. Existing solutions, however, used relatively small
number of labels (e.g., 39 or 198) from CCSS with the input of problem text
only (similar to Table 1-Row 3) [17,12,18].
Toward this challenge, in this work, we significantly improve existing meth-
ods in auto-labeling educational content. First, based on three scenarios of S1 ,
S2 , and S3 , we consider three types of input, including KC descriptions, instruc-
tional video titles, and problem text (as shown in Table 1). Second, we solve the
multinomial classification problem with 385 KC labels (instead of 198). Note
that the problem becomes much harder. Third, we adopt the Task-adpative Pre-
trained (TAPT) BERT [9] in solving the multinomial classification problem.
Our solution outperforms six baselines, including three classical machine learn-
ing (ML) methods and two prior approaches, improving the prediction accuracies
by 0.5-2.3% for the tasks of S1 , S2 , and S3 , respectively. Finally, we propose a
new evaluation measure, TEXSTR, that enables 56-69% more KC labels to be
correctly predicted than using the classical measure of accuracy.
2 Related Work
KC Models. Rose et al. [20] is one of the earliest work predicting knowledge
components, which took a cognitively-based knowledge representation approach.
The scale of KCs it examined was small with only 39 KCs. Later research ex-
tended the scale of KCs using a variety of techniques. For example, Desmariais
[6] used non-negative matrix factorization to induce Q-matrix [3] from simulated
data and obtained an accuracy of 75%. The approach did not hold when applying
to real data and only got an accuracy of 35%. The two aforementioned studiesClassifying Math KCs via Task-Adaptive Pre-Trained BERT 3
shared the same drawback: not using the texts from the problems. Karlovcec et
al. [12] used problem text data from the ASSISTments platform [10] and created
a 106-KC model using 5-fold cross validation via ML approach SVM, achieving
top 1 accuracy of 62.1% and top 5 accuracy of 84.2%. Pardos et al. [17] predicted
for 198 labels and achieved 90% accuracy via Skip-gram word embeddings of
problem id per user (no problem text used). However, Patikorn et al. [18] did
a generalizability study of Pardos et al. [17]’s work and only achieved 13.67%
accuracy on a new dataset. They found that was because Pardos et al. [17]’s
model was over-fitting due to memorizing the question templates and HTML
formatting as opposed to encoding the real features of the data. Hence, Patikorn
et al. [18] removed all the templates and HTML formatting and proposed a new
model using Multi-Layer-Perceptron algorithm, which achieved 63.80% testing
accuracy and 22.47% on a new dataset. The model of Patikon et al. [18] became
the highest performance for the type of problem text. The preceding research is
only focused on problem related content (ID or texts) whereas our work uses not
only the problem text but also the KC descriptions and video title data covering
a broad range of data.
Pre-Trained BERT Models. The state-of-the-art language model BERT (Bidi-
rectional Encoder Representations From Transformer) [7] is a pre-trained lan-
guage representation model that was trained on 16 GB of unlabeled texts in-
cluding Books Corpus and Wikipedia with a total of 3.3 billion words and a
vocabulary size of 30,522. Its advantage over other pre-trained language mod-
els such as ELMo [19] and ULMFiT [11] is its bidirectional structure by using
the masked language model (MLM) pre-training objective. The MLM randomly
masks 15% of the tokens from the input to predict the original vocabulary id of
the masked word based on its context from both directions [7]. The pre-trained
model then can be used to train from new data for tasks such as text classifica-
tion, next sentence prediction.
Users can also further pre-train BERT model with their own data and then
fine-tune. This combining process has become popular in the past two years as it
can usually achieve better results than fine-tuning only strategy. Sun et al. [21]
proposed a detailed process on how to further pre-train new texts and fine-tune
for classification task, achieving a new record accuracy. Models such as FinBERT
[16], ClinicalBERT [1], BioBERT [15], SCIBERT [2], and E-BERT [23] that were
further pre-trained on huge domain corpora (e.g.billions of news articles, clinical
texts or PMC Full-text and abstracts) were referred as Domain-adaptive Pre-
trained (DAPT) BERT and models further pre-trained on task-specific data are
referred as Task-adaptive Pre-trained (TAPT) BERT by Gururangan et al. [9]
such as MelBERT [4] (Methaphor Detection BERT). Although DAPT models
usually achieve better performance (1-8% higher), TAPT models also demon-
strated competitive and sometimes even higher performance (2% higher) ac-
cording to Gururangan et al. [9]. In Liu et al. [16], FinBERT-task was 0.04%
higher than domain FinBERT in accuracy. In addition, TAPT requires less time
and resource to train. In light of this finding, we use the task-specific data to
further pre-train the BERT model.4 J. Shen et al.
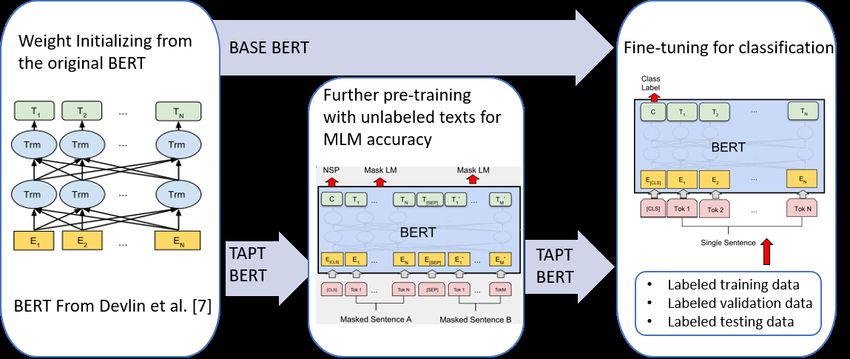
Fig. 1: An illustration of training and fine-tuning process of BASE vs. TAPT
3 The Proposed Approach
To improve upon existing solutions to the problem of auto-labeling educational
content, we propose to exploit recent advancements by BERT language models.
Since BERT can encode both linguistic structures and semantic contexts in
texts well, we hypothesize its effectiveness in solving the KC labeling problem.
By effectively labeling the KCs, we expect to solve the challenges incurred from
three scenarios in Section 1.
3.1 Task-Adpative Pre-Trained (TAPT) BERT
In particular, we propose to adopt the Task-adaptive Pre-trained (TAPT) BERT
and fine-tune it for three types of data. The “pre-training” process is unsu-
pervised such that unlabeled task-specific texts get trained for MLM objective
whereas the “fine-tuning” process is supervised such that labeled task-specific
texts get trained for classification (see Fig. 1). We call a BERT model that only
has a fine-tuning process as BASE. For TAPT, we first initialize the weights
from the original BERT (i.e., BERT-base-uncased model). Then, we further pre-
train the weights using the unlabeled task-specific texts as well as the combined
task texts (see detail in Section 4.1) for MLM objective, a process of randomly
masking off 15% of the tokens and predict their original vocabulary IDs. The
pre-training performance is measured by the accuracy of MLM. Once TAPT
is trained, we fine-tune TAPT with the task-specific labeled texts by splitting
them into training, validation and testing datasets and feed them into the last
softmax layer for classification. We measure the performance of fine-tuning via
the testing data accuracy. For BASE, we do not further train it after initializing
the weights but directly fine-tune it with the task-specific data for classification
(see Fig. 1). To show the effectiveness of the TAPT BERT approach, we compare
it against six baselines including BASE BERT for three tasks:
– Td : to predict K-12 KCs using dataset Dd (description text) based on S1
– Tt : to predict K-12 KCs using dataset Dt (video title text) based on S2
– Tp : to predict K-12 KCs using dataset Dp (problem text) based on S3Classifying Math KCs via Task-Adaptive Pre-Trained BERT 5
Fig. 2: An illustration of multiple possibilities of a correct label for a given video
title text
3.2 Evaluating KC Labeling Problem Better: TEXSTR
In the regular setting of multinomial classification to predict KC labels, the
evaluation is done as binary–i.e., exact-match or non-match. For instance, if
a method predicts a KC label to be 7.G.B.6, but its ground truth is 7.G.A.5,
7.G.B.6 is considered to be a non-match. However, the incorrectly predicted label
of 7.G.B.6 could be closely related to 7.G.A.5 and thus still be useful to teachers
or content organizers. For example, in Fig. 2, the input to the classification prob-
lem is a video title “Sal explains how to find the volume of a rectangular prism
fish tank that has fractional side lengths.” Its ground truth label is 7.G.B.6 (7-th
grade geometry KC), described as “Solve real world problem involving ... volume
... composed of ... prisms.” When one looks at three non-match labels, however,
their descriptions do not seem to be so different (see in Fig. 2). That is, all of the
three non-match labels (6.G.A.2, 5.MD.C.5, and 5.MD.C.3 ) mention “volume
solving” through “fine/relate/recognize with operations and concepts,” which is
quite similar to the KC description of the ground truth. However, due to the
nature of exact-match based evaluation, these three labels are considered wrong
predictions. Further, domain experts explain that some skills are prerequisites
to other skills, or that some problems have more than one applicable skills (thus
multiple labels) and they could all be correct.
Therefore, we argue that using a strict exact-matching based method in eval-
uating the quality of the predicted KC labels might be insufficient in practical
settings. We then propose a method that considers both semantic and structural
similarities among KC labels and their descriptions to be an additional measure
to evaluate the usability of the predicted labels.
– Semantic Similarity (Ct ): We adopt the Doc2Vec algorithm [14] to capture
the similarity between KC labels. Doc2Vec, derived from word-vector algo-
rithm, generates similarity scores between documents instead of words and6 J. Shen et al.
is proved to have lower error rate (7.7-16%) than the word vector approach
[14].
– Structural Similarity (Cs ): We exploit prerequisite relationships among skills
(KC labels) and capture such as edges and KC labels as nodes in a graph.
The prerequisite relationships are extracted from a K-G8 math coherence
map by Jason Zimba [24] and a high school (G9-G12) coherence map by
UnboundEd Standard Institue [22]. Then, we adopt Node2Vec algorithm [8]
that is efficient and flexible in exploring nodes similarity and achieved a new
record performance in network classification problem [8].
In the end, we craft a new evaluation measure, named as TEXSTR (Λ), by
combining both Ct and Cs as follows: Λ = α · Ct + (1 − α) · Cs , where α controls
the weight between Ct and Cs as an oscillating parameter.
4 Empirical Validation
4.1 Datasets and Evaluation Measure
Table 2 summarizes the details of the datasets for pre-training and fine-tuning
processes. Dd contains 6,384 description texts (84,017 tokens) and 385 math
KCs (an example shown in Fig. 1-a). Part of Dd are extracted from Common
Core Standards website6 and part are provided by k12.com7 , an education man-
agement organization that provides online education to American students from
kindergarten to Grade 12. Dt contains 6,748 video title texts (62,135 tokens) and
272 math KCs (an example shown in Fig. 1-b) Part of Dt are extracted from
Youtube.com (via youtube DataAPI8 ) and part are provided by k12.com. Dp
contains 13,722 texts (589,549 tokens) and 213 math KCs provided by ASSIST-
ments9 (an example shown in Fig. 1-c). Further, Dd+t , Dd+p , Dt+p , and Dall
are different combinations of the unlabeled texts from Dd , Dt , and Dp . They are
only used in the TAPT pre-training process. We pre-process all aforementioned
texts by removing all the templates and HTML markups to avoid over-fitting,
suggested by the prior highest accuracy method [18]. In the TAPT pre-training
process, 100% of the unlabeled texts from the aforementioned datasets are used
for pre-training. In fine-tuning process for both TAPT and BASE , only Dd , Dt ,
and Dp are used and 72% of their texts and labels are used for training, 8% are
for validation and 20% are for testing (see in Table 2 Row 1-3 and Col. 6-8).
As an evaluation measure, following prior research [18,17,20,6,12] for direct
comparison, we use Accuracy@k as (TP + TN)/(TP + TN + FP + FN), when
a method predicts top-k KC labels. Further, we evaluate our method using the
proposed TEXSTR measure.
6
http://www.corestandards.org/math
7
http://www.k12.com
8
http://developers.google.com/youtube/v3
9
http://www.assistments.org/Classifying Math KCs via Task-Adaptive Pre-Trained BERT 7
Table 2: A summary statistics of datasets.
Fine-tuning Partition
Name # Labels # Texts # Tokens
Training (72%) Validation (8%) Testing (20%)
Dd 385 6,384 84,017 4,596 511 1,277
Dt 272 6,748 62,135 4,858 540 1,350
Dp 213 13,722 589,549 9,879 1,098 2,745
Dd+t / 13,132 146,152 / / /
Dd+p / 20,106 673,566 / / /
Dt+p / 20,470 651,684 / / /
Dall / 26,854 735,701 / / /
4.2 Pre-training and Fine-tuning Details
To further pre-train, we follow the same pre-training process of original BERT
with the same network architecture (12 layers, 768 hidden dimensions, 12 heads,
110M parameters) but on our own unlabeled task-specific texts (see Col. 4 in Ta-
ble 2). With an 8-core v3 TPU, we further train all our models with 100k steps,
achieving MLM accuracy of above 97% that lasts about 1-4 hours. We experiment
hyper-parameters such as learning rate (lr) ∈ {1e − 5, 2e − 5, 4e − 5, 5e − 5, 2e − 4},
batch size (bs) ∈ {8, 16, 32}, and max-sequence length (max-seq-len) ∈ {128, 256, 512}.
The highest MLM accuracy was achieved when lr ← 2e-5, bs ← 32, and max-seq-
len ← 128 (for Dd and Dt ) and max-seq-len ← 512 with the same lr and bs (for
Dp , Dd+p , Dt+p , Dall ). To fine-tune, we also follow the original BERT script by
splitting Dd , Dt , Dp into 72% for training, 8% for validation and 20% for testing
per task. We experiment ep ∈ {5, 10, 25} due to the small size of the data size
and retain the same hyper-parameter search for lr, bs, max-seq-len. We find that
the best testing accuracy is obtained when ep ← 25, lr ← 2e-5, bs ← 32, and
max-seq-len ← 128 for Dd , Dt whereas the best testing accuracy for Dp is ob-
tained when ep ← 25, lr ← 2e-5, bs ← 32, and max-seq-len ← 512. We find that
after ep ← 25, it is difficult to gain significant increase on the testing accuracy.
Hence, the optimal hyper-parameters while task-dependent seem to have very
minimal change across tasks. This finding is consistent with SCIBERT reported
[2].
4.3 Result #1: TAPT BERT vs. Other Approaches
Table 3 summarizes the experimental results of six baseline approaches and
TAPT for each task. For baseline methods, we group them into categories (see
in Table 3) (1) classical ML, (2) prior work, and (3) BASE BERT. By including
popular ML methods such as Random Forest and XGBoost, we aim to compare
its performance to the one from prior ML work (SVM) proposed by Karlovec et
al [12] in the literature review. As to comparing to the prior highest accuracy
method [18], we applied the same 5-fold cross-validation on our own problem
texts and obtain Acu@1 and Acu@3. Overall, we see that TAPT models out-
perform all other methods at both Acu@1 and Acu@3 across three tasks. Note
TAPT models here are simply trained on the unlabeled texts from Dd , Dt , and8 J. Shen et al.
Table 3: Accuracy comparison (best and 2nd best accuracy in blue bold and
underlined, respectively, BL† for baseline best, and * for statistical significance
with p-value < 0.001)
Dd Dt Dp
Approach Type Algorithm
Acu@1 Acu@3 Acu@1 Acu@3 Acu@1 Acu@3
SVM [12] 44.87 70.40 48.15 70.30 78.07 87.69
Classical ML XGBoost 43.07 71.34 45.33 66.15 77.63 87.94
Random Forest 49.26 78.78 49.33 74.37 78.03 88.23
Skip-Gram NN [17] 34.07 34.15 43.00 43.52 76.88 77.06
Prior Work
Sklearn M LP [18] 50.53 74.41 48.22 57.95 80.70 81.13
BASE 48.30 76.40 50.99 76.55 81.73 90.99
BERT
TAPT 50.60 79.29 52.71 78.83 82.43 92.51
|T AP T − BL†| 0.07 0.51 1.72 2.28 0.70 1.52
Improvement
|T AP T − BASE| 2.30∗ 0.51∗ 1.72∗ 2.28∗ 0.70∗ 1.52∗
Dp . Compared to the best method in baseline, TAPT has an increase of 0.70%,
1.72%, 0.07% at Acu@1 and 0.51%, 2.28%, 1.52% at Acu@3 across three tasks.
Compared to BASE, TAPT shows an increase of 2.30%, 1.72%, 0.70% at Acu@1
and 0.51%, 2.28%, 1.52% at Acu@3 across three tasks. Acu@1 and Acu@3 from
both TAPT and BASE models are the average performance over five random
seeds with significant difference (see last row in Table 3). BERT variants such
as FinBERT [16], SCIBERT [?], BioBERT [15] and E-BERT [23] were able to
achieve a 1-4% increase when further trained on much larger domain knowledge
corpus (i.e. 2-14 billion tokens). Our corpus although comparatively small with
Dd (84,017 tokens), Dt (62,135 tokens), and Dp (589,549 tokens) still result in
a decent improvement of 0.51-2.30%.
4.4 Result #2: Augmented TAPT and TAPT Generalizability
In addition to the simply trained TAPTs (referred as simple TAPT) in Table
3, we augment the pre-training data and form another four TAPTs (T AP Td+t ,
T AP Td+p , T AP Tt+p and T AP Tall ). We call them augmented TAPT. Table
4 showcases the differences in Acu@3 between simple and augmented TAPT.
For Dd , augmented T AP Td+p outperforms all simple TAPT models (Acu@3 =
79.56%) and augmented T AP Td+t achieves the second best Acu@3 (79.40%).
For Dt , all the augmented TAPT models only outperform simple T AP Tp . For
Dp , augmented T AP Tt+p outperforms all simple TAPTs with Acu@3 of 92.64%.
To sum up, augmenting the pre-training data for TAPT seems to help increase
the accuracy further.
Furthermore, we compare the generalizability of TAPT to BASE over differ-
ent datasets. We define the generalizability as task accuracy (specifically Acu@3)
that a model can obtain when applied to a different dataset. Both BASE and
TAPT are pre-trained models and obtain task accuracy via fine-tuning on a
different task data. The subscripts in Table 4 present the difference in Acu@3
between TAPT and BASE, showcasing who has stronger generalizability (− signClassifying Math KCs via Task-Adaptive Pre-Trained BERT 9
Table 4: Acu@3: BASE vs. TAPT. (best and 2nd best per row in bold and
underlined, and subscripts indicate outperformance over BASE)
Simple Augmented
Data BASE
T AP Td T AP Tt T AP Tp T AP Td+t T AP Td+p T AP Tt+p T AP Tall
Dd 76.40 79.292.89 78.782.38 77.841.44 79.403.00 79.563.16 79.012.61 79.012.61
Dt 76.55 77.851.30 78.832.28 76.30−0.25 77.561.01 77.561.01 77.701.15 77.781.23
Dp 90.99 91.220.23 91.440.45 92.511.52 92.061.07 92.501.51 92.641.65 92.351.36
indicates weak generalizability). For Dd , all simple and augmented TAPT mod-
els generalize better than BASE, especially augmented TAPTs have an average
of about 3% increase. For Dt , all TAPT models have better generalizability than
BASE with over 1% average increase except for T AP Tp . For Dp , we also see all
the TAPTs generalize better than BASE model with the augmented T AP Tt+p
having the best generalizability.
4.5 Result #3: TEXSTR Based Evaluation
Following the definition of TEXSTR (=Λ) in Section 3.2, we vary the values of
α by {0, 0.5, 1} and generate three variations of Λ for top-3 predictions. We
then decide the percentage of miss-predictions to be reconsidered based on Λ
value by three cut-off thresholds {0.5, 0.75, 0.9}. Before that, we make sure that
the predicted labels are not subsequent to the ground truth, i.e., if the ground
truth is 7.G.A.2, a predicted label such as 8.G.A.3 shall not be reconsidered
as correct because it is the skill to be learned subsequently “after” 7.G.A.2. In
such a case, we exclude predicted labels that have subsequent relations to the
ground truth and calculate Λ. Table 5 presents the percentage of miss-predictions
after removing the subsequent-relation labels by three Λ thresholds when α ∈
{0, 0.5, 1}. Across three values of α and datasets, note that 56-73% of miss-
predictions could be reconsidered as correct if Λ > 0.5, 5-53% of them could be
reconsidered if Λ > 0.75, and 0-32% could be reconsidered if Λ > 0.9. The wide
percentage range for Λ ∈ {0.75, 0.9} infers that higher thresholds of Λ are more
sensitive to the change of α.
To further ensure the TEXSTR measure to be useful in practice, we conduct
an empirical study where eight experienced K-12 math teachers rate each pair
of top-3 KC labels and the corresponding text (e.g., description, video title, or
problem text) on a scale of 1 to 5. The Fleiss’ kappa value to assess the multi-
rater agreement among eight teachers is 0.436, which is considered as moderate
agreement by Landis et al. [13]. We ensure that none of top-3 miss-predicted KCs
are subsequent to ground truths and have Λ score at least 0.5. Then, we quantify
the relevance (Υ ) score as either Λ score (when α = 0.5) or teachers’ rating of
[1,5] range divided by 5 (to be on the same scale as TEXSTR’s [0,1]). Table
6 summarizes three varying relevance scores (Υ ∈ {0.5, 0.75, 0.9}) on the pair
of top-3 predictions and the texts. For Top-1 predictions, TEXSTR considers
all of them to have Υ > 0.5 (due to the pre-selection) and 37.93% of all have
Υ > 0.75 and 3.45% have Υ > 0.9. Teachers, on the other hand, think that10 J. Shen et al.
Table 5: % of miss-predictions recovered by TEXSTR (Λ)
Λ > 0.5 Λ > 0.75 Λ > 0.9
Data # Miss-predictions
α=0 α = 0.5 α=1 α=0 α = 0.5 α = 1 α = 0 α = 0.5 α=1
Dd 248 70.16 68.95 72.98 52.82 24.19 8.87 32.26 2.42 0.81
Dt 240 58.33 55.83 57.5 37.92 17.08 6.67 17.08 0 1.25
Dp 166 60.84 56.63 58.43 38.55 16.27 5.42 18.67 1.2 1.2
Table 6: % of top-3 predictions by relevance (Υ ) level when α = 0.5
Top 1 Top 2 Top 3
Υ
Λ Teachers ∆ Λ Teachers ∆ Λ Teachers ∆
> 0.5 100 54.31 -45.69 100 40.95 -59.05 100 21.98 -78.02
> 0.75 37.93 43.53 5.60 20.69 27.16 6.47 6.9 13.79 6.89
> 0.9 3.45 31.03 27.58 0 13.79 13.79 0 9.48 9.48
only 54.31% of the texts have Υ > 0.5 (↓ 45.69% from Λ) but 43.53% have
Υ > 0.75 (↑ 5.6% from Λ) and 31.03% have Υ > 0.9 (↑ 27.58% from Λ). We
also find a similar pattern for Top-2 and Top-3 predictions where teachers find
6.47-6.89% more cases than TEXSTR that have Υ > 0.75 and 9.48-13.79% more
cases than TEXSTR that have Υ > 0.9. This indicates that TEXSTR is more
conservative than teachers in judging the relevance of KC labels to texts when
Υ ∈ {0.75, 0.9}, suggesting TEXSTR is effective in reassessing miss-predictions
and “recover” them as correct labels in practice.
5 Conclusion
The paper classified 385 math knowledge components from kindergarten to 12th
grade using three data sources (e.g., KC descriptions, video titles, and prob-
lem texts) via the Task-adaptive Pre-trained (TAPT) BERT model. TAPT has
achieved a new record by outperforming six baselines by up to 2% at Acu@1
and up to 2.3% at Acu@3. We also compared TAPT to BASE and found the ac-
curacy of TAPT increased by 0.5-2.3% with a significant p-value. Furthermore,
the paper discovered that TAPT trained on the augmented data by combining
different task-specific texts had better Acu@3 than TAPT simply trained on the
individual datasets. In general, TAPT has better generalizability than BASE by
up to 3% at Acu@3 across different tasks. Finally, the paper proposed a new eval-
uation measure TEXSTR to reassess the predicted KCs by taking into account
semantic and structural similarity. TEXSTR was able to reconsider 56-73% of
miss-predictions as correct for practical use.
6 Acknowledgement
The work was mainly supported by NSF awards (1940236, 1940076, 1940093).
In addition, the work of Neil Heffernan was in part supported by NSF awards
(1917808, 1931523, 1917713, 1903304, 1822830, 1759229), IES (R305A170137,
R305A170243, R305A180401, R305A180401), EIR (U411B190024) and ONR
(N00014-18-1-2768) and Schmidt Futures.Classifying Math KCs via Task-Adaptive Pre-Trained BERT 11
References
1. Alsentzer, E., Murphy, J.R., Boag, W., Weng, W.H., Jin, D., Naumann, T., Mc-
dermott, M.B.A.: Publicly Available Clinical BERT Embeddings. In: Proceedings
of the 2nd Clinical Natural Language Processing Workshop. pp. 72–78 (2019),
https://www.aclweb.org/anthology/W19-1909.pdf
2. Beltagy, I., Lo, K., Cohan, A.: SCIBERT: A pretrained language model for sci-
entific text. In: Proceedings of the Conference on Empirical Methods in Natural
Language Processing and 9th International Joint Conference on Natural Language
Processing. pp. 3615–3620 (2019)
3. Birenbaum, M., Kelly, A.E., Tatsuoka, K.K.: Diagnosing Knowledge States in Alge-
bra Using the Rule-Space Model. Journal for Research in Mathematics Education
24(5), 442–459 (1993), https://www.jstor.org/stable/749153?seq=1&cid=pdf-
4. Choi, M., Lee, S., Choi, E., Park, H., Lee, J., Lee, D., Lee, J.: MelBERT : Metaphor
Detection via Contextualized Late Interaction using Metaphorical Identification
Theories. In: Proceedings of NAACL (2021)
5. corestandards.org: Coding the Common Core State Standards (CCSS). Tech. rep.,
http://www.corestandards.org/wp-content/uploads/Math_Standards.pdf
6. Desmarais, M.C.: Mapping Question Items to Skills with Non-negative Matrix Fac-
torization. ACM SIGKDD Explorations Newsletter 13(2) (2012), https://doi.
org/10.1145/2207243.2207248
7. Devlin, J., Chang, M.W., Lee, K., Toutanova, K.: BERT: Pre-training of deep
bidirectional transformers for language understanding. In: 2019 Conference of the
North American Chapter of the Association for Computational Linguistics: Human
Language Technologies. vol. 1, pp. 4171–4186 (2019)
8. Grover, A., Leskovec, J.: Node2vec: Scalable feature learning for net-
works. In: Proceedings of the ACM SIGKDD International Conference on
Knowledge Discovery and Data Mining. vol. 13-17, pp. 855–864 (2016).
https://doi.org/10.1145/2939672.2939754
9. Gururangan, S., Marasovi´cmarasovi´c, A., Swayamdipta, S., Lo, K., Beltagy, I.,
Downey, D., Smith, N.A., Allen: Don’t Stop Pretraining: Adapt Language Mod-
els to Domains and Tasks. In: Proceedings of the 58th Annual Meeting of the
Association for Computational Linguistics (2020)
10. Heffernan, N.T., Heffernan, C.L.: The ASSISTments ecosystem: Building a plat-
form that brings scientists and teachers together for minimally invasive research
on human learning and teaching. International Journal of Artificial Intelligence in
Education 24(4), 470–497 (2014). https://doi.org/10.1007/s40593-014-0024-x
11. Howard, J., Ruder, S.: Universal Language Model Fine-tuning for Text Classifica-
tion. In: Proceedings of the 56th Annual Meeting of the Association for Computa-
tional Linguistics. pp. 328–339 (2018)
12. Karlovčec, M., Córdova-Sánchez, M., Pardos, Z.A.: Knowledge component sug-
gestion for untagged content in an intelligent tutoring system. Lecture Notes in
Computer Science (including subseries Lecture Notes in Artificial Intelligence and
Lecture Notes in Bioinformatics) 7315 LNCS, 195–200 (2012)
13. Landis, J.R., Koch, G.G.: The Measurement of Observer Agreement for Categorical
Data. Biometrics 33(1), 159 (1977). https://doi.org/10.2307/2529310
14. Le, Q., Mikolov, T.: Distributed Representations of Sentences and Documents. In:
Proceedings of the 31st International Conference on International Conference on
Machine Learning. pp. II–1188–II–1196 (2014)12 J. Shen et al.
15. Lee, J., Yoon, W., Kim, S., Kim, D., Kim, S., So, C.H., Kang, J.: Data
and text mining BioBERT: a pre-trained biomedical language representa-
tion model for biomedical text mining. Bioinformatics p. 1234–1240 (2020).
https://doi.org/10.1093/bioinformatics/btz682
16. Liu, Z., Huang, D., Huang, K., Li, Z., Zhao, J.: FinBERT: A Pre-trained Financial
Language Representation Model for Financial Text Mining. In: Proceedings of
the Twenty-Ninth International Joint Conference on Artificial Intelligence Special
Track on AI in FinTech (2020)
17. Pardos, Z.A.: Imputing KCs with Representations of Problem Content and Con-
text. In: Proceedings of the 25th Conference on User Modeling, Adaptation and
Personalization. pp. 148–155 (2017). https://doi.org/10.1145/3079628.3079689
18. Patikorn, T., Deisadze, D., Grande, L., Yu, Z., Heffernan, N.: Generalizability of
methods for imputing mathematical skills needed to solve problems from texts.
Lecture Notes in Computer Science (including subseries Lecture Notes in Artificial
Intelligence and Lecture Notes in Bioinformatics) 11625 LNAI, 396–405 (2019)
19. Peters, M.E., Neumann, M., Gardner, M., Clark, C., Lee, K., Zettlemoyer, L.:
Deep contextualized word representations. In: Proceedings of NAACL-HLT. pp.
2227–2237 (2018)
20. Rosé, C., Donmez, P., Gweon, G., Knight, A., Junker, B., Cohen, W., Koedinger,
K., Heffernan, N.: Automatic and Semi-Automatic Skill Coding With a View To-
wards Supporting On-Line Assessment. In: Proceedings of the conference on Arti-
ficial Intelligence in Education. pp. 571–578 (2005)
21. Sun, C., Qiu, X., Xu, Y., Huang, X.: How to Fine-Tune BERT for Text Classi-
fication? Lecture Notes in Computer Science (including subseries Lecture Notes
in Artificial Intelligence and Lecture Notes in Bioinformatics) 11856 LNAI(2),
194–206 (2019)
22. UnboundEd: A “ Coherence Map ” for the High School Standards. Tech. rep.
(2017), https://www.unbounded.org/other/8610
23. Zhang, D., Yuan, Z., Liu, Y., Fu, Z., Zhuang, F., Wang, P., Xiong, H.: E-BERT:
Adapting BERT to E-commerce with Adaptive Hybrid Masking and Neighbor
Product Reconstruction (2020)
24. Zimba, J.: A Graph of the Content Standards. Tech. rep. (2012), https://
achievethecore.org/page/844/a-graph-of-the-content-standardsYou can also read