Analysis of Body Movement Patterns and Subjective Discomfort Ratings in Long-Duration Sitting - Matthew P. Reed Sheila M. Ebert B-K Daniel Park ...
←
→
Page content transcription
If your browser does not render page correctly, please read the page content below
Analysis of Body Movement Patterns and
Subjective Discomfort Ratings in Long-Duration Sitting

                      Matthew P. Reed
                       Sheila M. Ebert
                       B-K Daniel Park
                      Monica L.H. Jones

    University of Michigan Transportation Research Institute

                         Final Report

                         January 2020
Technical Report Documentation Page
 1. Report No.                                 2. Government Accession No.                         3. Recipient's Catalog No.
 UMTRI-2020-1
Analysis of Body Movement Patterns and                                                            5. Report Date

Subjective Discomfort Ratings in Long-Duration Sitting
                                                                                                  6. Performing Organization Code

7. Author(s)                                                                                      8. Performing Organization Report No.
Reed, M.P., Ebert, S.M., Park, B-K D., and Jones, M.L.H.
9. Performing Organization Name and Address                                                       10. Work Unit No. (TRAIS)
University of Michigan Transportation Research Institute
2901 Baxter Road                                                                                  11. Contract or Grant No.
Ann Arbor MI 48109
12. Sponsoring Agency Name and Address                                                            13. Type of Report and Period Covered

Magna Seating
                                                                                                  14. Sponsoring Agency Code

15. Supplementary Notes

16. Abstract

A laboratory study was conducted to evaluate the hypothesis that discomfort in long-duration sitting is associated with more-
frequent posture changes. Two nominally identical production automobile driver seats were obtained for testing and one was
modified in ways that were expected to increase discomfort. Twenty-four men and women with a wide range of age and
body size sat in each of the seats for one hour on two different days while watching videos and completing a discomfort
questionnaire every five minutes. Posture was monitored using a video, pressure sensors in the seats, and a Microsoft Kinect
depth sensor. A variety of posture change metrics were computed from each data source. The modified seat produced
significantly higher discomfort ratings. However, no difference in movement frequency was observed between the seats, and
no relationship between maximum discomfort and movement frequency was observed.

17. Key Words                                                                 18. Distribution Statement
Vehicle seating, comfort, posture, movement

 19. Security Classif. (of this report)             20. Security Classif. (of this page)                   21. No. of Pages     22. Price
                                                                                                                      31

Form DOT F 1700.7 (8-72)                  Reproduction of completed page authorized

                                                                          i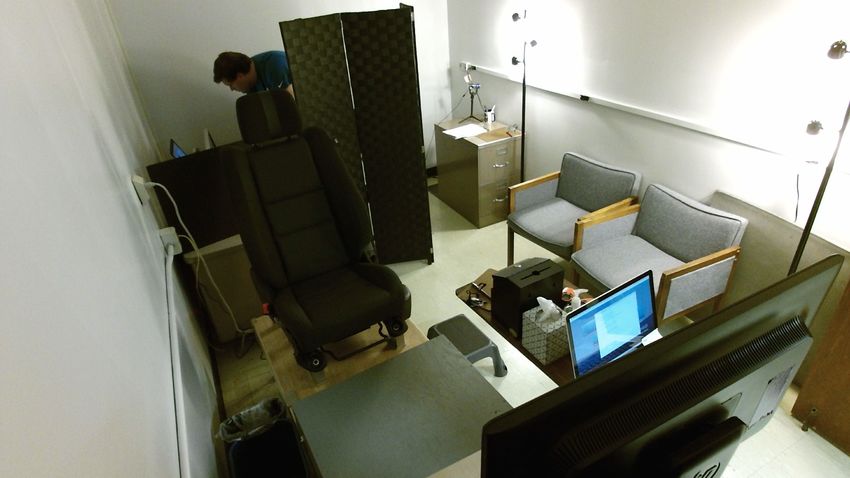
Metric Conversion Chart
                                 APPROXIMATE CONVERSIONS TO SI UNITS
SYMBOL                       WHEN YOU KNOW     MULTIPLY         TO FIND                                       SYMBOL
                                                  BY
                                                        LENGTH
    In               inches                              25.4                 millimeters                  mm
    Ft               feet                                0.305                meters                       m
    Yd               yards                               0.914                meters                       m
    Mi               miles                               1.61                 kilometers                   km
                                                         AREA
      2
    in               squareinches       645.2                   square millimeters                         mm2
    ft2              squarefeet         0.093                   square meters                              m2
    yd2              square yard        0.836                   square meters                              m2
    Ac               acres              0.405                   hectares                                   ha
    mi2              square miles       2.59                    square kilometers                          km2
                                                        VOLUME
             fl oz                  fluid 29.57                      milliliters             mL
                                    ounces
                gal                 gallons 3.785                    liters                  L
                    3
                ft                  cubic      0.028                 cubic meters            m3
                                    feet
             yd3                    cubic      0.765                 cubic meters            m3
                                    yards
NOTE: volumes greater than 1000 L shall be shown in m3
                                                         MASS
             oz                    ounces       28.35                           grams         g
             lb                    pounds       0.454                           kilograms     kg
                T                  short tons 0.907                             megagrams Mg (or "t")
                                   (2000 lb)                                    (or "metric
                                                                                ton")
                                             TEMPERATURE (exact degrees)
            o                                                                                     o
                F                 Fahrenheit            5 (F-32)/9             Celsius                C
                                                        or (F-32)/1.8
                                            FORCE and PRESSURE or STRESS
           lbf                 poundforce        4.45                                       newtons       N
                     2
          lbf/in               poundforce        6.89                                       kilopascals   kPa
                               per square
                               inch

                                                            2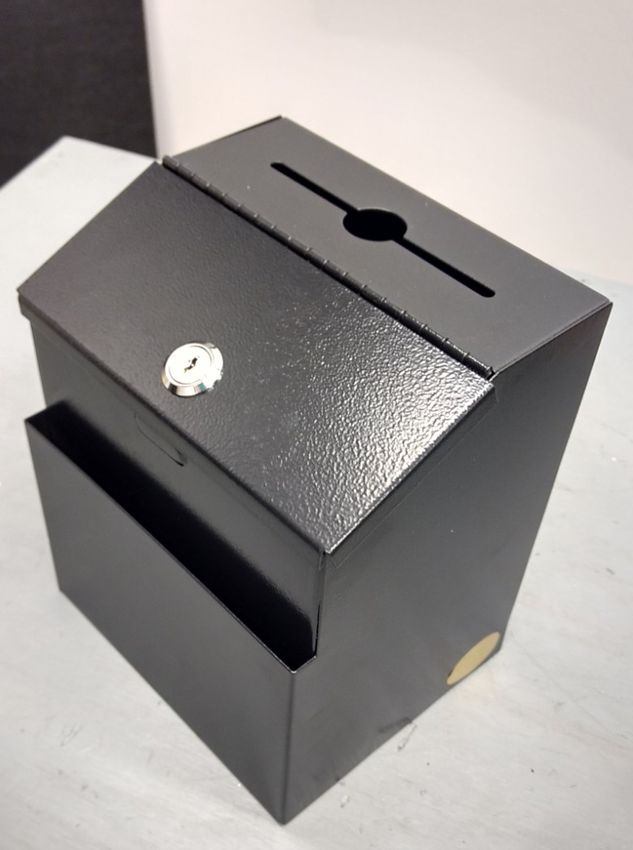
LENGTH
          mm                 millimeters              0.039                 inches in
              m              meters                   3.28                  feet       ft
              m              meters                   1.09                  yards yd
          km                 kilometers               0.621                 miles mi
                                                         AREA
               2
      mm                square                0.0016                       square       in2
                        millimeters                                        inches
          m2            square meters         10.764                       square       ft2
                                                                           feet
          m2            square meters         1.195                        square       yd2
                                                                           yards
          ha            hectares              2.47                         acres        ac
               2
      km                square kilometers 0.386                            square       mi2
                                                                           miles
                                                       VOLUME
     mL             milliliters                      0.034          fluid ounces            fl oz
      L             liters                           0.264          gallons                 gal
          3
     m              cubic meters                     35.314         cubic feet              ft3
     m3             cubic meters                     1.307          cubic yards             yd3
                                                         MASS
          g            grams                   0.035                      ounces              oz
       kg              kilograms               2.202                      pounds              lb
  Mg (or "t")          megagrams (or           1.103                      short tons          T
                       "metric ton")                                      (2000 lb)
                                           TEMPERATURE (exact degrees)
      o                                                                                           o
          C          Celsius                     1.8C+32             Fahrenheit                       F
                                          FORCE and PRESSURE or STRESS
     N             Newtons                      0.225                    poundforce                   lbf
    kPa            Kilopascals                  0.145                    poundforce per               lbf/in2
                                                                         square inch

*SI is the symbol for the International System of Units. Appropriate rounding should be
made to comply with Section 4 of ASTM E380.
(Revised March 2003)

                                                              3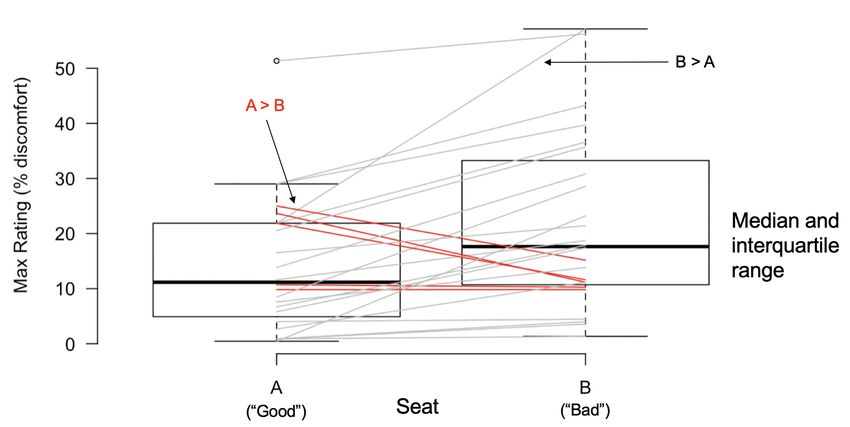
ACKNOWLEDGMENTS

This research was funded by Magna Seating. The authors acknowledge the strong support from
Alison Smith, Bruno Carraro, John Oilar, Hanlong Yang, Patty White, and Ron Zarowitz.

                                             4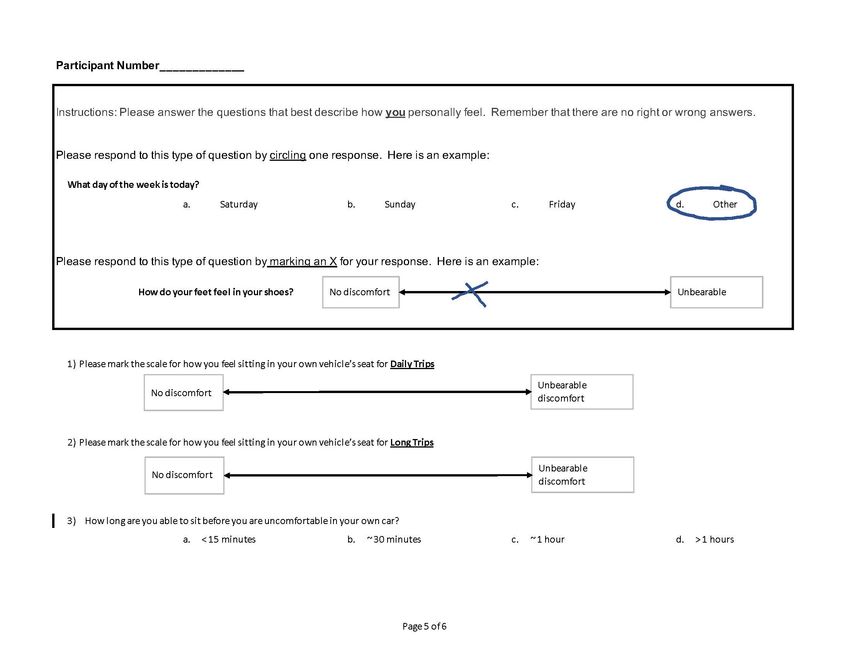
CONTENTS

ACKNOWLEDGMENTS ...................................................................................................4

ABSTRACT.........................................................................................................................6

INTRODUCTION ...............................................................................................................7

METHODS ..........................................................................................................................8

RESULTS ..........................................................................................................................16

DISCUSSION ....................................................................................................................24

APPENDIX A. Scripts and Investigator Instructions ........................................................25

APPENDIX B. Seat Questionnaire ....................................................................................27

APPENDIX C. Exit Questionnaire ....................................................................................30

                                                                      5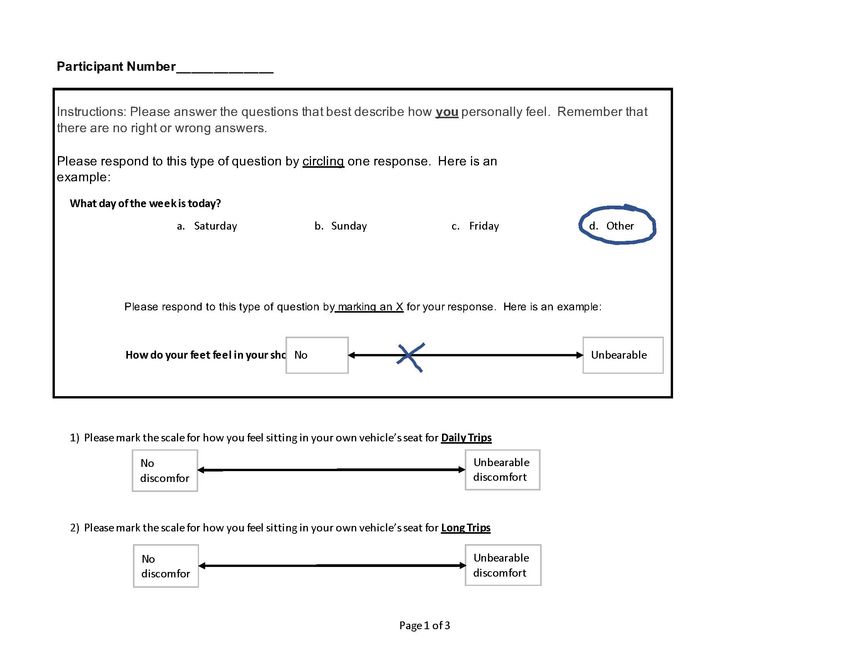
ABSTRACT

A laboratory study was conducted to evaluate the hypothesis that discomfort in long-duration
sitting is associated with more-frequent posture changes. Two nominally identical production
automobile driver seats were obtained for testing and one was modified in ways that were
expected to increase discomfort. Twenty-four men and women with a wide range of age and
body size sat in each of the seats for one hour on two different days while watching videos and
completing a discomfort questionnaire every five minutes. Posture was monitored using a video,
pressure sensors in the seats, and a Microsoft Kinect depth sensor. A variety of posture change
metrics were computed from each data source. The modified seat produced significantly higher
discomfort ratings. However, no difference in movement frequency was observed between the
seats, and no relationship between maximum discomfort and movement frequency was observed.

                                               6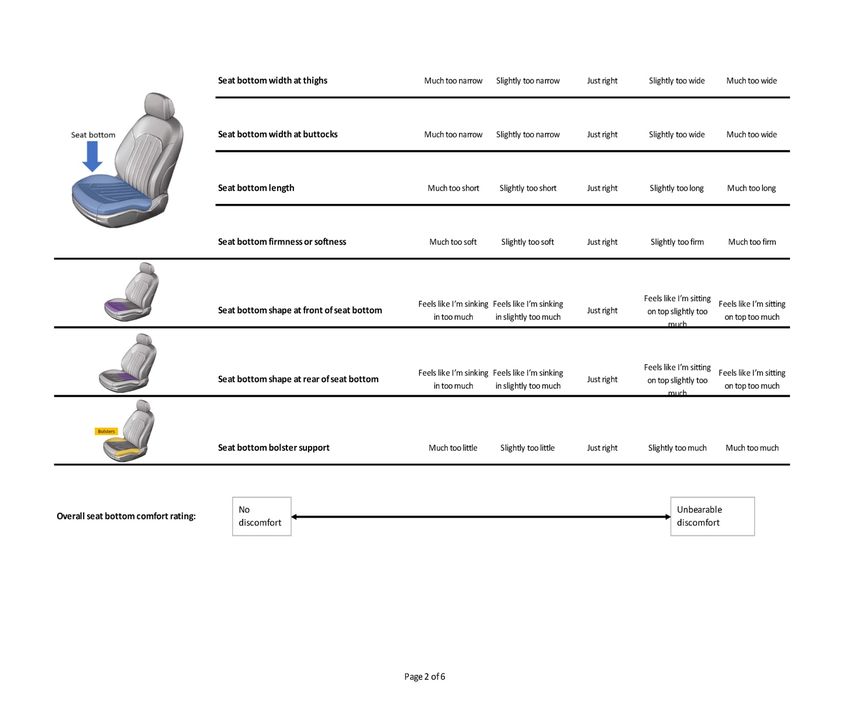
INTRODUCTION

The standard method of measuring discomfort in seating remains the subjective questionnaire in
spite of decades of effort to identify objective measures that are strongly associated with
discomfort. Subjective assessments are the most direct way to measure discomfort, since the
phenomenon is inherently subjective, but asking a study participant to provide subjective
responses necessarily changes the sitting experience. Consequently, a less-intrusive measurement
that could reliably predict subjective discomfort ratings would be valuable.

Posture change has been proposed as a measure of discomfort. Specifically, an increased number
of posture changes may be an indication of increased discomfort. This potential measure has not
been studied extensively due to the difficulty in measuring posture, particularly in automotive
settings. Most posture measurement methods have required attaching sensors or markers to the
sitter’s body, which could be more intrusive than subjective assessments. However, newer
sensing technologies have made markerless, unobtrusive posture measurement feasible.

The current study used three methods to monitor posture changes during one-hour laboratory
seating sessions. In sessions on separate days, participants sat in each of two identical-appearing
seats, one of which had been modified to make it less comfortable. The participants rated their
discomfort every five minutes using a standard visual analog scale, and their postures were
monitored using video, pressure measurements on the seat cushion, and depth data from a
Microsoft Kinect sensor. The data were analyzed to determine if the subjective responses were
correlated with posture-change metrics.

                                                 7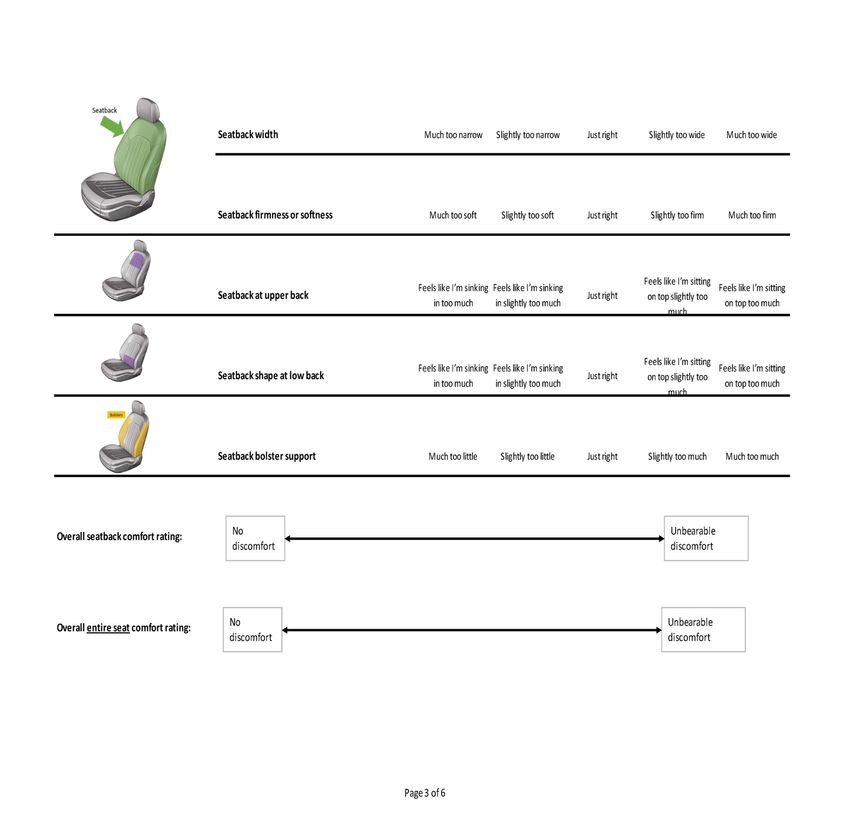
METHODS
Seats and Mockup
Two visually identical seats were provided by Magna for this study. One seat (B) was modified
in ways that were intended to make the seat uncomfortable. Among other changes, the padding
in the seat cushion was stiffened and the lumbar support removed. The SAE J826 H-point
manikin was used to establish the H-point of each seat. The seat travel, pan angle, and head
restraint adjustments were then locked so that the seat height (H30) was 270 mm, the seat pan
was at 14.5 degrees (A27), and the head restraint was at its lowest and least prominent setting.
Figure 1 show the seats mounted to wooden platforms that could be locked onto the mockup test
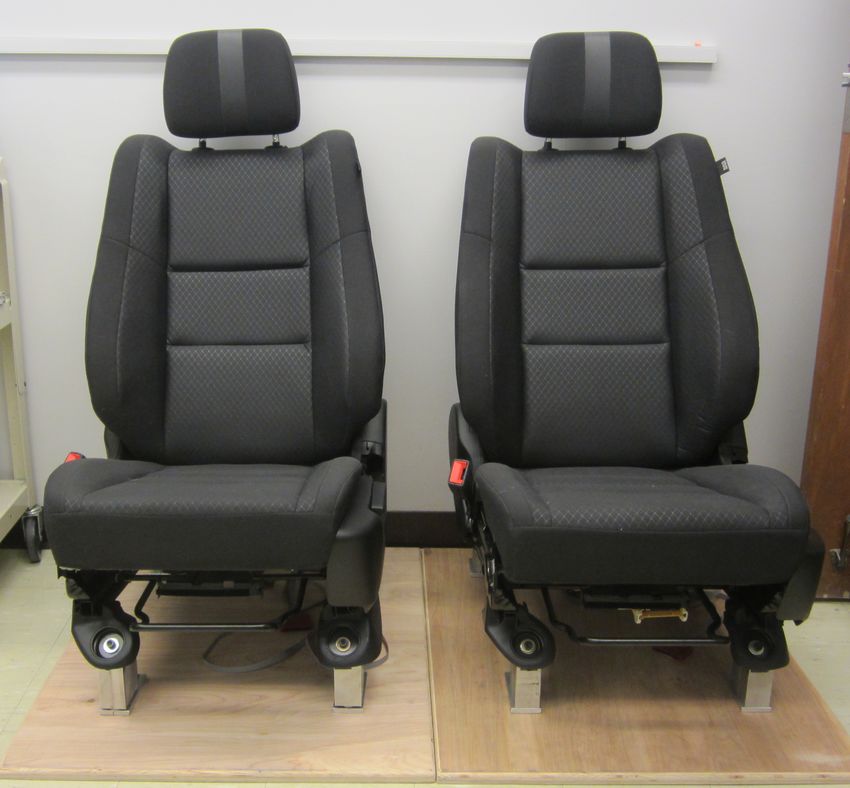
fixture, ensuring they were consistently positioned. The mockup was a platform with a 27” video
screen placed 1600 mm in front of and 650 mm above the of seat H-point (Figure 2).
Figure 1. The standard Seat A and modified softness Seat B from left to right; photo of Seat B showing modified
foam areas (dark).
Figure 2. Seat B on mockup platform and the monitor used as a video screen.
8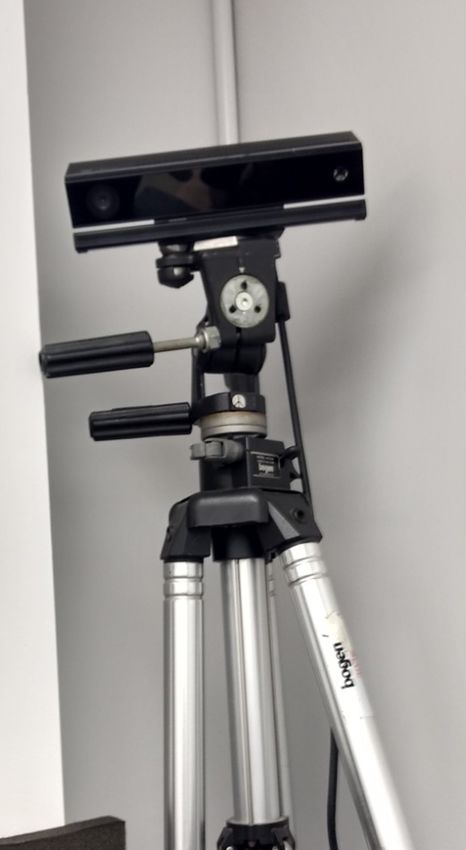
Instrumentation

A Microsoft Kinect version 2 sensor was mounted on a tripod in front of the vehicle mockup.
The Kinect sensor provides 512 x 424-pixel 3D point-cloud data and 1920 x 1080-pixel video
data which was recorded at 10 Hz. Figure 3 shows the Kinect and its color video field of view.

                  Figure 3. Kinect (left) and Kinect field of view showing laboratory setup

Each seat was instrumented with 48 pressure sensors (8 rows by 6 columns) placed in the seat
cushion below the trim. The pressure sensor data were recorded during each trial at 10 Hz and
synchronized with the Kinect data recording. An initial frame was recorded with the seat empty
prior to the trial; the pressure values from this “zero” frame were subtracted from the subsequent
frames prior to analysis.

Participants

Twenty-four participants, 12 men and 12 women, were recruited for this study. They ranged in
age from 20 to 74 years, in stature from 1565 mm to 1879, and 30% of them had a body mass
index (BMI) over 30 kg/m2. Table 1 summarizes the participant age and anthropometry.
Figure 4 shows weight and stature distribution by gender.
                                                     Table 1
                                             Participant Description

                               Measure                     Mean        SD     Min     Max
                 Age (yr)                                   31         14     20       74
                 Stature with shoes (mm)                   1702        88     1565    1879
                 Stature without shoes (mm)                1682        83     1558    1835
                 Weight (kg)                               76.1        19.6   45.0    122.2
                 Erect Sitting Height (mm)                 883         42     804     965
                 Buttock-Popliteal Length (mm)             492         33     446     566
                 BMI (kg/m2)                               26.7        6.1    18.1    39.8

                                                       9
Figure 4. Weight versus stature for study participants.
Protocol
The study protocol was approved by an institutional review board for human-subject research at
the University of Michigan (HUM00161389). Volunteers participated in two test sessions that
were scheduled to be two or three days apart. The participants were asked to wear the same shoes
and the same or similar clothes for the two sessions. The protocol was the same for both
sessions, except during the first session the anthropometric measures in Table 1 were recorded,
and at end of the second session an additional exit questionnaire was administered (Appendix C).
Each participant experienced each seat on a different day, and the order of presentation of seats
was randomized across participants. Participants were not told of any differences between test
conditions. The seat was placed on the mockup before the participant arrived, and the seat back
angle was set to 23 degrees (SAE A40). The seat not being used was stored covered and out of
sight of the participant. Upon entering the laboratory, the participant was asked to sit in the seat
and adjust the recline angle until it was comfortable and then exit the seat. (See Appendix A for
the investigator scripts.) The investigator then marked the angle and covered the recline lever so
that it could not be adjusted by the participant again during the session. The seat surface without
the participant was recorded with the Kinect. While the participant was standing, the investigator
read instructions for the long duration sitting portion including how to use the discomfort
questionnaires.
The participant was then asked to sit again. A stack of identical discomfort questionnaires
(Figure 5) numbered 0 though 12 were placed on a small clipboard with a pen attached on a
rolling table next to the participant. The table was positioned so that it did not occlude the
participants in the Kinect’s field of view and so that the participants could reach the
questionnaires without moving their upper bodies but not contact the table with their legs in any
posture they might choose. On the table was a closed drop box for the completed questionnaires,
a box of facial tissues, hand sanitizer and a 2-way radio. Figure 6 shows a participant and the
10table. Immediately after sitting down, the participant was asked to mark the first questionnaire.
The investigator then started one of two randomly assigned videos, Ocean Deep or Shallow Seas,
from the Planet Earth television series, and then left the room. The participants were told they
could contact the investigator either via the 2-way radio or by knocking on the wall next to them,
as the investigator would be sitting at a desk in the lab adjacent to them. A live-feed webcam in
the back of the room allowed the investigator to monitor the participant, checking that he/she
stayed seated for the duration of the study. Participants were asked to stay seated for the entire
session and not to eat, drink or use their phone. The scripted instructions are as follows:
… we ask that you remain seated for the full testing period of one hour, unless you feel
you must get up. If you do so, please contact me and let me know that you have gotten up
and for what reason. Remember you may discontinue your participation without
affecting your pay. Also, please do not eat, drink or use your phone while sitting here.
Figure 5. Discomfort questionnaire
11webcam
clipboard
dropbox
video
screen
Figure 6. Participant in test seat
As the video played, a pop-up screen appeared over the video every 5 minutes asking them to
“Please take survey numbered [number inserted here]. Rate your level of discomfort. Place it in
the box." Figures 6 and 7 shows the box in which they inserted their completed questionnaires.
After the hour of sitting, the investigator returned and asked the participant to remain seated.
The participant was then given the questionnaire in Appendix B. If it was the second day of
testing the participant was also given the questionnaire in Appendix C.
Figure 7. Questionnaire drop box
12Data Processing
In the questionnaires in which a mark was placed upon a line, both the entire length of the line
and the distance from the left end of the line to the mark the participant placed on it were
measured using a ruler. (The line length was measured to address potential differences due to
reproduction of the questionnaires.) The discomfort rating was analyzed as the fraction of full
scale from the left side of the line (0 to 1).
Analysis of Kinect Data – Depth
Kinect data frames were extracted at 5-second intervals for analysis. To facilitate data
processing, each depth frame was masked to extract only the pixels in the area of the image
around the participant, and the resolution of each frame was reduced to 106 x 128 by averaging
blocks of pixels. A variety of metrics were computed to quantify movement during the trial.
Mean Distance – The mean pixel depth (distance from the sensor) was computed for each frame.
Most posture changes will result in a change in the mean depth.
Depth Variability – Large variation in the depth measurement for a particular pixel is indicative
of movement in that area of the frame. The standard deviation was computed for each pixel
across the duration of the trial. Figure 8 shows the pixel standard deviations for one trial,
illustrating higher variability (i.e., movement) in the areas of the head, hands, and lower
extremities. A variety of metrics were calculated from the per-pixel standard deviations: mean
standard deviation, quantiles of standard deviation, and the fraction of standard deviations larger
than several cutoffs. In general, larger variability across the trial is associated with more frequent
and larger movements.
Figure 8. Pixel depth standard deviations. Areas of yellow and red have higher variability, blue indicates low
variability (background).
13Frame-to-Frame Changes – When the participant moves, the depth readings from pixels in the
area of the movement change. A large movement is associated with changes in a large
percentage of the pixel depth data. Two thresholds determine whether a movement was judged to
occur between two frames: the marginal change in depth at a pixel and the fraction of pixels in a
frame that change by that margin. Movement thresholds of 5, 10, and 20 mm were used along
with moving-pixel fractions of 10, 15, and 25% of the region of interest around the participant.
These calculations produced a binary movement/no-movement for each frame relative to the
preceding frame at 5-second intervals. These movement indications were then summed across
the trial.
Analysis of Kinect Data – OpenPose
OpenPose is an open-source image-processing library that estimates human posture from single
images (https://github.com/CMU-Perceptual-Computing-Lab/openpose). Figure 9 shows
examples of postures obtained from applying the OpenPose software to video frames from the
Kinect sensor. The posture data consist of 15 landmarks (generally representations of joint
centers) in the 2D coordinates of the video frame. Posture change was identified by the
magnitude of change in the landmark locations (pixels) between frames sampled every five
seconds. A threshold of 200 pixels of total location change was found through visual verification
to be a good indication of a substantive posture change. The analysis was further restricted to the
lower extremities only, since arm-pose changes were not of interest and torso posture changes
were not well captured by the 2D analysis. The number of lower-extremity posture changes
exceeding the 200-pixel distance threshold were obtained for each trial. Values ranged from zero
to 75 posture changes using this metric.
Figure 9. Examples of postures obtained using OpenPose.
Analysis of Pressure Data
An initial frame of pressure data from the unoccupied seat was subtracted from all frames from
the trial to account for pressure offsets. A center of pressure (COP) was calculated relative to the
sensor grid. Figure 10 shows an example of the COP (large dot) relative to the pressure grid. The
location of the COP was tracked over time to examine posture changes. The COP shifted side-to-
side with asymmetrical changes in thigh posture and moved fore-aft when the thighs were raised
14or lowered, changing the engagement with the seat cushion. Figure 11 shows a COP trajectory
for one trial. Note that some sensors did not provide good data and were zeroed for all frames.
Comparison of the COP trajectory with the OpenPose and Kinect depth analyses indicated that a
change in the COP of 0.25 (i.e., one-quarter of the sensor pitch) was a good indication of a
posture change. Values ranged from zero to 15 posture changes. The number of movements
based on this criterion was computed for each trial.
Figure 10. Center of pressure (large dot) relative to the pressure-sensor grid (higher pressures shown as lighter
colors). Front of seat is at the bottom of the image.
Figure 11. Center-of-pressure trajectory for one trial (red line). The pressure pattern for one frame is shown for
reference. Front of seat is at the bottom of the image.
15RESULTS
Discomfort Ratings
The subjective ratings of discomfort from the questionnaires administered every five minutes
tended to increase over time. Figures 12 and 13 show the data for men and women. Six
participants were low responders, with values below 10% on at every interval. Several
participants appeared to have been unwilling to report any discomfort, attempting to mark the
left end of the scale at every interval.
Figure 12. Trends in discomfort ratings (% of full scale) over time for men. Blue is seat A, Red is seat B. Horizontal
axis is time in 5-minute increments. Plots are labeled with {sex, age, stature, BMI}.
Figure 13. Trends in discomfort ratings (% of full scale) over time for women. Blue is seat A, Red is seat B.
Horizontal axis is time in 5-minute increments. Plots are labeled with {sex, age, stature, BMI}.
Because the discomfort ratings tended to increase monotonically over time, the maximum rating
during the trial was analyzed as an aggregate measure of discomfort. Figure 14 shows the
maximum discomfort ratings for all subjects for the two seats. On average the modified seat
(Seat B) was rated as more uncomfortable (higher discomfort) but five participants produced
higher discomfort ratings on Seat A.
16Figure 14. Maximum discomfort ratings. The box plots show the median and intequartile range and the whiskers
extend to the range of the data. Lines connect each subject’s data. The four participants who rated the “good” seat as
more uncomfortable than the “bad” seat are shown in red.
Discomfort ratings were not significantly related to participant characteristics, such as stature or
body mass index. The difference in ratings between seats A and B was also not significantly
related to participant characteristics.
Trial Exit Questionnaire
Figure 15 summarizes the discomfort responses from the exit questionnaire. The seat bottom
(cushion) was perceived as being more uncomfortable in Seat B than in Seat A, but the responses
for the seat back were not meaningfully different. The overall discomfort rating was also slightly
higher in Seat B, though the variability was high and the median response was only 20% of full
scale.
Figure 15. Boxplots of subjective discomfort ratings (% of full scale) for exit questionnaire. Bold line shows
median, box shows interquartile range, whiskers cover range of data.
17Tables 2 and 3 summarize the categorical seat feature ratings from the seat questionnaire. Most
of the responses were “just right” (neutral) for most questions. Notable differences were seen in
“seat bottom shape at rear” where a larger number of participants said they “feel like they’re
sitting on top”. Consistent with those results, more participants thought the seat bottom was too
firm in Seat B. Seat back evaluations were not meaningfully different between seats except for
more ratings of “too firm”.
Table 2
Summary of Seat Bottom Responses from Seat Questionnaire
Seat A Seat B
Seat Bottom Width at Thighs
Slightly too narrow 2 2
Just Right 22 22
Seat Bottom Length
(Left Blank/Missed Question) 0 1
Slightly too short 3 2
Just Right 20 17
Slightly too long 1 4
Seat Bottom Shape at Front
Feels like I'm sinking in slightly too much 1 2
Just Right 20 17
Feels like I'm sitting on top slightly too much 3 4
Feels like I'm sitting on top too much 0 1
Seat Bottom Shape at Rear
Feels like I'm sinking in too much 1 1
Feels like I'm sinking in slightly too much 4 2
Just Right 16 9
Feels like I'm sitting on top slightly too much 3 11
Feels like I'm sitting on top too much 0 1
Seat Bottom Firmness
(Left Blank/Missed Question) 0 1
Just Right 15 9
Slightly too firm 9 8
Much too firm 0 6
18Table 3
Summary of Seat Back Responses from Seat Questionnaire
Seat A Seat B
Seat Back Bolster Support
Slightly too little 2 2
Just Right 17 15
Slightly too much 5 7
Seat Back at Upper Back
Feels like I'm sinking in slightly too much 2 1
Just Right 17 16
Feels like I'm sitting on top slightly too much 5 7
Seat Back Shape at Lower Back
Feels like I'm sinking in slightly too much 5 4
Just Right 15 18
Feels like I'm sitting on top slightly too much 3 1
Feels like I'm sitting on top too much 1 1
Seat Back Width
Slightly too narrow 2 4
Just Right 20 20
Slightly too wide 2 0
Seat Back Firmness
Just Right 20 16
Slightly too firm 4 7
Much too firm 0 1
Movement Analysis
Table 4 summarizes the mean and maximum values for each of the movement metrics along with
the definitions of each metric. The maximum number of movements identified by the count
metrics was 220. The mean values ranged from 5 to 80, depending on the thresholds used.
19Table 4
Mean and Maximum Values for Movement Metrics
Metric Mean Max Definition
MeanSD 5.6 13.7 Mean SD of depth in region of interest
SD75 4.6 15.1 75th %ile of frame SDs
SD90 18.9 49.2 90th %ile of frame SDs
SD95 34.7 74.5 95th %ile of frame SDs
SD99 68.4 137.1 99th %ile of frame SDs
Number of movements based on pixel threshold of 5 mm and
MF5.15 81.4 220
15% of pixels moving (count)
MF10.15 33.1 155 10 mm and 15% (count)
MF20.15 7.6 62 20 mm and 15% (count)
MF5.20 81.0 219 5 mm and 20% (count)
MF10.20 33.0 151 10 mm and 20% (count)
MF20.20 7.5 62 20 mm and 20% (count)
MF5.25 69.8 168 5 mm and 25% (count)
MF10.25 24.3 131 10 mm and 25% (count)
MFS20.25 4.5 46 20 mm and 25% (count)
Number of times lower extremity landmarks moved a total of
OpenPoseLX200 18.1 75
200 mm between frames (count)
Center of pressure movement between frames of 0.25*sensor
COPMovement0.25 4.4 15
spacing or more (count)
The primary analysis of interest is the examination of potential correlations between the
subjective assessment and movement data. Specifically, is the frequency of motion related to
discomfort ratings?
Because all of the candidate metrics were intended to capture the amount of movement, some
correlation among the metrics is expected. Table 5 lists correlation coefficients for some of the
candidate metrics. The whole-body metrics based on the standard deviation of depth (MeanSD,
SD75, and SD95) were well correlated with each other, as expected. The depth-based movement-
counting metrics MFN.T (where N is the distance cutoff in mm and T is the threshold for fraction
of the region-of-interest changing) were likewise well correlated among each other and fairly
well correlated (0.7 to 0.8) with the SD-based metrics. The OpenPose metric was computed only
on the lower extremity landmark locations, and hence was less correlated with the depth-based
metrics (0.35 to 0.59). The COP-movement metric was at best weakly correlated with the depth-
based metrics, but fairly well correlated (0.62) with the OpenPoseLX metric, consistent with the
expectation that most of the changes in COP would be driven by lower-extremity posture
changes.
20Table 5
Correlation Coefficients (Pearson’s r) Between Movement Metrics
MeanSD SD75 SD95 MF10.15 MF20.15
MeanSD 1.00 0.85 0.95 0.82 0.69
SD75 0.85 1.00 0.71 0.91 0.88
SD95 0.95 0.71 1.00 0.69 0.51
MF10.15 0.82 0.91 0.69 1.00 0.80
MF20.15 0.69 0.88 0.51 0.80 1.00
MF10.20 0.82 0.91 0.68 1.00 0.80
MF10.25 0.83 0.91 0.72 0.98 0.75
OpenPoseLX200 0.55 0.44 0.59 0.40 0.35
COPMovement0.25 0.12 -0.01 0.26 -0.01 -0.07
MF10.20 MF10.25 OpenPoseLX200 COPMovement0.25
MeanSD 0.82 0.83 0.55 0.12
SD75 0.91 0.91 0.44 -0.01
SD95 0.68 0.72 0.59 0.26
MF10.15 1.00 0.98 0.40 -0.01
MF20.15 0.80 0.75 0.35 -0.07
MF10.20 1.00 0.98 0.40 0.00
MF10.25 0.98 1.00 0.42 0.06
OpenPoseLX200 0.40 0.42 1.00 0.62
COPMovement0.25 0.00 0.06 0.62 1.00
Using a regression analysis, no significant difference between seats was found for any of the
metrics. That is, the number and magnitude of movements were not significantly different
between seats, based on these metrics. The analysis also considered whether maximum
discomfort rating was related to movement across trials. Note that this is also a between-subject
analysis with N=48, since each subject contributed one data point for each seat. No significant
relationships between maximum discomfort during a trial and the movement metrics were found.
Movement metrics were not significantly related to participant characteristics, such as stature or
body mass index. The difference in movements between seats A and B was also not significantly
related to participant characteristics.
Figure 6 shows plots of several of the metrics versus the maximum discomfort rating. Weak
trends toward reduced discomfort with higher movement was observed, but these trends were not
statistically significant.
21Figure 16. Movement metrics vs. subjective responses. Seat A is shown with circles, Seat B with triangles.
Regression line is for all data. None of the regressions is significant (p>0.05).
Final Questionnaire
The final questionnaire (Appendix C), administered after the second trial, included questions
about the participants’ own vehicle. Table 6 summarizes the results. Most participants indicated
they could sit in their own vehicle for more than an hour before becoming uncomfortable. When
asked what they would change about their current vehicle seat, most mentioned shape (“other”
responses related to shape, such as lumbar support, were included in shape). About a third of
participants thought a softer seat would be more comfortable for all trips, whereas only two
thought a firmer seat would always be more comfortable. More than a third of participants
thought the videos were fascinating and the remainder thought it was interesting. None reported
that they were not very interesting or very boring.
22Table 6
Summary of Final Questionnaire Responses
Sit Before Uncomfortable Feeling on Long Trips
30 mins 4 OK 17
1 hr 6 Boring 3
> 1hr 14 Interesting 4
Prefer Own Vehicle Seat to Be Video
Softer 7 Fascinating 9
Firmer 1 Interesting 15
Shape 14 Not very interesting 0
None 2 Very boring 0
Softer Seat is More Comfortable Firmer Seat is More Comfortable
All Trips 8 All Trips 2
Daily Trips 8 Daily Trips 8
Long Trips 7 Long Trips 8
Never 1 Never 6
23DISCUSSION
This study was conducted to explore the hypothesis that seating discomfort is associated with
increased frequency of movement. However, no evidence to support that hypothesis was found.
The seat that was modified to be uncomfortable produced slightly higher discomfort ratings, but
several participants found the unmodified seat to be more comfortable.
A wide variety of movement metrics were computed across three modalities (Kinect depth, video
image analysis, and seat surface pressure). As expected, the metrics were generally correlated,
except that the video analysis was deliberately restricted to the lower extremities and hence was
the only metric correlated with the pressure-based metric. None of the metrics was found to
differ significantly between seats, and none was meaningfully correlated with discomfort ratings.
The results from the pressure-based analysis were most similar to those of the posture-based
analysis that was focused on the lower extremity, but the pressure metrics were apparently less
sensitive to posture change than the video-based method.
The study has several important limitations. The difference in task between normally driving and
riding may be the most important. The videos, which were displayed on a fairly large screen,
were found to be interesting by all participants. In contrast, video watching is not a common
activity for drivers and most passengers would watch video on a small screen, if at all. Only 4 of
24 said they normally find long-distance driving to be interesting (final survey).
The sitting duration of one hour is longer than about 95% of trips in the US, so the exposure to
potential discomfort was relatively high on that basis. However, the laboratory mockup was
stationary, though it is not clear whether vehicle ride motion would tend to worsen or lessen
discomfort.
24Appendix A
Scripts and Investigator Instructions
Consent Script
Thank you for volunteering today. The purpose of the study is to understand the effects of seat
design on seat comfort, body posture, and motion. If you choose to participate, you will be
asked to sit in an automobile driver seat for an hour while watching a video. During the sitting
session you will fill out a discomfort survey every five minutes and complete another longer
survey at the end. During the sitting session, we will monitor your posture and motion with a
motion-tracking camera system and pressure sensors in the seat.
You may become uncomfortable during the sitting session. If the discomfort becomes
unacceptable to you, you may discontinue your participation without affecting your pay. The
investigator (or I) will be in the office in the next room. Please knock on the wall or use the
walkie-talkies we provide if you need his (my) help or have a question.
You will participate in two sessions on two separate days. Each session will last about 90
minutes in total and you will be paid for both sessions after the end of the second day.
(Subject signs consent form)
(Anthro Measurements are taken and the subject is escorted to the Lab)
In a moment I will ask you to take a seat and get in a comfortable position, after doing this we
ask that you remain seated for the full testing period of one hour, unless you feel you must get
up. If you do so, please contact me and let me know that you have gotten up and for what
reason. Remember you may discontinue your participation without affecting your pay. Also,
please do not eat, drink or use your phone while sitting here.
Before we begin your time sitting, would you like to use the restroom?
Sitting Instructions
Please have a seat and get in a comfortable position. You may adjust the back recline angle to a
comfortable position now. Please keep your feet in the area of the platform in front of you. In
other words, you should not hang a foot over the side of the platform.
(once the subject says they are in a comfortable position)
Please step out of the seat, and I will record the seat position.
(record with Kinect and pressure system; mark recline angle on back and then tape down back
angle position lever on seat)
Subjective Measurement Instructions
(Participant standing)
25These are the forms that you will be filling out as you are watching the video. (show sheets on
the clipboard). The left end of line is no discomfort and the right end is unbearable discomfort.
You will place a slash along the line to show us your level of discomfort at that moment you are
filling out the form. During the video a window will pop up every 5 minutes telling you what
survey number to fill out. The survey number is located at the top right of the page. Place the
completed survey in the box. The video may be shorter than 1 hour, but you will still fill out at
least 12 survey forms.
There are tissues and hand sanitizer on the table if you need them, and again I will be right next
door. Please contact me by knocking or by pushing this button on the walkie-talkie if you need
anything or have any questions.
Beginning Data Collection
Please have a seat. As a reminder please keep your feet in the area of the platform in front of
you.
As an initial indicator of your discomfort level please fill out survey 0 now. (watch to make
sure they fill it out correctly)
Once you mark the survey place it in the container and place the clipboard and other surveys
back on the table.
Do you have any questions before we start? (answer questions)
Ok, I will now start the video and leave the room (start video, adjust sound, start Mathematica
code and place its window in the lower right-hand corner)
At the End of Each Day
(After the hour, but with the participant STILL SEATED). Please fill in this survey.
At the End of the 1st Day
When you return for your second appointment, please wear the same clothes and shoes (if at all
possible).
At the End of the 2nd Day
(After the they stand up). Today we have an additional survey for you.
Payment
26Appendix B
Seat Questionnaire
2728
29
Appendix C
Exit Questionnaire

                     30
31
You can also read