Estimating amino acid requirements through dose-response experiments in pigs and poultry - Protocol and results interpretation
←
→
Page content transcription
If your browser does not render page correctly, please read the page content below
TECHNICAL NOTE                                         FEBRUARY 2012

  Estimating amino acid requirements through
          dose-response experiments
              in pigs and poultry

          - Protocol and results interpretation -

                      AJINOMOTO   ANIMAL   NUTRITION

                    AJINOMOTO EUROLYSINE S.A.S.
Introduction 3
A. Experimental protocols and requirement expression 4
1. Expressing amino acid requirements 4
1.1. Expressing the requirement as a % of lysine 4
1.2. Expressing the requirement as a % of the feed 5
1.3. Conclusions on the way of expressing an amino acid requirement 6
2. The number and the levels of the dietary treatments have to be well-considered and controlled 7
2.1. The number of treatments to test 7
2.2. Positioning the dose levels and choosing the growing infrequency 8
B. Interpreting data from dose-response studies 9
1. What the experimental data tell to us 9
2. Basis about statistics 10
2.1. Means comparisons are not adapted to interpret dose-response studies 10
2.2. Modelling the response curve to estimate a requirement 10
3. Criteria to take into account to estimate a nutrient requirement for a growing population 12
3.1. Taking into account the variability of population 12
3.2. Taking into account the dynamic aspect 13
3.3. Representing experimental data 14
3.4. Including a safety margin for the estimation of a requirement 15
3.5. Summary of the comparison between the linear- and the curvilinear-plateau models 17
Conclusion 18
References 19
2 | Technical note | Ajinomoto Eurolysine S.A.S.INTRODUCTION
I n animal nutrition, it is usual to carry out dose-response experiments to estimate amino acid requirements. Because
a major part of the variability in the reported amino acid requirements is due to the protocol itself and the results
interpretation (Dawkins, 1983), this document aims at clarifying why a dose-response study is performed, how to
design its protocol and how to interpret the results.
Dose-response studies are used in lots of different fields to determine the dose which corresponds to a specific response.
For example, in toxicology, the Lethal Dose 50 which corresponds to the dose needed to obtain the death of 50% of
the population is estimated thanks to a dose-response. In animal nutrition, the requirement for a specific nutrient, and
particularly amino acids, can be defined as the minimal amount of this nutrient (DOSE) needed to reach maximum
performance (RESPONSE) assuming that all the other nutrients are provided in adequate amounts. The objective of
determining amino acid requirements is to use these values to feed populations of animals. The aim of a dose-response
experiment is therefore to estimate a single value applicable to the whole population; the individual variation that exists
within the population has therefore to be taken into account in the estimation. In this document, only growing animals are
considered (adult animals have a specific metabolism and the practical objectives are not the same); the term “growing”
implying a dynamic aspect.
Different methods exist to estimate a nutrient requirement (Pomar et al., 2003):
- The factorial approach: daily requirements are obtained for an individual animal at a specific point in time by
combining the estimated requirements for maintenance and production (hypothetical growth).
- The empirical approach: nutritional requirements are defined as the minimal amount of nutrients needed to maximize
or minimize population responses for one or several performance criteria during a given period.
The definition of the term “requirement” for growing animals is thus definitely in the scope of the empirical method and
dose-response studies allow estimating amino acid requirements by depicting the response of a growing population
to increased levels of an amino acid. This method consists indeed of testing different concentrations of a nutrient and
then determining through statistical methods which level gives the best performance; but reported results can be quite
variable. A part of this variability comes from the fact that the method used to interpret the results are not always in
line with the objective and the protocol of the trial. The first step to perform a dose-response experiment is therefore to
define a very precise objective because the protocol and the result interpretation will depend on it.
Ajinomoto Eurolysine S.A.S. | Technical note | 3A. EXPERIMENTAL PROTOCOLS AND REQUIREMENT EXPRESSION
1. EXPRESSING AMINO ACID REQUIREMENTS
For any nutrient, requirements can be expressed in pigs and poultry fed with cereal-based diets, the first and
different units or within different nutritional systems. Amino the second limiting amino acid for growth.
acid requirements in the literature are often reported in a To design a protocol for a dose-response trial which
wide range of units: amount in the feed (in % of the feed aims at estimating an amino acid requirement expressed
or in g per unit of energy), ingested quantity relative to relative to lysine, the basal diet has to be formulated by
weight gain (mg per g of daily gain), relative to lysine following specific conditions.
(% of lysine), … These different ways of expressing the
requirement contribute to the variability that is reported The lysine content in the experimental basal diet has to
concerning the amino acid requirements. be the second limiting factor for growth performance
All of these units have their strengths and weaknesses
but the important point is that the desired mode of In a dose-response experiment, one of the most important
expression will determine the protocol that has to be criteria which must be taken into account when the amino
used in the dose-response experiment: the basal diet must acid requirement is wanted to be expressed relative to
indeed be designed according to the way in which the lysine is that in the basal diet, lysine must be the second
requirement will be expressed. That is why it is of the limiting amino acid after the studied amino acid while
highest importance to precisely define the objective of the the supply of the other amino acids should meet or
dose-response experiment with the unit of expressing the slightly exceed animals’ requirements (Boisen, 2003). It is
requirement. important to choose enough low lysine level to ensure that
However, whatever the way of expressing the lysine is really the second limiting amino acid during the
requirement which is chosen, the first rule to respect is that whole period of the experiment. For the treatment diets,
the first limiting factor in the experimental basal diet has different levels of the studied amino acid are provided,
to be the nutrient for which the requirement is wanted to while the dietary lysine content remains constant.
be estimated. It is thus important to have a rough idea When the studied amino acid is the first limiting factor
of the requirement before starting the elaboration of for performance (weight gain, feed efficiency…) in the
the protocol. To achieve this objective, a literature review basal diet, an increase in its level will result in an increase
and/or a pre-trial might be performed. in the response criterion up to the point where its supply is
no longer limiting. A further increase in the tested amino
1.1. Expressing the requirement as a % of lysine acid supply would not result in a change in the response
criterion and leads to the achievement of a plateau-value
For growing animals, amino acid requirements are which is determined by the second limiting factor in the
often expressed based on the concept of ideal protein. diet. At this point the two first limiting factors are equally
This concept defines the amino acids profile (i.e. the limiting.
composition of ideal protein as g of amino acid per 100 If lysine is actually the second limiting factor, the
g of lysine) which exactly meets animals’ requirements plateau-value will be determined by the lysine supply and
for protein deposition and maintenance (Fuller et al., at the breakpoint (Figure 1 (b)), the tested amino acid
1989). The composition of ideal protein is such that all and lysine are equally limiting; this point can therefore be
amino acids are equally limiting for performance and considered as the requirement of the tested amino acid
corresponds to the minimum supply of amino acids that expressed relative to lysine. It is assumed that theoretically
is required to maximize nitrogen retention, growth or the optimal amino acid:lysine ratio is not affected by the
another response criterion. Lysine has traditionally been lysine content in the diet as soon as lysine is actually the
used as the reference because it is mainly used for muscle second-limiting factor (Boisen, 2003; Figure 1).
protein deposition and also because it is, respectively for
4 | Technical note | Ajinomoto Eurolysine S.A.S.utilization; Baker, 2000). That is why it is important to
Response
estimate the amino acid requirements for a given growing
Lys > requirement stage.
Lys < requirement
For a given stage of production, estimating amino acid
Lysbe limited by another factor which is unknown (dietary on the specific objective of the experiment, different ways
factor, environment, feed intake capacity…). There is no of expressing the requirement can be chosen considering
way to know what this second limiting factor responsible the strengths and weaknesses of each of them (Table 1).
for the achievement of the plateau-value is. At the time of making decisions regarding nutritional
recommendations, the nutritionist should use the most
Weakness of expressing an amino acid requirement as advanced nutritional concepts and express requirements
an amount of the feed on the same basis to formulate consistent feeds; for
instance: standardized ileal digestible (SID) system, net
The scope of an amino acid requirement determined as energy system, ideal amino acid profile concept.
an amount of feed is generally limited to the particular
conditions of the trial. Moreover, due to the difficulties
to control the limiting factors, the published requirements
often vary over a wide range.
1.3. Conclusions on the way of expressing an
amino acid requirement
Because the protocol is dependent on the way of
expressing the requirement, it should not be possible to
use another way of expressing the requirement than the
one chosen a priori. It is especially true when an amino
acid (other than lysine) requirement is estimated in %
of the diet; as lysine is oversupplied, it is not possible to
express this requirement as a ratio to lysine. Depending
Table 1: Protocol to apply, strengths and weaknesses for different ways of expressing an amino acid requirement
Mode of expression Amount in the feed Ideal amino acids profile
Unit % of the feed % of lysine
Objective To determine the amino acid concentration To determine the ratio at which the tested
in the feed which leads to the best amino acid and lysine are equally limiting
performance for performance
Characteristics of the basal experimental diets
Studied amino acid 1st limiting 1st limiting
Lysine Not limiting 2nd limiting and sub-limiting
Other amino acids Not limiting Not limiting (ideal protein)
Net Energy Not limiting Not limiting
Strengths Allows to optimize a specific diet Easy to apply in practice
Good way to produce lysine reference Homogeneous results
Not specific to the studied diet
Weaknesses Difficulties to control the limiting factors
Assumes that the requirement is the same
Specific to the studied diet (lysine level, whatever the stage of life of the animal
energy level...)
Requires great number of trials (lysine
Very variable results
level, different weight ranges)
6 | Technical note | Ajinomoto Eurolysine S.A.S.2. THE NUMBER AND THE LEVELS OF THE DIETARY TREATMENTS HAVE TO BE WELL-CONSIDERED AND
CONTROLLED
2.1. The number of treatments to test of parameters that will be estimated (including the error
parameter) in the model used to analyse the results (Mead,
The number of treatments has to be chosen according to 1988). By increasing the degrees of freedom in the
the objectives of the experiment and also according to regression tests, using higher number of treatments allows
the method that will be used to interpret the results. The to further improve model fitting to the data (Hernandez-
question concerning the modelling step is discussed in the Llamas, 2009; Figure 2).
second part of this document (Part B) but the experimenter
has to know which type of model will be used to interpret Accuracy: Increasing the number of replicates per
the results to be able to choose the number of treatments. treatment will improve the accuracy of the model and
thus reduce the confidence intervals on the parameters
There are some rules that can help to make a decision: estimates. However, the number of treatments has to be
given more importance than the number of replicates to
Robustness: The number of tested levels has to be at ensure that only one solution will exist to estimate each
least equal to, or preferably one more than, the number parameter in the model.
RESPONSE
DOSE
Figure 2: A low number of treatments decreases the model fitting to the data and increases the uncertainty about the best model
to use: with only three tested doses, different models can be considered, the linear ( ), the quadratic ( ) and the linear-
plateau ( ) models
Ajinomoto Eurolysine S.A.S. | Technical note | 72.2. Positioning the dose levels and choosing the
growing infrequency (a)
Positioning the dose levels is also of great importance for
RESPONSE
the estimation of a requirement. If the tested levels are
not positioned around an a priori requirement, a large
proportion of the work will indeed be wasted even with
the best statistical analyses (Pesti et al., 2009). However,
optimum placement of the dose levels is impossible without DOSE
prior knowledge about the shape of the dose-response
(b)
curve and the possible range of the requirement. The first
step is thus to perform a literature review and/or a pre-
RESPONSE
trial to have a rough idea about the requirement and then
to be able to estimate it more precisely. The objective
of a dose-response experiment being the estimation
of a requirement, the tested levels should be allocated
¼ in the ascending portion of the curve, ½ near the a DOSE
priori requirement and ¼ at high enough levels so that
(c)
the plateau-value can be defined (Shearer, 2000). For
example, with 7 treatments, 2 levels have to be in the
ascending portion, 3 levels around the requirement and 2 RESPONSE
levels on the plateau-value (Figure 3 (a)).
The important points to specifically pay attention are:
DOSE
1) the highest dose has to be above the level capable of
producing the maximum response; the failure to include Figure 3: The choice of the position of the tested levels
depends on the a priori shape of the response and on the
sufficiently high nutrient levels is a common design flaw requirement
which results in a trial which can not be salvaged even by
the best statistical test. If all the tested levels are in the
ascending portion of the response curve, it will indeed not
be possible to estimate a requirement (Figure 3 (b)); in
the same way if all the tested levels are on the plateau-
value, it will not be possible to estimate a requirement
(Figure 3 (c)),
2) the space between the input levels has not to be too large
to perform accurate determination of the requirement but
sufficiently to avoid manufacturing problems.
8 | Technical note | Ajinomoto Eurolysine S.A.S.B. INTERPRETING DATA FROM DOSE-RESPONSE STUDIES
1. WHAT THE EXPERIMENTAL DATA TELL TO US
As explained before, the dose-response observations, Three main characteristics can be noticed:
and therefore the estimated requirement, are very
dependent on the study design. 1) There is a variability between individuals (or pens,
Flaws in experimental design are responsible for a part depending on the experimental unit) in the response for
of the variability that exists in the literature. Due to this each tested dose,
variability, it is not so easy to evaluate which estimates 2) The different treatments have structure; meaning that
requirement is the correct one. the doses are linked together since they can be classified
After having chosen the protocol to put in place, the in increasing order (contrary to unstructured treatments;
dose-response study will supply experimental data. These for example “castrated” vs. “entire males” or “with” vs.
data have been obtained with a specific protocol, they “without a specific product” are treatments without any
have therefore to be analysed with the proper method. structure),
To well understand how experimental data from 3) The searched dose is a continuous variable: it could
dose-response experiments have to be interpreted, it is take any value between 0 and +∞ (and not only one
necessary to understand what the specificities of these among the tested doses).
data are.
Figure 4 presents the type of graph that dose-response To interpret these experimental data, specific statistical
experiments can provide. methods which are adapted to biological studies, have
to be used.
RESPONSE
RESPONSE
1. Variability
2. Structured treatments
3. The searched dose is a continuous variable
DOSE DOSE
Figure 4: Experimental data from dose-response experiment
Ajinomoto Eurolysine S.A.S. | Technical note | 92. BASIS ABOUT STATISTICS
2.1. Means comparisons are not adapted to Non-linear models: Non-linear models such as the linear-
interpret dose-response studies plateau (LP or broken-line), curvilinear-plateau (CLP or
quadratic-plateau) or asymptotic (ASY) models (Table 2)
In a dose-response experiment, statistical analyses and are frequently used to estimate amino acid requirements.
requirement determination have to be done using an For the ASY model, because the plateau is attained at an
adapted model. Finding the best model to depict the infinite level of the nutrient, the requirement is estimated as
animal’s response to an increase in a nutrient level is not a the level of nutrient required to reach an arbitrary chosen
new topic. The point which was sure since at least 30 years percentage of the plateau-value (e.g., 95%; Table 2).
ago is that the means comparisons (ANOVA) are not an When the number of levels tested is not higher than four,
adequate method to analyse data from doses-response the ASY model is particularly adapted because it is difficult
experiments but they are still misused by biologists to estimate a plateau-value for the performance. In the
(Dawkins, 1983). This method has indeed to be used to other cases, the choice between LP and CLP models can be
compare a set of unstructured treatments and qualitative discussed. Both of them give indeed a clear definition of
treatments (i.e., discrete variables; for example “male” what the requirement is (i.e., the dose needed to reach the
vs. “female”); it is thus not adapted to interpret dose- plateau; Table 2), but the LP model has been discredited
response studies (Nelson and Rawlings, 1983) because it by lots of scientists (Fisher et al., 1973; Curnow, 1973;
does not take into account that response variables are Robbins et al., 1979 and 2006; Morris, 1989 and 1999;
continuous rather than discrete (Shearer, 2000), and does Shearer, 2000; Wellock et al., 2004). The objective of
not consider that the different treatments are logically the following section is to understand why the CLP model
structured (Morris, 1983). When means comparisons is better adapted to estimate a nutrient requirement for
are used, there is no function defined and thus it is not growing population compared to the LP model.
possible to precisely estimate the requirement (Pesti et
al., 2009). That is why a response-curve that represents
animal response to nutrient has to be chosen to determine
a nutritional requirement.
2.2. Modelling the response curve to estimate a
requirement
The choice of the statistical model depends on the shape
of the data (Table 2); however in some studies it is very
difficult to discern a pattern in the data and no curve
adequately fits the data points. In this case, it is possible
that an additional source of variation was influencing the
response. There are two types of models:
Linear models: They include the linear functions which
are used to describe a linear relationship between
two variables but which do not allow the estimation of
a requirement (Table 2). Requirements are sometimes
estimated using quadratic functions (which are also linear
models) but these models may not be appropriate if the
response criterion does not further respond to a high level
of nutrient.
10 | Technical note | Ajinomoto Eurolysine S.A.S.Table 2: Statistical models*
Shape of the response Type of model Graphic representation
Increases linearly Linear model:
RESPONSE
linear function
Y = aX + b
DOSE R?
Increases, then Linear model:
Max
decreases after reaching quadratic function
RESPONSE
a maximum response
Y = aX2 + bX + c
R = -b/2a
R DOSE
Increases and be stable Non-linear models:
after
Max
• linear-plateau RESPONSE
Y = Ymax + U·(R - X) for X < R
Y = Ymax for X ≥ R
DOSE R
Max
• curvilinear-plateau
RESPONSE
Y = Ymax + U·(R - X)2 for X < R
Y = Ymax for X ≥ R
DOSE R
• asymptotic 95% Max
RESPONSE
Y = Ymax - a·exp(-bX)
DOSE R
Y represents the response, Ymax, the maximum response and X, the dose; R represents therequirement, a, b, c and U,
parameters of the models to be estimated
* This table gives some examples of simple models but numerous others models exist that are more complicated with higher
number of parameters to estimate.
Ajinomoto Eurolysine S.A.S. | Technical note | 113. CRITERIA TO TAKE INTO ACCOUNT TO ESTIMATE A NUTRIENT REQUIREMENT FOR A GROWING
POPULATION
To depict the response of a growing population to
increased levels of a nutrient, even if a straight line % of animals adequately fed
can be used to depict the ascending portion, it is never 100
possible to tell if there is a sharp break between the lines 90
80
or a smooth transition. However, if the response of an
70
individual animal is given by a LP model, the response 60
(a)
of the population of this animal will resemble that of the 50
CLP model (Curnow, 1973; Morris, 1983; Leclercq and 40
30
Beaumont, 2000; Pomar et al., 2003; Pomar, 2005).
20
Because the objective here is to define a requirement 10
for a growing population, it seems that the CLP model is 0
70 80 90 100 110 120 130
the best-adapted model compared to the LP model. The
% of mean requirement (b)
following section develops which criteria have to be taken
into account to correctly depict the response of a growing Figure 5 (adapted from Brossard et al., 2009): Effect of a nutrient supply (as %
of the mean requirement of the population) on the percentage of pigs for which
population to an increase in the levels of a nutrient and the requirement was met
to estimate the nutritional requirement for this population. (a) “If 100% of the mean requirement is applied to a population, half of this population
will be underfed.”
(b) “The requirement to feed a population is higher than 100% of the mean requirement.”
3.1. Taking into account the variability of
population
Requirements have to be estimated for the whole
population
Because a LP response is predicted for an average
pig, the requirement defined with the LP model can be CV ADG (%)
considered as the requirement for a theoretical average 15
pig (Morris, 1983; Leclercq and Beaumont, 2000; Pomar
14
et al., 2003). This requirement corresponds therefore to
an average value, without considering the variation within 13
the population. If this “average requirement” is applied to 12
a population, half of this population will be underfed and
11
so the average performance of the population will be
lower than expected (Figure 5 (a); Brossard et al., 2009). 10
This implies that the requirement to feed a population
9
is higher than the requirement to feed an average 70 80 90 100 110 120 130
animal, to allow every individual in the population to % of mean requirement
reach its potential performance (Figure 5 (b)). Moreover
Figure 6 (adapted from Brossard et al., 2009): Effect of a nutrient supply (as %
when the number of animals fed adequately increases, of the mean requirement of the population) on the coefficient of variation (CV)
the variability of the population will decrease (Figure of average daily gain (ADG) of pigs
6, Brossard et al., 2009). To feed adequately every “When the number of animals fed adequately increases, the variability of the population will decrease.”
individual in the population, the requirement has therefore
to be estimated for the whole population.
12 | Technical note | Ajinomoto Eurolysine S.A.S.The curvilinear-plateau model is the one which 3.2. Taking into account the dynamic aspect
describes the best the response of a population
To estimate the requirement of a nutrient for a growing
The CLP response of the population can be explained population, the dynamic aspect (for example, the growing
by between-animal variation (Wellock et al., 2004): period of piglets between 12 and 25 kg) has to be taken
the length and degree of the curvature of the response into account. An animal’s response to nutrient intake
increase with the population variability (Figure 7, indeed changes over the interval during which data are
Pomar et al., 2003). Therefore to predict adequately collected (Pomar, 1995; Haushild et al., 2010). If the
the response of a population in a given environment, it duration of an experiment is too short, the requirement
is necessary to take the between-animal variation into will be underestimated; and this is probably most true
account (Curnow, 1973; Fisher et al., 1973; Emmans when growth is used as the response variable, since a
and Fisher, 1986; Pomar, 1995; Wellock et al., 2004). deficiency of some nutrients will have an effect on growth
Models designed to simulate population responses need only after a certain period.
to integrate the effect of population variation on growth It has been demonstrated that increasing the time
performance and need to represent the population itself over which animal responses are measured increases the
and not an individual animal even if it is representative curvilinearity of the responses (Figure 8, Pomar et al.,
of this population (Wellock et al., 2004; Hauschild 2003). The CLP model is the one that depicts a response
et al., 2010). The CLP model is the one that takes into obtained on a period of time of several days, so it is
account the population as a whole so, compared to the particularly adapted to estimate the requirement of a
LP model, it is preferred to estimate the requirement for growing population.
a population (Curnow, 1973; Morris, 1983; Baker et al.,
2002, Hauschild et al., 2010).
1 d of collection
28 d of collection
Individual = no variability
Population = between-animal variability
Figure 7 (adapted from Pomar et al., 2003): Effect of between-animal Figure 8 (adapted from Pomar et al., 2003): Effect of data collection length
variation and balanced protein intake on average daily protein deposition and balanced protein intake on average protein deposition rate of pigs
rate of pig populations
“If the response of an individual animal is given by a LP model, the response of the
“The CLP model is the one that takes into account the duration of the collection period.”
population of this animal will resemble that of the CLP model.”
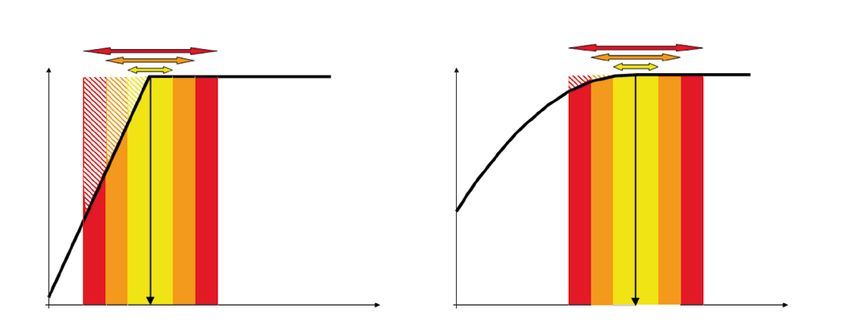
Ajinomoto Eurolysine S.A.S. | Technical note | 133.3. Representing experimental data
The adequacy of the LP model is not often supported
by experimental results (Baker, 1986; Moughan, 1999) (a)
contrary to the CLP model. This can be explained by the 100
shape per se of each curve. The LP model depicts indeed a
ADG (% the best performance)
95
constant marginal efficiency (slope) up to the requirement, 90
to become zero thereafter; whereas in the CLP model, the 85
marginal efficiency is diminishing linearly with increasing 80
nutrient supply until zero when the requirement is reached 75
(Figure 9). 70
65
60
11 13 15 17 19 21 23 25 27
SID Trp:Lys (%)
Animal's
response
Constant marginal efficiency (b)
100
Diminishing marginal efficiency
ADG (% the best performance)
95
90
85
80
Curvilinear-plateau
Linear-plateau 75
70
Nutrient dose
65
60
Figure 9: Biological interpretation of the shape of the linear- and 11 13 15 17 19 21 23 25 27
curvilinear-plateau models
SID Trp:Lys (%)
“The variability that exists among the animals contributes significantly to the
decrease in nutrient efficiency over varying nutrient levels. The CLP model is
the one that takes into account this biological dynamics.” Kluge et al., 2010 Ma et al., 2010
Naatjes et al., 2010 (Wheat-Barley) Naatjes et al., 2010 (Corn)
It has been well demonstrated that the variability that
Linear-plateau model Curvilinear-plateau model Asymptotic model
exists among the animals contributes significantly to the
decrease in nutrient efficiency over varying nutrient levels
Figure 10: External validation of the response of average daily gain
(Curnow, 1973; Bikker et al., 1994; Pomar et al., 2003; (ADG) to increasing levels of standardized ileal digestible (SID) Trp:Lys
Wellock et al., 2004; O’Connell et al., 2005; Brossard supply in piglets. The figure combines the determined response curves
thanks to a meta-analysis with data not used in this analysis. External
et al., 2009; Haushild et al., 2010). Therefore, to take data concern results of trials using only two levels of Trp:Lys (a) or results
into account the between-animal variation, a model that of dose-responses to Trp (b) (from Simongiovanni et al., 2012)
depicts a diminishing marginal efficiency (e.g., the CLP
model) has to be used. Recently, response-curves of the
piglet population to the increase in the level of SID Trp:Lys
ratio has been estimated thanks to the LP, CLP and ASY
models (Simongiovanni et al., 2012). When these curves
were compared with external data to validate the models,
it shows that the CLP model was the best-adapted model
to depict the external data compared to the LP and ASY
models (Figure 10).
14 | Technical note | Ajinomoto Eurolysine S.A.S.3.4. Including a safety margin for the estimation of for corn for instance (Relandeau and Eudaimon, 2008).
a requirement Another more precise method is based on regression
equations; the nutritional values are there estimated with
The choice of the statistical model is a preponderant factor prediction intervals of 7.8% in average for wheat and
of variation of reported requirements (Baker, 1986; 9.4% in average for corn for instance (Relandeau and
Barea et al., 2009; Simongiovanni et al., 2012), and any Eudaimon, 2008). Finally the most accurate method for
published requirement or recommendation should be done feedstuffs evaluation is amino acid analyses for which
with the indication of the method used. This is much more the nutritional values are analyzed with coefficients of
important for the feed industry because the choice of a variation; for instance, in the range 2-8% for sulphur amino
statistical model is directly linked to the risk management. acids, 1-4% for all the others and even more depending
The delivery of an efficient feed to the farm is indeed a on the laboratory (Eudaimon M., personal communication).
result of numerous risk estimations. Thus the choice of the method to estimate nutritional values
Concerning the feedstuffs evaluation, one of the methods of the feedstuffs is linked to an uncertainty that has to
which is commonly used to estimate amino acid contents be considered when making the choice of nutritional
is based on table values but with a confidence interval constraints.
of 26.3% in average for wheat and 14.1% in average
(a) (b)
Deviation to expected CP values vs. expected CP values Deviation to expected Lysine values vs. expected Lysine value
4 0,4
Diff. Lys analyzed - expected, Pts
Diff. CP analyzed - expected, Pts
3 0,3
2 0,2
1 0,1
0 0
0,8 0,9 1,0 1,1 1,2 1,3 1,4 1,5 1,6
15 16 17 18 19 20 21
-0,1
-1
-0,2
-2
-0,3
-3
AEL, Survey starter piglets (2008)
AEL, Survey starter piglets (2008) -0,4
-4
CP expected, % Lysine expected, %
Figure 11: Difference between the analysed and expected values as a function of the expected values for CP (a) and Lysine (b) dietary
contents (from AEL survey, starter piglet diets, 2008)
Ajinomoto Eurolysine S.A.S. | Technical note | 15The nutritional values in the final diet have theoretically, The choice of a statistical model on a practical point of
a fifty-fifty chance to be lower than the targeted value view is also directly linked to the risk management. The LP
(nutritional constraint) due to the normal law around the and CLP models indeed differ in the way they take into
targeted value. In practice, we can easily observe that in account the risks: the risk taken with animals’ performance
most of the cases, the targeted value is not reached and is greater using the estimates from LP model than using
the analysed value is lower or higher than the expected the estimates from the CLP model (Figure 12). The
one depending on the nutrient measured (Figure 11). That requirement estimates of the CLP model are therefore
is why; the choice of the target is of great importance. more adapted for practical issues.
Making a choice on a nutritional constraint must therefore
not be done only on performance and/or feed costs
objectives but also on this associated risk to lower supply
than the expected value.
(a) (b)
ANIMAL’ S RESPONSE
ANIMAL’ S RESPONSE
NUTRIENT DOSE NUTRIENT DOSE
Confidence interval:
Analyses Regression Table
Figure 12: Risk management concept: The risk taken with animal’s performance is due to the model used to choose
the nutrient constraint ((a) linear-plateau; (b) curvilinear- plateau) but is also due to the method used to obtain the
estimated value of the dietary content (analyses, regression equations or table values)
16 | Technical note | Ajinomoto Eurolysine S.A.S.3.5. Summary of the comparison between the some are useful” (George Box quoted by Ryan, 1997).
linear- and the curvilinear-plateau models The final choice of the statistical model is dependent on
the objectives that have to be reached (Table 3), taking
Unfortunately, absolute confirmation about the choice of into account that all requirements that are determined
the model is impossible since all statistical models are empirically should be considered as estimates.
approximation to the truth: “All models are wrong, but
Table 3: Comparaison between the linear- and the curvilinear-plateau models
Linear-plateau Curvilinear-plateau
1. Taking into account the between-
animal variability in a population - ++
2. Taking into account the dynamic
aspect - ++
3. Representing experimental data + ++
4. Including a safety margin for the
estimation of a requirement - ++
Practical issue : Confidence in the
estimation of nutritional requirements Very low Very high
for growing populations
Ajinomoto Eurolysine S.A.S. | Technical note | 17CONCLUSION
Experimental findings are essential for the feed industry to design efficient formulas and to face the challenges of
economy, health and environment in animal production.
When dose-response studies are performed, statistical analyses and results interpretation have to be
done in accord with the experimental design and objectives. This allows to avoid any misinterpretation
and to well estimate nutrient requirements which are intended to be applied in practice.
The adequacy between the way of expressing the requirement and the experimental design is a
guarantee of accurate estimation.
However, the choice of the statistical model contributes also a lot to the variability in estimated
requirements; dose-response interpretations have therefore to be done in the respect of some statistical
and biological rules.
The comparison of models clearly demonstrates that the CLP model is the best compromise for most
response. It is indeed the best descriptor of the effect of a nutrient on growth performance for growing
populations and so, gives an adequate estimate of amino acid requirements for practical applications.
A more accurate description of the response of pigs and poultry, accompanied by better methods for estimating
amino acids requirements, will contribute to improved diets for pigs and poultry.
18 | Technical note | Ajinomoto Eurolysine S.A.S.REFERENCES
Baker, D.H. 1986. Problems of pitfalls in animal Fisher, C., T.R. Morris, and R.G. Jennings. 1973. A model
experiments designed to establish dietary requirements for the description and prediction of the response of
for essential nutrients. J. Nutr. 116:2339-2349. laying hens to amino acid intake. Br. J. Poult. Sci. 14:469-
Baker, D.H. 2000. Recent advances in use of the ideal 484.
protein concept for swine feed formulation. As-Aust. J. of Fuller, M. F., R. McWilliam, T. C. Wang, and L. R. Giles.
Anim. Sci. 13:294-301. 1989. The optimum dietary amino acid pattern for
Baker, D.H., A.B. Batal, T.M. Parr, N.R. Augspurger, and growing pigs. 2. Requirements for maintenance and for
C.M. Parsons. 2002. Ideal Ratio (Relative to Lysine) of tissue protein accretion. Br. J. Nutr. 62: 255-267.
Tryptophan, Threonine, Isoleucine, and Valine for Chicks Hauschild, L., C. Pomar, and P.A. Lovatto. 2010. Systematic
during the Second and Third Weeks Posthatch. Poult. Sci. comparison of the empirical and factorial methods used
81:485-494. to estimate the nutrient requirements of growing pigs.
Barea, R., L. Brossard, N. Le Floc’h, Y. Primot, D. Melchior, Animal. 4:714-723.
and J. van Milgen. 2009. The standardized ileal digestible Hernandez-Llamas, A. 2009. Conventional and
valine-to-lysine requirement ratio is at least seventy alternative dose–response models to estimate nutrient
percent in post weaned piglets. J. Anim. Sci. 87:935-947. requirements of aquaculture species. Aquaculture. 292
Bikker, P., M.W. Verstegen, R.G. Campbell, and B. Kemp. (3-4):207-213.
1994. Digestible lysine requirement of gilts with high Kluge, H., J. Bartelt, and G. Stangl. 2010. Studies on
genetic potential for lean gain, in relation to the level of the tryptophan requirements of piglets. In: 9. BOKU-
energy intake. J. Anim. Sci. 72:1744-1753. Symposium Tierernährung, Vienna, Austria, April 15,
Boisen, S. 2003. Ideal dietary amino acid profiles for 2010, poster.
pigs. In: Amino Acids in Animal Nutrition (eds JPF D’Mello), Leclercq, B., and C. Beaumont. 2000. Etude par simulation
CABI Publishing, Wallingford, UK, pp. 157-168. de la réponse des troupeaux de volailles aux apports
Brossard, L., J.Y. Dourmad, J. Rivest, and J. van Milgen. d’acides aminés et de protéines. INRA Prod. Anim. 13:47-
2009. Modelling the variation in performance of a 59.
population of growing pig as affected by lysine supply Ma, L., Z.P. Zhu, R.B. Hinson, G.L. Allee, J.D. Less, D.D. Hall,
and feeding strategy. Animal. 3(8):1114-1123. H. Yang, and D.P. Holzgraefe. 2010. Determination of
Curnow, R.N. 1973. A smooth population response curve SID Trp:Lys ratio requirement of 11- to 22-kg pigs fed
based on an abrupt threshold and plateau model for diets containing 30% DDGS. ASAS Des Moines, Iowa,
individuals. Biometrics. 29:1-10. March 15-17, 2010, Abstract 151.
Dawkins, H.C. 1983. Multiple Comparisons Misused: Why Mead, R. 1988. The design of experiments: statistical
so Frequently in Response-Curve Studies? Biometrics. principles for practical application. Cambridge University
39(3):789-790. Press, Cambridge, UK.
Emmans, G.C., and C. Fisher. 1986. Problems in Morris, T.R. 1983. The interpretation of response data
nutritional theory. In: C. Fisher and K.N. Boorman. Nutrient from animal feeding trials. In: Haresign, W. (ed.) Recent
requirements of poultry and nutritional research. ed. Advances in Animal Nutrition, ed. Butterworths, London,
Butterworths, London, pp. 9-39. pp. 2-23.
Ajinomoto Eurolysine S.A.S. | Technical note | 19Morris, T.R. 1989. The interpretation of response data Pomar, C. 2005. Nos modèles de simulation actuels sont- from animal feeding trials. In: D.J.A. Cole and W. Haresign. ils adéquats pour prédire la croissance corporelle et Recent Developments in Poultry Nutrition, ed. Buttersworth, les besoins nutritionnels des porcs charcutiers ? 37ème London, pp. 1-11. Journées de la Recherche Porcine. 37:307-316. Morris, T.R. 1999. Experimental Design and Analysis in Pomar, C., I. Kyriazakis, G.C. Emmans, and P.W. Knap. Animal Sciences. CABI Publishing, New York. 2003. Modeling stochasticity: Dealing with populations Moughan, P. J. 1999. Protein metabolism in the growing rather than individual pigs. J. Anim. Sci. 81(E. pig. In: I. Kyriazakis. A Quantitative Biology of the Pig, ed. Suppl.):E178-E186. CAB International, Wallingford, Oxon, UK. pp. 299-331. Relandeau, C., and Eudaimon M. 2008. Measuring Naadjes, M., J.K. Htoo, K.H. Tölle, and A. Susenbeth. and predicting amino acid contents in feedingstuffs. 2010. Optimales Tryptophan-Lysin-Verhältnis in Weizen- AJINOMOTO EUROLYSINE Technical Information N°32. oder Mais-basierten Diäten bei wachsenden Schweinen. Robbins, K.R., H.W. Norton, and D.H. Baker. 1979. In: 9. BOKU-Symposium Tierernährung, Vienna, Austria, Estimation of Nutrient Requirements from Growth Data. J. April 15, 2010, pp. 72-77. Nutr. 109:1710-1714. Nelson, L.A. and J.O. Rawlings. 1983. Ten common misuses Robbins, K.R., A.M. Saxton, and L.L. Southern. 2006. of statistics in agronomic research and reporting. J. Agron. Estimation of nutrient requirements using broken-line Educ. 12:100-105. regression analysis. J. Anim. Sci. 84(E. Suppl.):E155-E165. O’Connell, M.K., P.B. Lynch, and J.V. O’Doherty. 2005. Ryan, T.P. 1997. Modern Regression Methods. John Wiley Determination of the optimum dietary lysine concentration and Sons, New York, NY. for growing pigs housed in pairs and in groups. Animal Shearer, K.D. 2000. Experimental design, statistical Science. 81:249-255. analysis and modeling of dietary nutrient requirement Pesti, G.M., D. Vedenov, J.A. Cason, and L. Billard. studies for fish: a critical review. Aquaculture Nutrition. 2009. A comparison of methods to estimate nutritional 6:91-102. requirements from experimental data. Br. Poult. Sci. Simongiovanni, A., E. Corrent, N. Le Floc’h, and J. van 50:16-32. Milgen. 2012. Estimation of the tryptophan requirement in Pomar, C. 1995. A systematic approach to interpret the piglets by meta-analysis. Animal. In press. doi:10.1017/ relationship between protein intake and deposition and S1751731111001960. to evaluate the role of variation on production efficiency Wellock, I.J., G.C. Emmans, and I. Kyriazakis. 2004. in swine. In: Proceedings of the Symposium on Determinants Modeling the effects of stressors on the performance of of Production Efficiency in Swine. Can. Soc. Anim. Sci., populations of pigs. J. Anim. Sci. 82:2442-2450. Ottawa, Ont. Canada, pp 361-375. 20 | Technical note | Ajinomoto Eurolysine S.A.S.
Notes

          Ajinomoto Eurolysine S.A.S. | Technical note | 21
SIMONGIOVANNI Aude, LE GALL Eric, PRIMOT Yvan and CORRENT Etienne
AJINOMOTO ANIMAL NUTRITION
AJINOMOTO EUROLYSINE S.A.S.
153, rue de Courcelles 75817 Paris Cedex 17
Tel: +33 (0)1 44 40 12 12
Fax: +33 (0)1 44 40 12 13
www.ajinomoto-eurolysine.comYou can also read