Tweeting #RamNavami: A Comparison of Approaches to Analyzing Bipartite Networks
←
→
Page content transcription
If your browser does not render page correctly, please read the page content below
Article

Tweeting #RamNavami: A Comparison                                                                IIM Kozhikode Society & Management Review
                                                                                                                         10(2) 127–135, 2021
of Approaches to Analyzing Bipartite                                                                                   © 2021 Indian Institute
                                                                                                                   of Management Kozhikode
Networks
                                                                                                                   Reprints and permissions:
                                                                                                    in.sagepub.com/journals-permissions-india
                                                                                                           DOI: 10.1177/22779752211018010
                                                                                                             journals.sagepub.com/home/ksm
Michael T. Heaney1

Abstract
Bipartite networks, also known as two-mode networks or affiliation networks, are a class of networks in which actors or
objects are partitioned into two sets, with interactions taking place across but not within sets. These networks are omni-
present in society, encompassing phenomena such as student-teacher interactions, coalition structures and international
treaty participation. With growing data availability and proliferation in statistical estimators and software, scholars have
increasingly sought to understand the methods available to model the data-generating processes in these networks. This
article compares three methods for doing so: (a) Logit (b) the bipartite Exponential Random Graph Model (ERGM) and
(c) the Relational Event Model (REM). This comparison demonstrates the relevance of choices with respect to depend-
ence structures, temporality, parameter specification and data structure. Considering the example of Ram Navami, a
Hindu festival celebrating the birth of Lord Ram, the ego network of tweets using #RamNavami on 21April 2021 is exam-
ined. The results of the analysis illustrate that critical modelling choices make a difference in the estimated parameters
and the conclusions to be drawn from them.

Keywords
Bipartite network, two-mode network, ERGM, REM, Twitter, Ram Navami

The last two decades have witnessed tremendous growth                     partition of networks into two sets of actors or objects.
in scholarly interest in social network analysis. Several                 Such partitions occur naturally throughout the world.
factors have helped to propel this growth. First, the rise of             Examples include students (mode one) and their teachers
social media has made people more aware of networks and                   (mode two); nations (mode one) and the treaties to which
has given them tools to facilitate intentional networking.                they are signatories (mode two); and people (mode one)
Second, data on social networks have become more widely                   and the events that they participate in (mode two). Bipartite
available on a diversity of topics of social relevance, such              networks differ from the classic one-mode network formu-
as the spread of false information, joint business ventures,              lation (in which A is directly tied to B) by the introduction
attacks on computer networks, migration, lobbying, dis-                   of an intermediary object (such as when A attends Event 1
                                                                          and B also attends Event 1), which then provides a context
ease transmission and friendship. Third, computer tech-
                                                                          for the relationship between the actors. Despite the intro-
nologies have developed to facilitate the processing and
                                                                          duction of this extra step, the relevance of this connection
analysis of the large and complex data sets that accompany
                                                                          is immediately recognized in many situations. For example,
social networks. Fourth, new statistical tools and software
                                                                          if A and B are both graduates of the University of Delhi,
have made network analysis methods more accessible to a                   then the connection between them is usually realized if the
wider community of scholars and have made them more                       two are introduced to one another, when employers are con-
comparable to traditional statistical methods.                            sidering them for jobs, when journalists are writing about
   Bipartite networks, also known as two-mode networks                    them in news stories and so on.
or affiliation networks, are a particularly interesting                       Social network scholars have long been attentive to
and useful class of networks. This class is defined by the                bipartite networks and have established a variety of

1
    School of Social and Political Sciences, University of Glasgow, UK.

Corresponding author:
Michael T. Heaney, University of Glasgow, School of Social and Political Sciences, Adam Smith Building, Bute Gardens, Glasgow, G12 8RT, UK.
E-mail: michaeltheaney@gmail.com
128 IIM Kozhikode Society & Management Review 10(2)
methods to examine them (Brieger, 1974; Davis et al., from midnight to 11am (Coordinated Universal Time) on
1941; Jasny & Lubell, 2015). One method to arrive on the 21 April 2021. This approach followed well-established
scene recently is the two-mode Exponential Random procedures for gathering social network data from cyber-
Graph Model (ERGM), as described by Wang et al. (2009). space (Steinert-Threlkeld, 2018). Initially, 1,319 tweets
Two-mode ERGMs enable the estimation of network were assembled, excluding retweets and mentions. All
parameters at a single point in time or in discrete time hashtags (which are insensitive to capitalization) were
segments. Another emerging method is the Relational extracted from the tweets to determine which were the
Event Model (REM), as described by Butts (2008). REMs most common hashtags related to #RamNavami. Hashtags
enable the estimation of network parameters over a could be written in any language, as long as they used the
continuous, ordered time sequence. Latin/Roman alphabet. So hashtags written in Devanagari
The emergence of multiple methods for examining two- script (used for writing in Hindi) were not included in the
mode networks affords flexibility to scholars in how to analysis, a nontrivial limitation given the context.
approach bipartite network problems. At the same time,
From this initial set of tweets, two subsets were created:
they create some confusion for scholars who many be
(a) a data set containing only hashtags that had been used
unsure of which methods are most applicable in any given
two or more times (excluding #RamNavami, which was in
situation. The purpose of this short article is to illustrate the
all tweets by design), and (b) a data set containing only the
use of two-mode ERGMs and REMs using a simple, con-
top 30 hashtags. The first data set consists of 5,373 edges
temporary data set. To this end, tweets using the hashtag
(i.e., sender-hashtag pairs), while the second consists of
#RamNavami on 21 April 2021 were collected. Ram
Navami is a spring festival and holiday that is celebrated in 3,128 edges.
India and by Hindu people around the word. It is an obser- Some appreciation for the nature of the data can be
vance of the birthday of Lord Ram, the seventh incarnation gleaned by considering the list of the top 30 hashtags listed
of Vishnu. This data set allows the demonstration of multi- in Table 1. Some of the most popular hashtags also made
ple analytic approaches to a simple, two-mode network, reference to Ram Navami but varied slightly from the spe-
while also revealing how an ancient holiday is situated in cific hashtag that was used to identify the network, such as
the electronic communications of today’s society. #ramnavami2021. Other hashtags made religious refer-
ences, such as #navratri and #hindu. Still others alluded to
the Covid pandemic sweeping India and the world at large,
The Data and the Network such as #staysafe and #stayhome. Hashtag coding was per-
formed by graduate students fluent in Hindi and English.
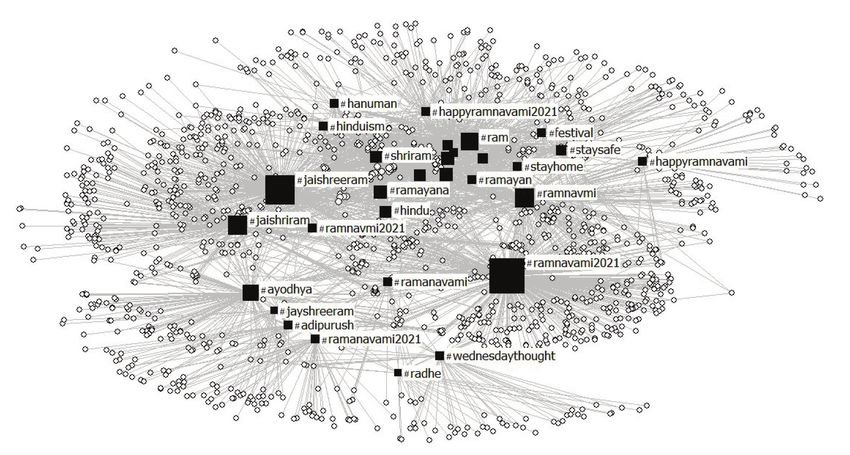
Tweets that used the hashtag #RamNavami were collected The network processes related to #RamNavami are
using the Twitter API (Application Programming Interface) evident in Figure 1. In this graph, white circles represent
Table 1. Top 30 Hashtags in the Ego-Network for #RamNavami on 21 April 2021.
Hashtag Count Hashtag Count
#ramnavami2021 468 #ramanavami2021 58
#jaishreeram 370 #ramanavami 56
#ramnavmi 224 #ramnavmi2021 56
#jaishriram 210 #festival 53
#ram 179 #wednesdaythought 53
#ayodhya 164 #rama 50
#india 117 #stayhome 49
#lordrama 116 #adipurush 47
#ramayana 108 #hinduism 47
#shriram 94 #happyramnavami2021 40
#hindu 92 #hanuman 38
#sitaram 79 #happyramnavami 38
#lordram 78 #ramayan 37
#navratri 70 #jayshreeram 35
#staysafe 67 #radhe 35
Source: https://developer.twitter.com/en/solutions/academic-researchHeaney 129
Figure 1. Ego Network for #RamNavami based on Top 30 Hashtags.
Source: https://developer.twitter.com/en/solutions/academic-research
Twitter users, while the black squares represent the top 30 have been the target of extensive criticism (see Cranmer
hashtags in the ego network for #RamNavami. This graph et al., 2021). The substance of the criticism is that dyads
was generated using the spring-embedding algorithm in are often unlikely to be independent on one another, as is
Netdraw 2.168 (Borgatti, 2002), which draws points closer assumed by the Logit model. For example, a (hypothetical)
to one another based on minimizing tension in the graph. attack by Pakistan on India is unlikely to be independent of
Not all of the labels for hashtags are included in the figure a subsequent (hypothetical) attack by the United States on
due to visibility issues. Some structures apparent in the data Pakistan; the crisis fomented by the first attack conditions
include the approximate co-location of #staysafe and #stay- the strategic logic governing the second attack. Nonetheless,
home, both references to the Covid pandemic. Similarly, the it may be helpful to set the Logit model as a baseline for
near co-location of religiously themed hashtags, #hinduism comparison, as it is widely understood by scholars. Also, it
and #hanuman, provides evidence for the relevance to is possible that in some situations, it may be reasonable to
religion on the network structure. Finally, there appear to be assume dyadic independence, in which case a Logit model
structural holes (Burt, 1992) between the denser top part of may be preferred.
the network and the sparser bottom part of the network. Despite our familiarity with Logit, the advantage of
These casual observations may (or may not) be of inter- ERGMs is that they allow the user to specify the network
est to the reader. Yet, if we wish to truly understand the dependencies that may be present in the data generating
network generating processes behind these data, we require process. For example, system behaviour may exhibit reci-
formal statistical tools, which are considered in the next procity, transitivity, preferential attachment, homophily or
section. other endogenous network tendencies (Lusher et al., 2013).
Thus, ERGMs enable the specification and assessment of
network processes in the data, which may both address
The Analysis of Bipartite Networks dependencies and yield substantively relevant knowledge.
However, ERGMs do face limitations. While restricting
No single approach to two-mode networks should domi- the data to discrete time periods may not be a problem in
nate any other. Rather, there are different situations in many applications, in other cases, it may miss crucial
which one approach may be preferred to others. Dyadic elements of the problem. In examining tweets, for exam-
Logit models have been applied to topics such as the study ple, the sequence may be of special interest, requiring a
of international conflict and alliances, though these models continuous-time model. Additionally, ERGMs tend to130 IIM Kozhikode Society & Management Review 10(2)
suffer from estimation difficulties resulting in degeneracies focus variables, an edges term (the analog to the constant
that make it impossible to estimate certain models. In these term for ERGM) and an endogenous term for Twitter users
cases, it may be necessary to turn to other approaches to that contributed at least two hashtags to the network. The
estimate network parameters. inclusion of this endogenous term represents a minimal
The added value of REMs is that they incorporate specification for the endogenous element of the network
continuous time into network models, provided that the that is required to effectuate an ERGM. That is, without
assumption is made that no two events happen at the exact such a term, the ERGM would be equivalent to a Logit.
same time (Butts, 2008). Sequence statistics can be easily Model 3 used a REM estimator that incorporated the unfold-
constructed in order to investigate how events relate to one ing of time during the 11 hours for which the data were
another. However, current estimation procedures, such as collected. Sequence statistics were specified to approximate
those conducted using the informR package in R, limit the the variables in the Logit and ERGM models. The results
number of events (e.g., hashtags) that can be included in of these exercises are reported in Table 2. The R code
the estimation (Marcum & Butts, 2015). Further, including necessary to reproduce them is reported in the Appendix.
network attributes in REMs is not as straightforward as it is Comparison of the estimates of Models 1 and 2 indi-
for ERGMs. cates a very close match. Both models report that the coef-
In light of these considerations, this article presents ficient on Hashtag Reference to Ram Navami is significant
three simple models of the #RamNavami ego network and negative, documenting that these hashtags had a less
using Logit, ERGM and REM estimators. In each case, than typical chance of being coupled with other hashtags.
variables are included for three hashtag characteristics: The coefficient on Hashtag Religious Connotation is posi-
(a) direct reference to Ram Navami, (b) religious connota- tive and significant, thus showing that these hashtags had a
tions (other than Ram Navami) and (c) reference to the greater than typical chance to be combined with other
Covid pandemic. These models are compared and then one hashtags. Both models display borderline significant coef-
extension is considered for each model. ficients on Hashtag Covid Pandemic Reference, with
Model 1 just above the significance threshold and Model 2
just below it. The endogenous term in Model 2 is signifi-
Model Comparisons cant and negative, demonstrating that two hashtags by the
same sender was less common in this network than was the
Three models were estimated and are reported in Table 2. case for randomly generated networks with the same size
Model 1 used a Logit estimator including the three focus and parameters. The significance on this term establishes
variables and a constant term (which is standard for this that the hypothesis of dyadic independence should be
approach). Model 2 used an ERGM estimator with the three rejected. Nonetheless, the estimates of the Logit (which
Table 2. Logit, ERGM, and REM Models for the #RamNavami Ego Network.
Model 2
ERGM
Model 1 Coefficient Model 3
Parameter Logit (Standard Error) REM
Hashtag Reference to Ram Navami –0.342 * –0.347 * 1.980 *
(0.049) (0.048) (0.159)
Hashtag Religious Connotation 0.560 * 0.562 * 0.080
(0.047) (0.049) (0.288)
Hashtag Covid Pandemic Reference 0.173 0.178 * 3.514 *
(0.089) (0.087) (0.532)
Constant / Edges –2.879 * –2.888 *
(0.042) (0.044)
Endogenous Term for Two Tweets by Same User –0.527 *
(0.070)
Akaike information criterion (AIC) 21,333 21,270 15,818
Bayesian information criterion (BIC) 21,368 21,313 15,835
Source: https://developer.twitter.com/en/solutions/academic-research
Note: * p ≤ 0.05.Heaney 131
assumes dyadic independence) and the ERGM (which Since the informR software has limitations on the num-
assumes dyadic dependence) lead to substantively very ber of events that it can model for two-mode data (Marcum
similar conclusions. & Butts, 2015), all models were paired down to only 30
The REM estimates, which take into account the tempo- hashtags. Since ERGM does not suffer from this limitation,
ral ordering of the data, suggest substantive conclusions it is possible to consider an extension to a dataset with all
that are virtually opposite to those derived from Logit and hashtags used two or more times. The reason for setting the
ERGM. They show a positive and significant coefficient limit at two is that any hashtag used only once merely adds
on Hashtag Reference to Ram Navami, thus suggesting an noise to the network structure, while at the same time
effect in the opposite direction of the Logit and ERGM. threatening to prevent statistical convergence.
Unlike the Logit and ERGM results, the coefficient on Finally, it is standard for REMs to include intercepts for
Hashtag Religious Connotation is insignificant. In contrast each event in the model. This feature was suppressed in
to Model 1 and 2, the coefficient on Hashtag Covid Pandemic Model 3, with the goal of making the three models as com-
Reference is positive and statistically significant. These parable as possible. Now it is possible to relax that restric-
coefficients demonstrate that viewing the data through a tion and add event intercepts to the model, which is typical
temporal lens makes a considerable difference. for REMs.
Three model extensions were estimated. Model 4 is a
One implication of these results is that, at least for this
Logit that incorporates parameters for sender characteris-
dataset, the Logit and ERGM approaches are virtual substi-
tics. Model 5 is an ERGM estimated on all hashtags with
tutes for one another. While the ERGM estimates do dem-
two or more appearances in the data. Model 6 is a REM
onstrate that the data generating process is dyad dependent,
that adds event intercepts for all events, except for the base
this dependence does not have severe consequences for the
category, #ramnavami2021, which was the single most
parameter estimates. Thus, it may be reasonable to extend
popular hashtag in the #RamNavami ego network. The
the Logit to a range of data not feasible for ERGM estima-
results of this estimation are reported in Table 3.
tion. However, this conclusion should not be generalized
The model extensions reported in Table 3 add insights
because if dyadic dependence was stronger in the network, to the network generating processes beyond what was
then the resulting Logit estimate could be far off the mark. evident in Table 2. The Logit results in Model 4 contain a
A second implication of these results is that the researcher negative and statistically significant coefficient on Sender
must be careful in choosing between discrete-time and Tweets, indicating that senders who are more active on
continuous-time specifications. In this case, at least, the Twitter were less likely to contribute edges to this network.
two approaches produce drastically different results. The coefficients on Sender Accounts Followed and Sender
Consequently, it is necessary to carefully theorize whether Followers are numerically very small and statistically
or not time is expected to be a critical element of the prob- insignificant. A reasonable speculation is that the relatively
lem at hand. More specifically, a key question is whether the miniscule magnitude for all three sender coefficients
sequence of events is expected to matter in generating the explains why the ERGM would not converge when they
outcomes of interest. If yes, then REM is the obvious choice. were inserted in the specification. It is relevant to note that
If no, then ERGM (or possibly Logit) is more suitable. neither the direction nor the significance of the parameters
on the hashtag attributes change in Model 4 when com-
pared to Model 1.
Model Extensions Model 5 reflected an expansion of the data examined in
comparison to Model 2. The extant software for ERGM
The three models reported in Table 2 were specified to estimation was able to manage the vastly expanded number
make them as similar as possible, thus centring the discus- of hashtags (516 instead of only 30) more routinely than is
sions on the methods of estimation. Having considered possible with the extant software for REM estimation. This
these models, it is possible to investigate extensions of increased information is consequential for model estima-
each approach. As mentioned earlier, the ERGM approach tion. Hashtag Reference to Ram Navami switches from a
frequently suffers from degeneracy such that some models significant, negative coefficient to a significant, positive
are not estimable. This problem is present in a case at hand, coefficient. The coefficient on Hashtag Covid Pandemic
as Model 2 did not converge when sender characteristics Reference appears now as positive and significant, whereas
were added to the specification. Hence, all the models were it was insignificant in Model 2. Other parameters in
paired down to omit these characteristics. Now, since the Model 5 did not change their significance and direction in
Logit model is not commonly plagued with degeneracy comparison to Model 2.
issues, it is possible to consider an extension of this model Model 6 extended the REM to incorporate intercepts for
to incorporate sender characteristics. 29 of the top 30 hashtags, consistent with typical REM132 IIM Kozhikode Society & Management Review 10(2)
Table 3. Extensions of Logit, ERGM, and REM Models.
Model 5
ERGM
Model 4 Coefficient Model 6
Parameter Logit (Standard Error) REM
Sender Accounts Followed 0.000
(0.000)
Sender Followers 0.000
(0.000)
Sender Tweets –4 e–6 *
(1e–6)
Hashtag Reference to Ram Navami –0.343 * 2.181 * 0.929 *
(0.048) (0.040) (0.169)
Hashtag Religious Connotation 0.560 * 1.344 * –1.025 *
(0.047) (0.033) (0.293)
Hashtag Covid Pandemic Reference 0.173 0.640 * 4.017 *
(0.089) (0.059) (0.542)
Constant / Edges –2.842 * –5.996 *
(0.042) (0.028)
Endogenous Term for Two Tweets by Same User –0.145 *
(0.065)
#jaishreeram –0.041
(0.092)
#staysafe –1.571 *
(0.148)
#ramnavmi –0.434 *
(0.096)
#ramanavami2021 –2.735 *
(0.250)
#ramnavmi2021 –1.887 *
(0.172)
#stayhome –1.794 *
(0.161)
#ram –0.436 *
(0.102)
#jayshreeram –2.717 *
(0.251)
#wednesdaythought –2.084 *
(0.188)
#jaishiram –0.601 *
(0.105)
#hindu –1.073 *
(0.124)
#lordrama –0.896 *
(0.116)
#ayodhya –0.896 *
(0.116)
#adipurush –2.116 *
(0.190)
#rama –1.766 *
(0.163)
#lordram –1.361 *
(0.138)
(Table 3 continued)Heaney 133
(Table 3 continued)
Model 5
ERGM
Model 4 Coefficient Model 6
Parameter Logit (Standard Error) REM
#navratri –1.507 *
(0.147)
#shriram –1.119 *
(0.126)
#ramayan –1.967 *
(0.178)
#festival –1.722 *
(0.160)
#ramanavami –1.700 *
(0.159)
#happyramnavami –2.842 *
(0.266)
#india –0.868 *
(0.115)
#ramayana –0.877 *
(0.115)
#happyramnavami2021 –2.292 *
(0.206)
#sitaram –1.246 *
(0.132)
#hanuman –1.939 *
(0.176)
#hinduism –1.722 *
(0.160)
#radhe –2.459 *
(0.222)
Akaike information criterion (AIC) 21,305 58,663 14,627
Bayesian information criterion (BIC) 21,366 58,722 14,812
Source: https://developer.twitter.com/en/solutions/academic-research
Note: * p ≤ 0.05.
specifications. Almost all (28 of 29) of the coefficients on cognitive and social structures that mould the internet.
these intercepts are significant and negative due to the fact Models of bipartite networks afford scholars tools to inves-
that the base category is the most commonly used hashtag; tigate how these processes work (or do not work).
all other hashtags are less likely in comparison. These new Firm conclusions about the network processes around
model terms do not affect our conclusions about the #RamNavami cannot be drawn from the statistical results
Hashtag Reference to Ram Navami or Hashtag Covid at hand. The estimated models displayed sensitivity to data
Pandemic Reference variables. However, the parameter on selection criteria, the time scale of the analysis, parameter
Hashtag Religious Connotation is significant and negative specification and the statistical estimator chosen. Moreover,
in Model 6, where it was insignificant in Model 3. the scope of the example data on which the analysis relied
was starkly narrow, linking primarily to the use of one
hashtag on one day.
Conclusion
Nevertheless, this article highlights critical choices to
Social media helped people to transmit greetings related to be made in the research design in the study of two-mode
the Hindu festival of Ram Navami, even during the siege networks like the #RamNavami ego network. First, it is
of an unprecedented global plague. These messages necessary to decide if the dyads in the network can be
were not disseminated randomly but travelled through the assumed to be independent (as is the case with Logit) or if134 IIM Kozhikode Society & Management Review 10(2) it is prudent to account for network dependence (as is pos- Attributes_Two_or_More_Hashtags
Heaney                                                                                                                          135

Model_02
You can also read


