Risk Analysis of Urban Dirty Bomb Attacking Based on Bayesian Network - MDPI
←
→
Page content transcription
If your browser does not render page correctly, please read the page content below
sustainability

Article
Risk Analysis of Urban Dirty Bomb Attacking Based
on Bayesian Network
Zheng Tang 1 , Yijia Li 1 , Xiaofeng Hu 1, * and Huanggang Wu 2
 1    School of Information Technology and Network Security, People’s Public Security University of China,
      Beijing 102628, China; tztangzheng@foxmail.com (Z.T.); ppsucLiyijia@163.com (Y.L.)
 2    School of International Police Studies, People’s Public Security University of China, Beijing 102628, China;
      wuhuanggang@ppsuc.edu.cn
 *    Correspondence: huxiaofeng@ppsuc.edu.cn

 Received: 26 October 2018; Accepted: 2 January 2019; Published: 9 January 2019

 Abstract: Urban dirty bomb attacking is a type of unconventional terrorism threatening the urban
 security all through the world. In this paper, a Bayesian network of urban dirty bomb attacking
 is established to analyze the risk of urban dirty bomb attacking. The impacts of factors such as
 occurrence time, location, wind fields, the size of dirty bomb, emergency response and defense
 approaches on casualty from both direct blast and radiation-caused cancers are examined. Results
 show that sensitivity of casualty from cancers to wind fields are less significant; the impact of
 emergency response on the direct casualty from blast is not large; the size of the dirty bomb results in
 more casualties from cancers than that from bomb explosions; Whether an attack is detected by the
 police is not that related to normal or special time, but significantly depends on the attack location;
 Furthermore, casualty from cancers significantly depends on the location, while casualty from blast
 is not considerably influenced by the attacking location; patrol and surveillance are less important
 than security check in terms of controlling the risk of urban dirt bomb, and security check is the most
 effective approach to decreasing the risk of urban dirty bomb.

 Keywords: risk analysis; dirty bomb; Bayesian network; terrorism

1. Introduction
     Urban dirty bomb attacking is a type of unconventional terrorism. At the onset of an attack, the
attacker would use a radiological dispersal device (RDD), containing radioactive materials which
can be released from an explosion and transported to other areas by wind. Due to the difficulty of
obtaining, storing and transporting the radioactive material and creating the dirty bomb, it seems
unachievable to successfully make a terrorist dirty bomb attack, especially in urban areas where
security conditions are often better than rural areas. In fact, based on the global terrorism database
(GTD) [1], no successful dirty bomb attacking has been reported.
     Although the shocking 11 September 2001 terrorist attack didn’t include radioactive material,
Bin Laden had attempted to conduct dirty bombs into this event [2], and there were also several
similar incidents recorded in GTD. There is no doubt that a terrorist dirty bomb attack can lead to
more devastating consequences for the public, government, society and economy than other types of
terrorist attacks. Besides direct blast from TNT, people can also be injured and even killed by release of
radioactive materials, which may cause cancer or other diseases. Thus, people often have great fear
of radiations in such kind of events. The desolate and uninhabited ruins caused by the pollution of
radioactive materials in the Chernobyl and Fukushima nuclear accidents are the best examples [3]
     However, that no successful attacks have happened doesn’t mean no attempt to make a dirty
bomb attack. This is significant for us to try to do research on urban dirty bomb attack.

Sustainability 2019, 11, 306; doi:10.3390/su11020306                          www.mdpi.com/journal/sustainability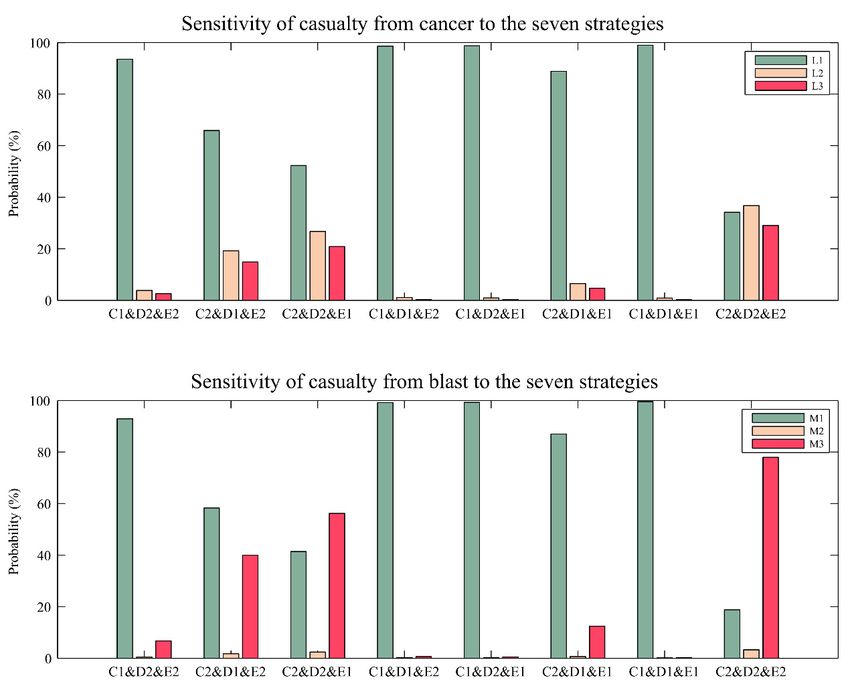
Sustainability 2019, 11, 306                                                                       2 of 12

2. Related Work
     Many previous studies [4–7] focused on dirty bomb attacking. Rosoff and Winterfeldt used a
combination of several risk analysis tools to assess the consequences of attacks, including human
health and economic impacts, but without considering the impacts of policing [8]. Jeong et al. assessed
the potential impacts of radioactive terrorist attacks on human health assuming drinking water was
contaminated by radioactive terrorist attacks in the metropolitan area of Seoul, Korea [9]. Jeong et al.
also assessed the potential and actual effects on human health from an inhalation event due to a
radiological terrorist attack in the same area by both Gaussian and CFD modelling [10]. Similarly,
Reshetin used a Gaussian model to estimate the maximum inhalation doses, the spatial extent and
radioactivity of contamination within an urban area after the initial dispersion of 90 Sr radiological
dispersion device (dirty bomb) in a terrorist activity [11]. Andersson et al. used a decision support
system ARGOS, which is able to estimate the consequences of terror attacks involving chemical,
biological, nuclear and radiological substance, to calculate the dose contributions from contaminants
dispersed in the atmosphere after a ‘dirty bomb’ explosion [12]. Hu et al. proposed an assessment
method of radiation dose in terrorist dirty bomb attacks based on WRF, which is developed by
implementing the radioactive decay process into source term and ground dry and wet deposition [13].
     It is obvious that most of the previous studies focused on radiation dose estimation based on
numerical simulation methods, often examining the distribution of potential radiological materials
in a dirty bomb attacking. However, few research studied the impacts of environmental and social
factors on the occurrence probability and the consequences of urban dirty bomb attacking.
     Thus, we try to study how environmental and social factors influence the probability of the risk
happening and consequences of urban dirty bomb attacking by Bayesian Network (BN), it is adopted
in the paper to evaluate the occurrence probability and the consequences of urban dirty bomb attacking
since it has certain advantages in the representation of complex relation, uncertain probabilities and
causal relationship.
     In fact, Bayesian network has been widely applied in many fields. In the field of network
security, Bayesian network was used to assess the online public opinions and to predict the interactive
relationship among different people [14]; In the field of emergency management, Bayesian network
model was constructed to predict emergencies and to assess the main states and loss consequences [15];
In the field of fault diagnosis, Bayesian network (BN) is increasingly utilized in fault diagnosis to
effectively deal with various uncertainty problems [16]. Bayesian network model was integrated with
event tree and other models to investigate emergency response experiences contained in massive
emergency cases [17]; A dynamic-Bayesian-network-based evaluation methodology was used to
predict the resilience value of an engineering system [18]. Bayesian network was also used to analyze
the usual causes of failures and the dependencies among the variables in dust explosion scenarios [19];
Similarly, it turned out to be effective that the scenario analysis was combined with Bayesian network to
evaluate the occurrence probability of mine water inrush accident and the hazard evolution, performing
the disaster response [20]. Bayesian network can also construct and verify the reliability of the
model and be used in the procedures of automatic creation of conditional probability tables [21,22].
Furthermore, Fu et al. proposed a method that combined Bayesian network with the principle of case
suitability to make early warning on terrorist attacks [23]. Pat-Cornell and Guikema proposed a model
for setting priorities among threats and countermeasures based on probabilistic risk analysis, decision
analysis, and elements of game theory [24]. The literature above shows that Bayesian network has
certain feasibility and validity in solving uncertain problems.
     In this paper, a Bayesian network of urban dirty bomb attacking is established based on cases
studies and expert judgments to examine how wind fields, size of dirty bomb, emergency response
and defense approaches affect the casualty caused by both direct blast and cascading cancers. In this
paper, the Tai-Yang-Gong area in Chaoyang District of Beijing (TYG) is selected as the research object,
and the experts in the police station of the Tai-Yang-Gong area in Chaoyang District of Beijing (TYG
police station) also provide several judgments for establishing the Bayesian network. The reason why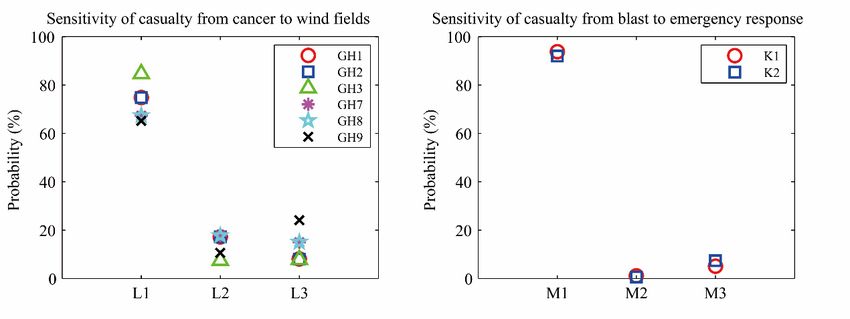
Sustainability 2019, 11, 306                                                                       3 of 12

the TYG area is chosen as a target subject is that the TYG area with a high population density has a
relatively high crime rate in Beijing despite the good policing conditions. Moreover, in this area, there
are different types of targets including shopping malls, residential areas, parks, schools, hotels etc.
Thus, it is typical for the risk analysis of urban bomb attacking as well as investigation of the impacts
those main factors may have on this kind of event.

3. Methodology and Data Sets

3.1. Bayesian Network Building
     Bayesian Networks are joint probability distributions between multiple variables expressed
as directed acyclic graphs consisting of a set of nodes, a set of edges, and conditional probability
tables [25], and there are normally three steps to build a Bayesian network.
     Firstly, determining the Bayesian network node variables and their state classification, which
could take advantage of case studies and expert judgments, especially for the problems that are not of
massive occurrences and detailed records. The nodes in the network represent the factors which can
influence the event. Classifying different states of nodes may have different influences on other nodes.
     Secondly, confirming the structure of Bayesian network, i.e., the casual relationship of Bayesian
network nodes. The casual relationship is represented by a set of directed edges, and the direction
is pointed from parent nodes to child nodes. The casual relationship of the Bayesian network is
determined by data samples for Bayesian network structure learning when enough historical data
samples are available, while the structure of Bayesian network is usually determined by expert
judgments when useful data samples are inadequate.
     Thirdly, determining the conditional probabilities of all nodes. The prior probability of parent
nodes should be determined in the conditional probability tables at the beginning, and it is often based
on experts’ experience or real data. The probabilities of events represented by child nodes are only
influenced by the probabilities of events represented by parent nodes, thus the parameter adjustment
of parent nodes would result in probability changes of child nodes. In this step, some machine learning
algorithms or expert judgments weighted by the Demptster-Shafer evidence theory are conducted to
obtain the conditional probabilities [26,27].
     After finishing the steps above, the Bayesian network with conditional probabilities can be
established to analyze target problems.
     In this paper, we establish the Bayesian network (as shown in Figure 1) with 13 basic nodes by
combining previous studies and experts’ experience. With this Bayesian network, the evolution of
urban dirty bomb attacking can be presented in detail. Each Bayesian network node is described as
follows:

A.      Time. The occurrence time of dirty bomb attacking can be classified into two states according
        to the expert system in the TYG police station, which are ‘normal time’ and ‘special time’.
        Special time refers to Spring Festival, National Day and other holidays when crime incidents are
        expected to increase and security check, surveillance and patrol are to be enhanced, while on
        normal time the security level is lower, and dirty bomb attackers may easily determine a proper
        place and fix some time to explode the bomb.
B.      Location. In the TYG area, urban dirty bomb attacking may occur at three different types of
        places, which are ‘business quarter’, ‘residential quarter’ and ‘open space’, corresponding to
        the three states of this node. Obviously, locations with different population density may have
        different demands for police deployment.
C.      Security check. Security check aims to find contraband and dangerous persons by checking
        people or vehicles in the TYG area. According to experts in the TYG police station, security
        check is classified into two states, which are ‘yes’ and ‘no’.
D.      Surveillance. Surveillance means monitoring the specific areas by Closed-Circuit Televisions
        (CCTV) and sending relevant image or video data to the police, assessing the security condition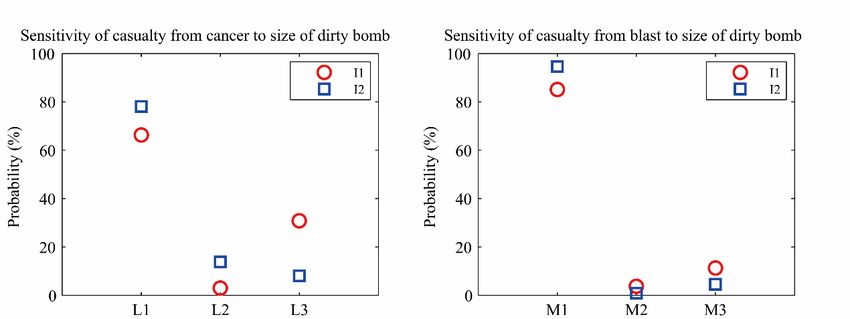
Sustainability 2019, 11, 306 4 of 12
Sustainability 2019, 11, x FOR PEER REVIEW 4 of 12
for public. Experts in the TYG police station argue that surveillance have two states, which are
‘24-h-covering’
condition for public. and ‘non-24-h-covering’.
Experts in the TYG police station argue that surveillance have two states,
E. which
Patrol. Patrol refers
are ‘24-h-covering’ to theandfact‘non-24-h-covering’.
that police walk around the area to check which parts are out of
E. Patrol. Patrol refers to the fact thatTYG
trouble or danger. Experts in the police station
walkpoint
around outthe
thatarea
there
to are
checktwowhich
typesparts
of patrol states
are out of
in terms
trouble or of patrol Experts
danger. frequency, thatTYG
in the is, ‘>2 times’point
station and ‘2Information
times’ and ‘ 45 kg & Pu data > (2014–2016)
5 kg’ and ‘TNT from< 45rp5kgwebsite.
& Pu < 5 kg’ are two main types
I. Size
when of itdirty
comes bomb.
to the‘TNT
size of > 45 kg bomb.
dirty & Pu >The 5 kg’
sizeand ‘TNTbomb
of dirty < 45 directly
kg & Puinfluences
< 5 kg’ are thetwo degreemainof
types whenfrom
casualties it comes
both tobomb the blast
size ofanddirty bomb. The size of dirty bomb directly influences the
cancers.
J. degree
Policeof casualties‘Yes’
detection. fromand both bomb
‘No’ are blast
generalandanswers
cancers.to the question whether dirty bomb can
J. Police detection. ‘Yes’ and ‘No’ are general answers to the question whether dirty bomb can be
be detected.
K. detected.
Emergency response. From the perspective of timing, government, police and other
K. Emergency
organizations response.
generally Fromhavethe‘onperspective
time’ or ‘delay’of timing,
emergency government,
responses police and other
to urban dirty
organizations
bomb attacking. generally have ‘on time’ or ‘delay’ emergency responses to urban dirty bomb
L. attacking.
Casualty from cancers. Casualty from cancers is an important indicator to evaluate the
L. Casualty
consequences from of cancers.
urban dirty Casualty
bombfrom cancers
attacking. Basedis on
an the
important
Production indicator to evaluate
Safety Accident the
Report,
consequences of urban dirty bomb attacking. Based on the
the Investigations and Handling Rules, China, simultaneously simulated by the softwareProduction Safety Accident Report,
the Investigations
HotSpot (established andbyHandling
Department Rules, China,Office
of Energy, simultaneously
of Emergency simulated
Operations by and
the Lawrence
software
HotSpot
Livermore (established by Department
National Laboratory of Energy,
(LLNL), and used Office of Emergency Operations
for safety-analysis of DOE facilitiesand Lawrence
handling
Livermore National Laboratory (LLNL), and used for safety-analysis
nuclear material) [28], casualty from cancers has three types of representation, that is ‘less of DOE facilities handling
than
nuclear material) [29], casualty from cancers has three types of representation,
10 deaths or less than 50 injured’, ‘11 to 30 deaths or 51 to 100 injured’ and ‘more than 30 deaths that is ‘less than
10ordeaths
more than or less
100 than
injured’.50 injured’, ‘11 to 30 deaths or 51 to 100 injured’ and ‘more than 30
deaths or more than 100 injured’.
M. Casualty from blast. Casualty from blast has the same classification criteria as casualty from
M. Casualty from blast. Casualty from blast has the same classification criteria as casualty from
cancers, i.e., “less than 10 deaths or less than 50 injured”, “11 to 30 deaths or 51 to 100 injured”
cancers, i.e., “less than 10 deaths or less than 50 injured”, “11 to 30 deaths or 51 to 100 injured”
and “more than 30 deaths or more than 100 injured”.
and “more than 30 deaths or more than 100 injured”.
Figure 1. Bayesian network of urban dirty bomb attacking.
3.2. Probability Distribution of Bayesian Network Nodes
The Dempster-Shafer evidence theory first proposed by Dempster and developed by Deutsch
and Yager and Liu further [26,27], can be used to deal with uncertain information. To deduce the
lack of stability in the posterior probability estimation of the conditional probability table (CPT) inSustainability 2019, 11, 306 5 of 12
the Bayesian network based on experts’ practice, we introduce the evidence theory to analyze the
expert scoring.
Since expert system is one of the most effective approaches to the problem of insufficient
historical statistics, we collect the probabilities by questionnaire from experts. In this step, four
experts’ judgement data are processed by Dempster-Shafer evidence theory.
The Dempster-Shafer evidence method defines a frame of discernment and the Mass function,
but the Mass function needs to meet the following conditions:
m(φ) = 0
∑ m( A) = 1 (1)
A⊆Θ
where m(A) is the Mass function of event A, which is also the basic probability function of discernment
Θ. The synthesis rule of Dempster-Shafer evidence is shown in Equation (2).
1
K ∑ m1 ( A1 ) · m2 ( A2 ) · . . . m N ( A N ), A 6 = φ
m( A) = A1∩ A2∩...∩ A N (2)
0, A = φ
where, m1 , m2 , . . . , mN are the basic probability functions of discernment Θ, and K represents the
conflict degree among m1 , m2 , . . . , mN , which is calculated as follows:
K= ∑ m1 ( A1 ) · m2 ( A2 ) · . . . m N ( A N ) = 1 − ∑ m1 ( A1 ) · m2 ( A2 ) · . . . m N ( A N ) (3)
A1∩ A2∩...∩ A N 6=φ A1∩ A2∩...∩ A N =φ
Take the Node C i.e., “security check” for example. The prior probability distribution of “security
check” depends on the combination of “Time” and “Location”, and its probability distributions
respectively given by four experts are shown in Table 1. m1 (1, 2), . . . , m4 (1, 2) represent the probability
distributions given by four experts, where m1 (1, 2) with the value (0.5, 0.5) means that the first
expert thought the probability of “security check” is 0.5 on the premise that the combination of
time and space are “normal time” and “business quarter”, and the probability of no “security
check” is also 0.5. Based on Equations (2) and (3), the prior probability of “security check” is
calculated as follows: K = m1 (A1 )·m2 (A1 )·m3 (A1 )·m4 (A1 ) + m1 (A2 )·m2 (A2 )·m3 (A2 )·m4 (A2 ) = 0.22, m(A1 )
= (1/K)·m1 (A1 )·m2 (A1 )·m3 (A1 )·m4 (A1 ) = 0.982.
Just like as has been presented above, we use Dempster-Shafer evidence theory to deal with the
judgement data from different experts to determine the conditional probabilities of other nodes.Sustainability 2019, 11, 306 6 of 12
Table 1. States of Bayesian nodes.
Nodes States of Bayesian Nodes Basis
A. Time (1) normal times; (2) special times Experts’ experience
B. Location (1) business quarter; (2) residential quarter; (3) open space Experts’ experience
C. Security check (1) yes; (2) no
Real working time and location of CCTVs; check points
D. Surveillance (1) 24-h-covering; (2) not 24-h-covering
and patrolling of TYG police office
E. Patrol (1) >2 times; (2) 1000/km2 ; (2) 500~1000/km2 ; (3) 6 m/s The meteorological data (2014~2016) from rp5 website
H. Wind direction (1) east; (2) north; (3) northeast The meteorological data (2014~2016) from rp5 website
I. Size of dirty bomb (1) TNT > 45 kg & Pu > 5 kg; (2) TNT < 45 kg & Pu < 5 kg Experts’ experience
J. Police detection (1) yes; (2) no Experts’ experience
K. Emergency response (1) on time; (2) delay Experts’ experience
(1) less than 10 persons (less than 50 injuries); Simulated by hotspot; also by expert system;
L. Casualty from cancers (2) 11 to 30 persons (51 to 100 injuries); The Production Safety Accident Report, the
(3) more than 30 persons (more than 100 injuries) Investigations and Handling Rules, China
(1) less than 10 persons (less than 50 injuries); Experts’ experience;
M. Casualty from blast (2) 11 to 30 persons (51 to 100 injuries); The Production Safety Accident Report, the
(3) more than 30 persons (more than 100 injuries) Investigations and Handling Rules, ChinaSustainability 2019, 11, 306 7 of 12
4. Results and Discussions
In this study, we examine the sensitivities of consequences of urban dirty bomb attacking to
different factors based on different states of Bayesian network nodes, assessing the impacts of different
factors on risk happening and potential casualties in attacking activities. Then we evaluate the
effectiveness of the defense approaches, namely security check, surveillance and patrol for decreasing
the risk happening of urban dirty bomb attacking and the casualties from both direct explosion and
cancers. As shown in Table 2, those sensitivity cases are carried out.
Table 2. Experts’ judgmental data and the final condition probabilities of the node.
Calculated
Causal Relationship Element Experts’ Judgement
Results
m(T) of Security
Time Location m1 (1, 2) m2 (1, 2) m3 (1, 2) m4 (1, 2)
check
normal times business quarter (0.5, 0.5) (0.6, 0.4) (0.8, 0.2) (0.9, 0.1) 0.982
normal times residential quarter (0.3, 0.7) (0.4, 0.6) (0.7, 0.3) (0.9, 0.1) 0.857
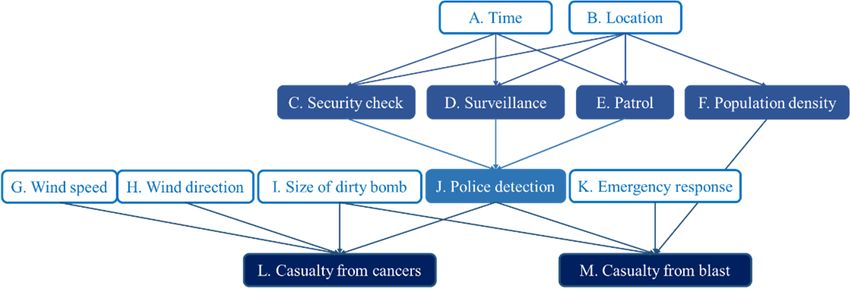
4.1. Sensitivity of Casualty to Wind Fields, Size of Dirty Bomb and Emergency Response
The upper left panel of Figure 2 shows the casualties from cancers under 6 different wind fields
namely GH1~3 and GH7~9. As can be seen there, casualty in case GH3 (with the wind speed ≤2 m/s
and the wind direction as northeast) is larger than that in other cases, which is consistent with the
result in [28]. However, the small differences (about ±20%) of casualty among all the six cases suggest
Sustainability
that 2019, 11,of
the sensitivity x FOR PEER from
casualty REVIEW
cancers to wind fields is less important. 8 of 12
Figure Sensitivity
2. 2.
Figure of of
Sensitivity casualty to to
casualty wind fields,
wind thethe
fields, size of of
size dirty bomb
dirty and
bomb emergency
and response.
emergency response.
4.2.The upper
Impacts of right panel Time
Occurrence of Figure 2 showson
and Location the casualties
Risk from
Happening andbomb explosions
Attacking when emergency
Consequence
response is on time (K1) and delayed (K2), respectively. As shown in this panel, the casualties from
To examine when and where a dirty bomb attacking is more likely to happen (whether it is
bomb explosions are not significantly affected by the state of the node ‘Emergency response’, since the
detected by the police or not), and to investigate the impacts of its occurrence time (node A) and
differences of casualty between K1 and K2 for M1, M2 and M3 are quite small (lower than 5%). This
location (node B) on attacking consequences (node L and M), sensitivity studies are conducted by
setting 6 different cases (AB1~6). As shown in Table 3, cases AB1~3 represent the occurrence on
normal time in business quarter, residential quarter and open space, while cases AB4~6 represent
the occurrence on special time corresponding to the same locations. The results of estimated
probabilities calculated by the Bayesian network are shown in Table 4.Sustainability 2019, 11, 306 8 of 12
result indicates that though on-time emergency response can decrease the mass casualties (e.g., M3),
the impact of emergency response on the direct casualties from blast is not large.
The lower panels of Figure 2 show how “the size of dirty bomb” affects the casualties from both
bomb explosion and cascading cancers. From these two panels, we can see that larger bombs may
cause heavier casualties especially from cascading cancers. As shown in the lower left panel, the bomb
with ‘TNT > 45 kg & Pu > 5 kg’ (case I1) will lead to about 20% more casualties from cancers than that
with the size of ‘TNT < 45 kg & Pu < 5 kg’ (case I2). However, the difference of casualty from bomb
blast between I1 and I2 is not that large.
4.2. Impacts of Occurrence Time and Location on Risk Happening and Attacking Consequence
To examine when and where a dirty bomb attacking is more likely to happen (whether it is
detected by the police or not), and to investigate the impacts of its occurrence time (node A) and
location (node B) on attacking consequences (node L and M), sensitivity studies are conducted by
setting 6 different cases (AB1~6). As shown in Table 3, cases AB1~3 represent the occurrence on
normal time in business quarter, residential quarter and open space, while cases AB4~6 represent the
occurrence on special time corresponding to the same locations. The results of estimated probabilities
calculated by the Bayesian network are shown in Table 4.
Table 3. Description of sensitivity cases.
Case Node Description
AB1 A. Time & B. Location: Time = ‘normal times’; Location = ‘business quarter’
AB2 A. Time & B. Location: Time = ‘normal times’; Location = ‘residential quarter’
AB3 A. Time & B. Location: Time = ‘normal times’; Location = ‘open space’
AB4 A. Time & B. Location: Time = ‘special times’; Location = ‘business quarter’
AB5 A. Time & B. Location: Time = ‘special times’; Location = ‘residential quarter’
AB6 A. Time & B. Location: Time = ‘special times’; Location = ‘open space’
C1 C. Security check Security check = ‘yes’
C2 C. Security check Security check = ‘no’
D1 D. Surveillance Surveillance = ‘24-h-covering’
D2 D. Surveillance Surveillance = ‘not 24-h-covering’
E1 E. Patrol Patrol = ‘>2 times’
E2 E. Patrol Patrol = ‘1000/km2 ’
F2 F. Population density Population density = ‘500~1000/km2 ’
F3 F. Population density Population density = ‘4 m/s’; Wind direction = ‘east’
GH8 G. Wind speed & H. Wind direction Wind speed = ‘>4 m/s’; Wind direction = ‘north’
GH9 G. Wind speed & H. Wind direction Wind speed = ‘>4 m/s’; Wind direction = ‘northeast’
I1 I. Size of dirty bomb Size of dirty bomb = ‘TNT > 45 kg & Pu > 5 kg’
I2 I. Size of dirty bomb Size of dirty bomb = ‘TNT < 45 kg & Pu < 5 kg’
J1 J. Police detection Police detection = ‘yes’
J2 J. Police detection Police detection = ‘no’
K1 K. Emergency response Emergency response = ‘on time’
K2 K. Emergency response Emergency response = ‘delay’
L1 L. Casualty from cancers less than 10 persons (less than 50 injuries)
L2 L. Casualty from cancers 11 to 30 persons (51 to 100 injuries)
L3 L. Casualty from cancers more than 30 persons (more than 100 injuries)
M1 M. Casualty from blast less than 10 persons (less than 50 injuries)
M2 M. Casualty from blast 11 to 30 persons (51 to 100 injuries)
M3 M. Casualty from blast more than 30 persons (more than 100 injuries)Sustainability 2019, 11, 306 9 of 12
Table 4. Estimated probabilities with different occurrence time and location.
State of Bayesian Estimated Probabilities
Bayesian Nodes
Nodes AB1 AB2 AB3 AB4 AB5 AB6
J1 0.995 0.895 0.040 0.998 0.992 0.195
J. Police detection
J2 0.005 0.105 0.960 0.003 0.008 0.805
L1 0.988 0.921 0.357 0.989 0.986 0.459
L. Casualty from
L2 0.010 0.046 0.360 0.009 0.011 0.303
cancers
L3 0.003 0.032 0.283 0.002 0.004 0.238
M1 0.993 0.911 0.933 0.995 0.991 0.943
M. Casualty from
M2 0.002 0.005 0.028 0.002 0.002 0.024
blast
M3 0.005 0.085 0.039 0.003 0.007 0.033
As can be seen in Table 3, police detection is not that related to normal or special time. For example,
the probability of J1 will only increase from 0.995 to 0.998 if the state turns from normal time (AB1) to
special time (AB4) in business quarter.
However, the probability of police detection significantly depends on the location. For instance,
the probability of J1 (Police detection = ‘yes’) decreases from 0.995 at AB1 to 0.04 at AB3, indicating that
if the occurrence location turns from business quarter to open space (on normal time), the probability
of risk happening will remarkably increase. At both normal and special times, open space has the
lowest probability of police detection since security, surveillance and patrol in open space are of lower
intensity than those in business quarter or residential quarter.
If the occurrence location turns from business quarter or residential quarter to open space at both
normal and special times, the probability of more than 30 casualties (more than 100 injuries) from
cascading cancer will increase from lower than 0.01 to higher than 0.2. This indicates that casualty
from cascading cancer significantly depends on the location. On the other hand, casualty from bomb
blast is not considerably influenced by the location. The reason may be that in open space, though
the probability of police detection is extremely low, the population density is very low (probability of
“lower than 500/km2 ” is higher than 0.99), which also affects the casualty from bomb blast.
4.3. Evaluation of the Defense Approaches
To protect people from being attacked by a dirty bomb and to decrease casualties and injures
in attack activities, generally, security check, surveillance and patrol are done by the police. In this
paper, we evaluate these three approaches by using Bayesian network. As shown in Figure 3, eight
combinations based on the three approaches are tested to examine the performance of the strategies
against urban dirty bomb attacking.
Based on the bars for L3 and M3, the strategy involving all the three approaches has the best
result, which means it reaches the lowest probability of more than 30 casualties. If the state of security
check turns from ‘yes’ to ’no’, the risk grows significantly for both L3 and M3, indicating that security
check is an important approach to controlling the risk of urban dirty bomb. However, if the state of
patrol turns from ‘>2 times’ to ‘‘24-h-covering’ to ‘non-24-h-covering’, the change of probability of more than 30 casualties is
limited, suggesting that patrol and surveillance are less important than security check in terms of
controlling the risk of urban dirty bomb. Furthermore, the results also show that when one and only
one approach is used, security check shows the lowest probability of more than 30 casualties,
supporting that security check performs as the most effective way of decreasing the risk of urban
Sustainability 2019, 11, 306 10 of 12
dirty bomb attacking.
Figure 3.3. Evaluation
Figure Evaluationofofthe defense
the defenseapproaches.
approaches.C1 C1
represents security
represents checkcheck
security = ‘yes’; C2 security
= ‘yes’; check
C2 security
= ‘no’; =D1
check surveillance
‘no’; = ‘24-h-covering’;
D1 surveillance D2 surveillance
= ‘24-h-covering’; = ‘not 24-h-covering’;
D2 surveillance E1 patrol
= ‘not 24-h-covering’; E1=patrol
‘>2 times’;
= ‘>2
while
times’;E2 patrol
while E2=patrol
‘Sustainability 2019, 11, 306 11 of 12
Author Contributions: Conceptualization, X.H.; Data curation, Z.T.; Formal analysis, X.H.; Funding acquisition,
X.H.; Investigation, X.H.; Methodology, Z.T.; Software, Z.T.; Supervision, X.H.; Validation, Z.T.; Writing—original
draft, Z.T.; Writing—review & editing, H.W.; Revision, Y.L.
Funding: The authors appreciate support for this paper by the National Natural Science Foundation of China
(Grant No. 71704183); Basic scientific research project of People’s Public Security University of China (Grant No.
2018JKF228).
Conflicts of Interest: The authors declare no conflict of interest.
References
1. Lafree, G. The Global Terrorism Database: Accomplishments and Challenges. Perspect. Terror. 2010, 4,
2003–2016.
2. Richey, W.; Bowers, F. A Look Inside Bin Laden’s Web of Islamic ‘Warriors’; Christian Science Monitor: Boston,
MA, USA, 2001.
3. Sihver, L.; Yasuda, N. Causes and Radiological Consequences of the Chernobyl and Fukushima Nuclear
Accidents. J. Nucl. Eng. Radiat. Sci. 2018, 4, 020914. [CrossRef]
4. Ring, J.P. Radiation risks and dirty bombs. Health Phys. 2004, 86, 42–47. [CrossRef]
5. Acton, J.M.; Rogers, M.B.; Zimmerman, P.D. Beyond the Dirty Bomb: Re-thinking Radiological Terror.
Survival 2007, 49, 151–168. [CrossRef]
6. Chin, F.K. Scenario of a dirty bomb in an urban environment and acute management of radiation poisoning
and injuries. Singap. Med. J. 2007, 48, 950–957.
7. Elcock, D.; Klemic, G.A.; Taboas, A.L. Establishing Remediation Levels in Response to a Radiological
Dispersal Event (or “Dirty Bomb”). Environ. Sci. Technol. 2004, 38, 2505–2512. [CrossRef]
8. Rosoff, H.; Winterfeldt, D.V. A Risk and Economic Analysis of Dirty Bomb Attacks on the Ports of Los
Angeles and Long Beach. Risk Anal. Int. J. 2007, 27, 533–546. [CrossRef]
9. Jeong, H.-J.; Hwang, W.-T.; Kim, E.-H.; Han, M.-H. Radiological risk assessment for an urban area: Focusing
on a drinking water contamination. Ann. Nucl. Energy 2009, 36, 1313–1318. [CrossRef]
10. Jeong, H.-J.; Hwang, W.-T.; Kim, E.-H.; Han, M.H. Radiological risk assessment for an urban area: Focusing
on an air contamination event. Ann. Nucl. Energy 2010, 37, 791–797. [CrossRef]
11. Reshetin, V.P. Estimation of radioactivity levels associated with a Sr dirty bomb event. Atmos. Environ. 2005,
39, 4471–4477. [CrossRef]
12. Andersson, K.G.; Mikkelsen, T.; Astrup, P.; Thykier-Nielsen, S.; Jacobsen, L.H.; Hoe, S.C.; Nielsen, S.P.
Requirements for estimation of doses from contaminants dispersed by a ‘dirty bomb’ explosion in an urban
area. J. Environ. Radioact. 2009, 100, 1005–1011. [CrossRef]
13. Hu, X.-F.; Chen, P.; Tai, Y.; Mojia, S. An Assessment Method of Radiation Dose under Dirty Bomb Terrorism
Based on WRF. Sci. Technol. Eng. 2017, 17, 120–124. (In Chinese)
14. Zhang, Y.; Qi, J.; Fang, B.; Li, Y. Online Public Opinion Risk Warning Based on Bayesian Network Modeling.
Libr. Inf. Serv. 2012, 56, 76–81.
15. Qiu, J.; Wang, Y.; Dong, L.; Ye, X. A Model for Predicting Emergency Event Based on Bayesian Networks.
J. Syst. Manag. 2011, 20, 98–103.
16. Cai, B.; Huang, L.; Xie, M. Bayesian Networks in Fault Diagnosis. IEEE Trans. Ind. Inform. 2017, 13, 2227–2240.
[CrossRef]
17. Zhang, C.; Wu, J.; Huang, C.; Jiang, B. A model for the representation of emergency cases. Nat. Hazards 2018,
9, 337–351. [CrossRef]
18. Cai, B.; Xie, M.; Liu, Y.; Liu, Y.; Feng, Q. Availability-based engineering resilience metric and its corresponding
evaluation methodology. Reliab. Eng. Syst. Saf. 2017, 172, 216–224. [CrossRef]
19. Yuan, Z.; Khakzad, N.; Khan, F.; Amyotte, P. Risk Analysis of Dust Explosion Scenarios Using Bayesian
Networks. Risk Anal. 2015, 35, 278–291. [CrossRef]
20. Wu, J.; Xu, S.; Zhou, R.; Qin, Y. Scenario analysis of mine water inrush hazard using Bayesian networks.
Saf. Sci. 2016, 89, 231–239. [CrossRef]
21. Cai, B.; Kong, X.; Liu, Y.; Lin, J.; Yuan, X.; Xu, H.; Ji, R. Application of Bayesian Networks in Reliability
Evaluation. IEEE Trans. Ind. Inform. 2018. [CrossRef]Sustainability 2019, 11, 306 12 of 12
22. Cai, B.; Liu, Y.; Fan, Q. A multiphase dynamic Bayesian networks methodology for the determination of
safety integrity levels. Reliab. Eng. Syst. Saf. 2016, 150, 105–115. [CrossRef]
23. Fu, Z.; Xu, R.; Liu, W. Research on Terrorist Attack Warning Model Based on Bayesian Network. J. Catastrophol.
2016, 31, 184–189.
24. Pat-Cornell, E.; Guikema, S. Probabilistic Modeling of Terrorist Threats: A Systems Analysis Approach to
Setting Priorities Among Countermeasures. Mil. Oper. Res. 2002, 7, 5–23. [CrossRef]
25. Francis, R.A.; Guikema, S.D.; Henneman, L. Bayesian Belief Networks for predicting drinking water
distribution system pipe breaks. Reliab. Eng. Syst. Saf. 2014, 130, 1–11. [CrossRef]
26. Dempster, A.P. Upper and Lower Probabilities Induced by a Multivalued Mapping. Ann. Math. Stat. 1967,
38, 325–339. [CrossRef]
27. Classic Works of the Dempster-Shafer Theory of Belief Functions; Yager, R.R.; Liu, L. (Eds.) Springer:
Berlin/Heidelberg, Germany, 2008.
28. Hu, X.-F.; Lin, Y.; Chen, P.; Zeng, Z. Study on Assessment Method for the Urban Dirty Bomb Terrorism.
China Public Secur. 2015, 4, 35–38.
© 2019 by the authors. Licensee MDPI, Basel, Switzerland. This article is an open access
article distributed under the terms and conditions of the Creative Commons Attribution
(CC BY) license (http://creativecommons.org/licenses/by/4.0/).You can also read