Geo Module - Mineralogical Calculations - Metso ...
←
→
Page content transcription
If your browser does not render page correctly, please read the page content below
HSC – Geo - Mineralogical
                                                                                                 Calculations and Mineral Database
                                                                                                 1/46
                                                                                                 Pertti Lamberg
                                                                                                 December 11, 2020

84.            Geo Module - Mineralogical Calculations
               and Mineral Database
84.1.          Introduction

               The Geo module of HSC is intended for:

                       Studying mineral properties (Database Viewer, Catalogue: section 84.2, 84.4)
                       Finding minerals based on elements in the formula (Find by Properties: 84.3)
                       Identifying minerals based on the chemical composition (Find by Composition:
                       84.5)
                       Performing petrological calculations (Petrological: 84.6)
                       Calculating the modal composition (mineral composition) of samples based on
                       chemical assays (Modal : 84.7)
                       Processing mineral liberation data (Mineral liberation: 85)

Metso Outotec reserves the right to modify these specifications at any time without prior notice. Copyright © 2021, Metso Outotec Finland Oy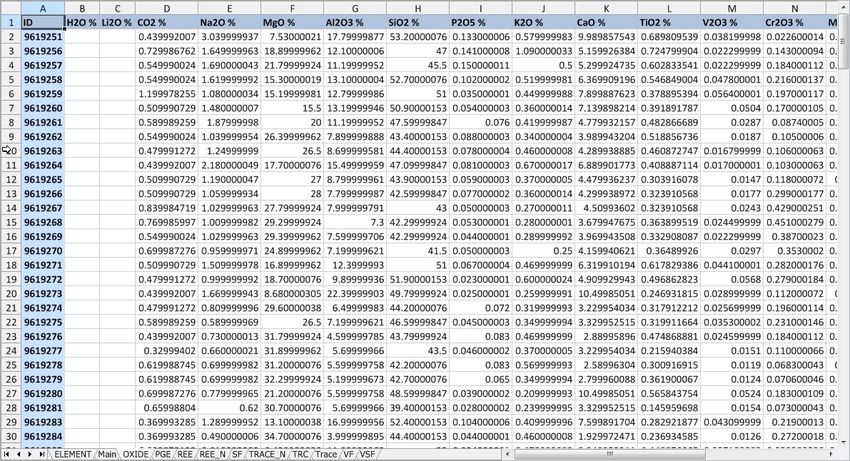
HSC – Geo - Mineralogical
                                                                                                 Calculations and Mineral Database
                                                                                                 2/46
                                                                                                 Pertti Lamberg
                                                                                                 December 11, 2020

84.2.          Mineral database

               Press the Mineral database button to study the mineral database of HSC Chemistry.

84.2.1.        Source

               There are different sources for the mineral database. These can be selected as in
               figure below

                       Mineral Chemistry = Table of the chemical composition of minerals (different
                       analyses of minerals from different locations)
                       Phase Chemistry = Table of chemical compositions of different compounds

Metso Outotec reserves the right to modify these specifications at any time without prior notice. Copyright © 2021, Metso Outotec Finland Oy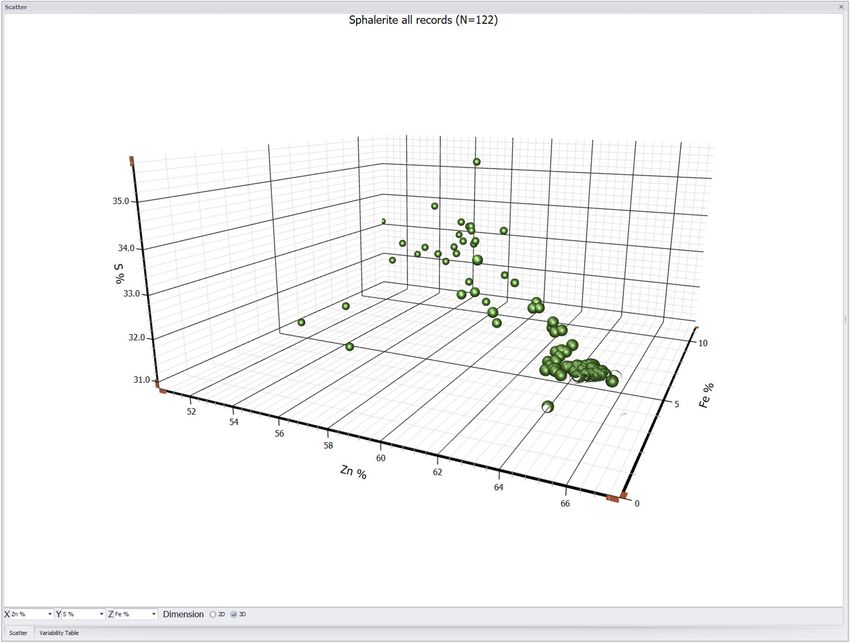
HSC – Geo - Mineralogical
                                                                                                 Calculations and Mineral Database
                                                                                                 3/46
                                                                                                 Pertti Lamberg
                                                                                                 December 11, 2020

                        Mineral = Table of minerals, one row per mineral
                        Element = Chemical elements
                        Mineral Dissolution = Table of mineral dissolutions alongside with method of
                        analysis and the fraction extracted

               After selecting the source you can apply:

                        Filter
                        Search
                        Edit
84.2.2.        Filter

               By clicking the filter icon   , a new “Filter” window will appear in the right hand panel.
               You can then write a text in any of the fields in the top row. The small green “ABC” icon
                    beside the text can be pressed to choose the search criteria. The resulting search
               criteria will be shown in the “Filter” window.

               For instance, we want to search sphalerite minerals in all locations starting with the
               letter “S”. Type the Mineral Name = “Sphalerite” and the Location = “S”. By default the
               search criteria will then be all mineral names containing the word “Sphalerite” in all
               locations containing the letter “S”. To change this click the “ABC” icon under the
               Location column to define the criteria as “Begins with” the letter “S”. The search criteria
               is visualized in the Filter Window. There are a total of 10 records that fulfill the search
               criteria

               In the Filter Window you can:

                        Edit the field by clicking the Field value given in blue and selecting a new one
                        from the list, e.g. changing [Mineral Name] to [Mineral Symbol].
                        Edit the condition given in green and selecting a new one from the list, e.g.
                        changing “Contains” to “Begin With”
                        Edit the operator given in red and selecting a new one from the list, e.g. changing
                        “And” to “Or”

Metso Outotec reserves the right to modify these specifications at any time without prior notice. Copyright © 2021, Metso Outotec Finland Oy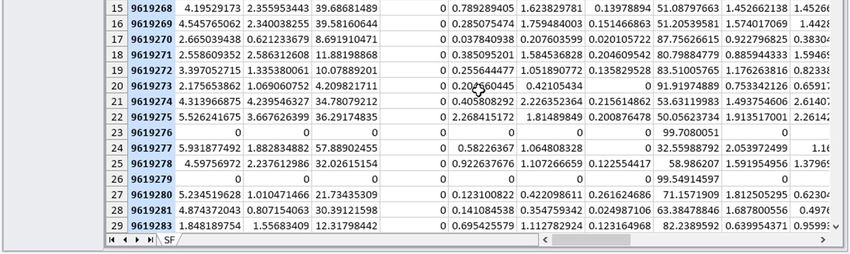
HSC – Geo - Mineralogical
                                                                                                 Calculations and Mineral Database
                                                                                                 4/46
                                                                                                 Pertti Lamberg
                                                                                                 December 11, 2020

                       Adding or deleting a search criteria. Alternatively you can clear all search criteria
                       at once by pressing clear.

               To copy data to the clipboard, select the rows you want to copy (use Ctrl or Shift to
               select several rows) and press “Copy Data.” Alternatively you can press the keyboard
               shortcut Ctrl + C.

84.2.3.        Find

               You can search through the database by entering the keyword and clicking Find. Find
               differs from Filtering in that it always searches all the fields and it always seeks
               matches with any part of the field.

Metso Outotec reserves the right to modify these specifications at any time without prior notice. Copyright © 2021, Metso Outotec Finland Oy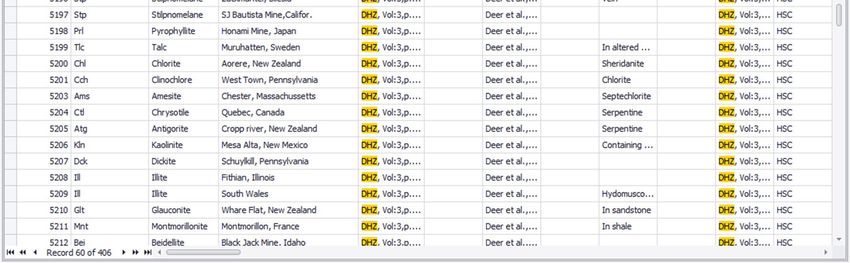
HSC – Geo - Mineralogical
                                                                                                 Calculations and Mineral Database
                                                                                                 5/46
                                                                                                 Pertti Lamberg
                                                                                                 December 11, 2020

               You can write several searches by separating them with a space, e.g. writing DHZ
               biotite will show all the fields containing the text DHZ or biotite (see below).

Metso Outotec reserves the right to modify these specifications at any time without prior notice. Copyright © 2021, Metso Outotec Finland Oy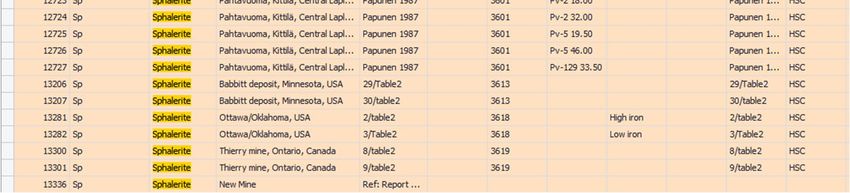
HSC – Geo - Mineralogical
                                                                                                 Calculations and Mineral Database
                                                                                                 6/46
                                                                                                 Pertti Lamberg
                                                                                                 December 11, 2020

84.2.4.        Edit

               To edit the database, press View / Edit in the ribbon (top).

               The database view color will change to orange, indicating that the database is in edit
               mode. Pressing the View/Edit button again will change the database to the view mode
               and the color to white.

               Editing the content of a row

               Activate the row and cell you want to edit and just type the new value in the cell.
               Change the cursor position and the value will be automatically saved in the database.

               Deleting a row

               Select the row you want to delete and press “Remove Record(s)”. Geo will ask you to
               confirm the removal.

Metso Outotec reserves the right to modify these specifications at any time without prior notice. Copyright © 2021, Metso Outotec Finland Oy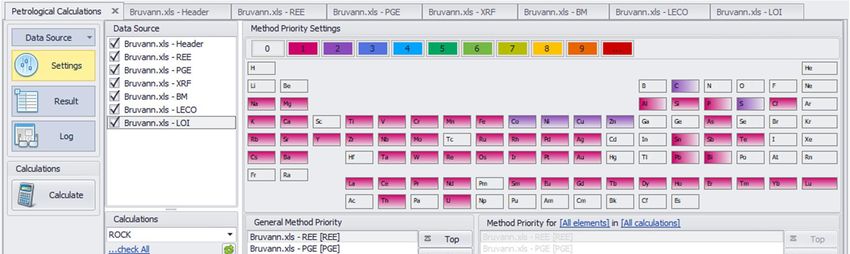
HSC – Geo - Mineralogical
                                                                                                 Calculations and Mineral Database
                                                                                                 7/46
                                                                                                 Pertti Lamberg
                                                                                                 December 11, 2020

               Adding a new row by manually typing

               Press “Add Record” on the right panel or in the ribbon. A new window will show in
               which you can enter the new record. You can add new field for the new record by
               pressing “Add Field”.

               Geo creates a new row at the end of the table. Geo will also automatically fill in the
               Mineral Symbol fields.

               Adding a new row by pasting

               The easiest way of adding new mineral rows to the Geo mineral database is to
               organize the table (e.g. in Microsoft Excel) and paste it into Geo.

               When organizing the data, you need to comply with the following rules:

                       Data must be horizontal, one record per row
                       The first row must give the field (column) names
                       The column names must be exactly the same as in the Geo mineral database
                       Information is required for at least the Mineral Name, Location, and Mineral Key
                       columns

               Select the data in Excel and in Geo select Paste Data. Alternatively, the keyboard
               shortcut Ctrl + V can be used

Metso Outotec reserves the right to modify these specifications at any time without prior notice. Copyright © 2021, Metso Outotec Finland Oy
HSC – Geo - Mineralogical
                                                                                                 Calculations and Mineral Database
                                                                                                 8/46
                                                                                                 Pertti Lamberg
                                                                                                 December 11, 2020

               Geo will advise how many rows were added and how many columns were identified.
               For example, the columns CuO % and In ppm were not identified and the data were not
               entered into the database. Copper values should have been given as Cu % and indium
               as In % for a successful paste.

Metso Outotec reserves the right to modify these specifications at any time without prior notice. Copyright © 2021, Metso Outotec Finland Oy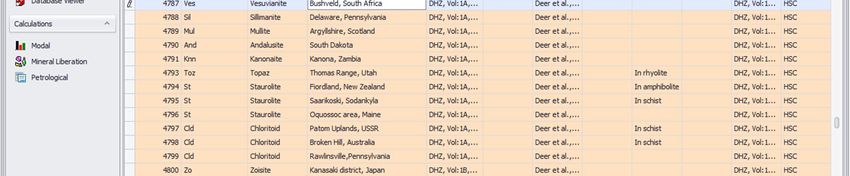
HSC – Geo - Mineralogical
                                                                                                 Calculations and Mineral Database
                                                                                                 9/46
                                                                                                 Pertti Lamberg
                                                                                                 December 11, 2020

84.3.          Find by Properties

               “Find by Properties” is used to find minerals based on elements in their formula.

               Press “Find by Properties”

               In the periodic table, click once on the elements that are found in the mineral (shown in
               yellow) and twice for elements that are not in the mineral (shown in red). Pressing
               Apply Filter will make a query in the mineral database and show those that pass the
               criteria. The query conditions can be seen either in visual or text output below the
               periodic table.

               An example of minerals containing Cu, Cl, and O but not B, N, Na, Mg, S, K, Ca, Fe,
               Zn, Pb, and Bi is shown below.

Metso Outotec reserves the right to modify these specifications at any time without prior notice. Copyright © 2021, Metso Outotec Finland Oy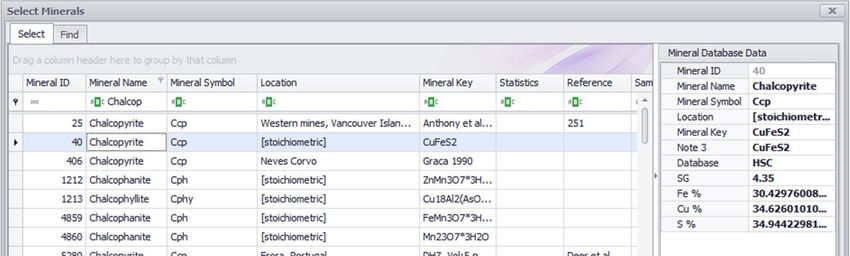
HSC – Geo - Mineralogical
                                                                                                 Calculations and Mineral Database
                                                                                                 10/46
                                                                                                 Pertti Lamberg
                                                                                                 December 11, 2020

               Another example of the search for lead-bearing sulfides is shown below.

               The details of the resulting minerals are readily available in the lower panels. By
               selecting one row, the general properties of that mineral can be seen, alongside with
               the chemical composition graph. Example here is shown for Anglesite.

Metso Outotec reserves the right to modify these specifications at any time without prior notice. Copyright © 2021, Metso Outotec Finland Oy
HSC – Geo - Mineralogical
Calculations and Mineral Database
11/46
Pertti Lamberg
December 11, 2020
84.4. Catalogue
The Catalogue button gives access to mineral properties by name.
In the List of Minerals window, type the names of the mineral of interest (e.g. sphal…
for sphalerite) and Geo will select the first mineral that matches the text you typed. The
general properties of minerals are on the left and there is a table with different analyses
of the selected mineral from the different locations shown on the right. By default, three
graphs are given: elemental composition pie chart, scatter plot between different
elements, and variability of the elements. This can be turned on and off in the top
ribbon
Metso Outotec reserves the right to modify these specifications at any time without prior notice. Copyright © 2021, Metso Outotec Finland OyHSC – Geo - Mineralogical
Calculations and Mineral Database
12/46
Pertti Lamberg
December 11, 2020
In the scatter plot, you can change the elements shown on the X and Y axis from the
combo boxes below the graph.
When double-clicking any of the points on the graph, the table on the right-hand side of
the graph will be updated to show the mineral analysis in question.
Metso Outotec reserves the right to modify these specifications at any time without prior notice. Copyright © 2021, Metso Outotec Finland OyHSC – Geo - Mineralogical
Calculations and Mineral Database
13/46
Pertti Lamberg
December 11, 2020
Additionally, an additional Z-axis could also be made for making 3D scatter plot.
The variability chart summarizes the variation in the chemical composition of the
selected minerals in a line chart, where each analyzed element is shown on the X axis
and the narrow horizontal line represents one record in the database. More information
on each point can be received when double-clicking: a table on the right-hand side will
show the properties of the selected mineral analysis (i.e. the content of the record (row)
in the database).
Metso Outotec reserves the right to modify these specifications at any time without prior notice. Copyright © 2021, Metso Outotec Finland OyHSC – Geo - Mineralogical
Calculations and Mineral Database
14/46
Pertti Lamberg
December 11, 2020
To save, copy, or print, select the three rows icon in the top left corner of the chart.
You can also use a filter by pressing “Filter” in the lower left corner of the List of
Minerals window. In the Filter window, you can filter the minerals by the elements
found in the formula (see the previous chapter on Find mineral). Move the desired
minerals to the selected ones with the and buttons (move selected, move all,
respectively). When ready, press “Accept”.
Metso Outotec reserves the right to modify these specifications at any time without prior notice. Copyright © 2021, Metso Outotec Finland OyHSC – Geo - Mineralogical
Calculations and Mineral Database
15/46
Pertti Lamberg
December 11, 2020
In the List of Minerals window, select the mineral that you want to study further.
Metso Outotec reserves the right to modify these specifications at any time without prior notice. Copyright © 2021, Metso Outotec Finland OyHSC – Geo - Mineralogical
Calculations and Mineral Database
16/46
Pertti Lamberg
December 11, 2020
84.5. Find by Composition
“Find by Composition” is used to find a name for a mineral based on its chemical
composition. Typically, this kind of question is faced when studying samples with
scanning electron microscope (SEM) and EDS (or WDS) and an analysis is collected
from a mineral grain.
Press “Find by Composition” in the left panel.
Let us propose that the EDS analysis gave 26% Cu, 22% Sb, 27% S, 5% Fe, and 20%
Ag. To start with, press the Add button and select Cu for the element, % for
the proportion, 26 for the value. SD is a standard deviation and you can obtain this
information by analyzing the same grain several times and calculating the value of the
standard deviation. You can use a default value of 1%. Press OK and add the next
elements. Alternatively, the elements can be added by choosing from the periodic table
Finally, when you have added all the conditions to be identified, press
Metso Outotec reserves the right to modify these specifications at any time without prior notice. Copyright © 2021, Metso Outotec Finland OyHSC – Geo - Mineralogical
Calculations and Mineral Database
17/46
Pertti Lamberg
December 11, 2020
Geo will show you the 10 best matching minerals. Matching is done by calculating the
Weighed Sum of Squares according to the following function:
=
The lower the WSSQ, the better the match. The rows are displayed in the order of
increasing WSSQ. This time all the 10 best matches are for tetrahedrite and the
identification can be regarded as reliable.
The table can be organized by right-clicking on the columns and for example hiding it
(Hide This Column).
The number of minerals listed can be changed in the lower part of the window.
It is also possible to change the given assays (composition) to oxide form.
Metso Outotec reserves the right to modify these specifications at any time without prior notice. Copyright © 2021, Metso Outotec Finland OyHSC – Geo - Mineralogical
Calculations and Mineral Database
18/46
Pertti Lamberg
December 11, 2020
84.6. Petrological calculations
84.6.1. General procedure
The general procedure of HSC Geo in working with rock and mineral analyses is as
follows:
1) Prepare the data e.g. in Excel and save using Excel file format.
2) Open the files in HSC Geo or paste to HSC Geo
3) Run the identification routine
4) Customize the calculation routines, if required
5) Do the calculations
6) Check and recalculate, if necessary
7) Save the result
84.6.2. Preparing the data
To ease and quicken the data processing in HSC Geo, prepare your data to satisfy the
following requirements:
Data should be row-wise; one observation or measurement per line, i.e.
each sample has its own row.
Place each data type in its own file or own sheet. For example, one
sheet/file has the header information of samples, one sheet includes XRF
analyses, another REE analyses, and one PGE assays
Place the header in the first row and ID column in the first column
In the header row or rows you should specify the element in analysis, the
analysis method, and the unit, e.g. SiO2/XRF/%. The following options
exist:
o Place the element, method and unit in individual rows:
Place the element in the first row and name this row
ELEMENT
Place the method in the second (or third) row and name
it METHOD
Place the unit in its own row and name it UNIT. HSC Geo
understands the following units: wt%, %, ppm, g/t, ppb
o Place the element, method and unit in the first row and separate
them with a space or / (e.g. Cr XRF ppm, Cr/XRF/ppm)
o Name the file or sheet according to the method and then there is
no need to repeat it. On the XRF sheet, the header gives the
element and method, for example, Cr ppm.
The decimal separator should be a point (e.g. 21.34)
Save data as an Excel file (version 5) or as a tab-separated text file
Metso Outotec reserves the right to modify these specifications at any time without prior notice. Copyright © 2021, Metso Outotec Finland OyHSC – Geo - Mineralogical
Calculations and Mineral Database
19/46
Pertti Lamberg
December 11, 2020
84.6.3. Tutorial Data in Excel File with Multiple Sheets – Step-by-step
This tutorial guides you through the HSC Geo steps where you open the dataset,
perform the calculations, and save the result in the database.
1. Run HSC Geo, Choose Petrological
2. Select Data Source, then Open Data from the left button list
3. Select from the data folder (C:\Program Files (x86)\HSC10\Geo\Data) example
file Bruvann.xls
4. HSC Geo opens the Excel file and places each sheet as its own source window.
A total of seven sources are visible:
Bruvann / Header (header data, location data)
Bruvann / LOI (loss of ignition analyses)
Bruvann / LECO (Leco analyses)
Bruvann / BM (bromine-methanol analyses)
Bruvann / XRF (X-ray fluorescence analyses)
Bruvann / PGE (PGE analyses)
Bruvann / REE (REE analyses)
In each source (Excel sheet) the data is row-wise, the first row includes the header,
and the sample ID is placed in each file in the first column. For the chemical elements,
both the element name and unit are given in the first row separated by a space, e.g.
Al2O3 %. Each source (i.e. Excel sheet) has been named according to the assay
method. Please follow this procedure with your own data. Do not leave empty columns
or rows.
Metso Outotec reserves the right to modify these specifications at any time without prior notice. Copyright © 2021, Metso Outotec Finland OyHSC – Geo - Mineralogical
Calculations and Mineral Database
20/46
Pertti Lamberg
December 11, 2020
5. If the excel data fulfil the format requirements, HSC Geo would automatically
identify the structure when opening the data. Otherwise, click identify in the
Parameters window. If identified correctly the status would turn from red dot “Not
Identified” to green dot “Identified”
6. HSC Geo identifies the structure of each source and, to indicate the result, each
source includes header rows (blue text on gray background) as follows:
-Hdr- HEADER: is the original header of the data
-Ele- ELEMENT: is the name of the chemical element if HSC Geo has
identified the column as a chemical element
-Met- METHOD: indicates the method of the analysis (e.g. XRF)
-Uni- UNIT: unit of the assay (e.g. ppm)
-Tab- TABLE: name of the table where the data will be stored, for analysis
ANALYSIS is default
-Fld- FIELD: name of the field in the table, e.g. SiO2/XRF/% in the table
ANALYSIS
-Typ- TYPE: field type, e.g. SINGLE
-Len- LENGTH: length of the character field
-Dig- DIGITS: number of digits in the numeric fields
-Idx- INDEXED: Yes, if the field is indexed. Key and ID fields are indexed
-Mul- MULTIPLIER: The multiplier if the data has been multiplied to reach
a uniform structure, e.g. Fe-> FeO
-Idf- IDENTIFIED: X and name of the chemical element and the total
number of the element in the source, e.g. X(Si)1/2 indicates that the field
is silica and there are also silica analyses with possible different analysis
methods in the same file
Metso Outotec reserves the right to modify these specifications at any time without prior notice. Copyright © 2021, Metso Outotec Finland OyHSC – Geo - Mineralogical
Calculations and Mineral Database
21/46
Pertti Lamberg
December 11, 2020
7. In the calculation window you can define settings to include:
Data source (check the sources you want to use) (1)
Priority order for methods for each element (2)
Calculation group selected (3)
Calculations to be performed (4)
1 2
3
4
Metso Outotec reserves the right to modify these specifications at any time without prior notice. Copyright © 2021, Metso Outotec Finland OyHSC – Geo - Mineralogical
Calculations and Mineral Database
22/46
Pertti Lamberg
December 11, 2020
In order to edit the priority order (the order of methods used in calculations):
Click the element of interest, the color code shows where the data
sources (methods) of the element can be found. For example, in the
figure below, cobalt can be found in two data sources: [BM] and [XRF].
Use the Top, Up, Down, and Bottom buttons to move the methods in
the desired order.
The calculation options can be edited by pressing “Manage
Calculation.”
and by selecting the appropriate method. For more details on calculation routines and
how to modify them, see the following chapters.
Metso Outotec reserves the right to modify these specifications at any time without prior notice. Copyright © 2021, Metso Outotec Finland OyHSC – Geo - Mineralogical
Calculations and Mineral Database
23/46
Pertti Lamberg
December 11, 2020
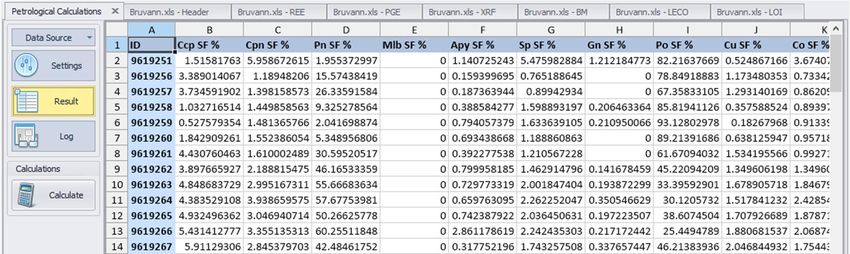
9. When the identification is ready, you can progress to calculations. Check the
calculations you want to do for the samples by checking and unchecking the
calculations in the list box. The calculations listed below are done by default.
When ready, press “CALCULATE”
Metso Outotec reserves the right to modify these specifications at any time without prior notice. Copyright © 2021, Metso Outotec Finland OyHSC – Geo - Mineralogical
Calculations and Mineral Database
24/46
Pertti Lamberg
December 11, 2020
Metso Outotec reserves the right to modify these specifications at any time without prior notice. Copyright © 2021, Metso Outotec Finland OyHSC – Geo - Mineralogical
Calculations and Mineral Database
25/46
Pertti Lamberg
December 11, 2020
10. When completed, Geo asks if you want to see the log.
11. If there are errors you can see them in the Log window.
12. Calculation results are calculated in the “Calculation Result” window,
which is similar in structure to the input files. The result of each of the calculation
routines is shown on its own page.
Metso Outotec reserves the right to modify these specifications at any time without prior notice. Copyright © 2021, Metso Outotec Finland OyHSC – Geo - Mineralogical
Calculations and Mineral Database
26/46
Pertti Lamberg
December 11, 2020
13. To save the results, press Save as Excel and give the file a name.
84.6.4. Calculation routines
HSC Geo allows you to calculate certain frequently used routines in the same way,
although the input format may change from one data source to another. HSC Geo
includes a number of petrological calculation routines but since the actual calculations
are carried out in Microsoft Excel, it is quite easy for users to make their own routines
as well.
General structure
In HSC Geo, the calculation routines are actually Microsoft Excel files. Files must be
located in folders under C:\Program Files (x86)\HSC10\Geo\C-Groups. In the example
below, there are two different sets of calculations: “ROCK” and “MINERAL.”
Metso Outotec reserves the right to modify these specifications at any time without prior notice. Copyright © 2021, Metso Outotec Finland OyHSC – Geo - Mineralogical
Calculations and Mineral Database
27/46
Pertti Lamberg
December 11, 2020
Under the ROCK folder (i.e. C:\Program Files (x86)\HSC10\Geo\C-Groups\ROCK)
there are Excel files, all of which have their own individual calculation routines.
The calculation file consists of five worksheets.
1. The first worksheet (Info) is for information.
2. The second worksheet (Setup) gives the ordinal number of the routine and
defines which routines should be done before the calculation in question is run.
3. The third worksheet is the Input sheet, i.e. data from HSC Geo to Excel.
4. The fourth worksheet (Calc) is reserved for calculations done in Excel.
5. The fifth worksheet (Output) is for output data, i.e. data from Excel to HSC Geo.
Metso Outotec reserves the right to modify these specifications at any time without prior notice. Copyright © 2021, Metso Outotec Finland OyHSC – Geo - Mineralogical
Calculations and Mineral Database
28/46
Pertti Lamberg
December 11, 2020
In the Setup worksheet, the ordinal number is given in cell B1. If the number is missing,
HSC Geo adds the routine last in the list. The routines which should be run before the
routine in question are listed in the D column from D1 downwards.
The Input sheet lists the input values required for the calculations. Column A is for the
system name. If the input is a chemical analysis, then HSC Geo inputs the assay
according to the element’s number in the periodic table, i.e. if the input value is for
example carbon, then its number is 6 and it will be brought to one row below, i.e. row 7
(the row 1 is for headers; see figure below). The assay will always be transformed to
ELEMENT WEIGHT PERCENTAGES. For example, if the assay is 1000 ppm CO2,
then HSC Geo will change it to 0.0273 % C and send the value 0.0273 to cell C7.
Metso Outotec reserves the right to modify these specifications at any time without prior notice. Copyright © 2021, Metso Outotec Finland OyHSC – Geo - Mineralogical
Calculations and Mineral Database
29/46
Pertti Lamberg
December 11, 2020
If the input value is not a chemical assay, then the full name of the value in question
has to be written. For example, the CUMNAME routine uses among others the CIPW
normative olivine as an input value. Then value “CIPW.Olivine CIPW %” stands for the
input value in cell A2 (see below).
The Calc. sheet is an independent calculation sheet not affected by HSC Geo.
The Output sheet has field names in the first column starting from row 2. If the user
wishes to change the name, it is better to type the desired name in the column B. If text
appears in the column B, that name will be used. Column C is the output value. In most
of the built-in routines column C refers to the calculation page. Column D gives the
data type for the database.
Metso Outotec reserves the right to modify these specifications at any time without prior notice. Copyright © 2021, Metso Outotec Finland OyHSC – Geo - Mineralogical
Calculations and Mineral Database
30/46
Pertti Lamberg
December 11, 2020
HSC Geo actions in calculation
The calculations in HSC Geo will take place as follows:
1. After the input format has been identified and the user presses the Calculate
button, HSC Geo will make a list of the calculation routines according to user
selections, the ordinal number on the Setup pages and other required calculation
routines on the Setup page.
2. Before each sample HSC Geo will empty column C on the Input sheet.
3. HSC Geo inputs the data in the Input page. For chemical elements the format is
ELEMENT WEIGHT PERCENTAGES.
4. HSC Geo calls the Recalculate routine.
5. HSC Geo reads the calculation results on the Output page and writes the values
in the “Calculation Results” window on the page named according to the routine.
6. HSC Geo performs steps 2-5 for the next sample.
Metso Outotec reserves the right to modify these specifications at any time without prior notice. Copyright © 2021, Metso Outotec Finland OyHSC – Geo - Mineralogical
Calculations and Mineral Database
31/46
Pertti Lamberg
December 11, 2020
Routines included
HSC Geo includes the following petrological and mineralogical calculation routines:
ARRANGE – Arrange routine
ANION – Anion proportions
CATION – Cation proportions
VF – Volatile free composition
SF – Composition of the sulfide fraction
VSF – Volatile and sulfide free composition
CIPW – CIPW normative mineral composition
REE_N – Normalization for rare earth elements
CUMNAME – Normative cumulus name for ultramafic-mafic igneous rocks
TRC – Calculate the normative trace element content in igneous minerals of
ultramafic-mafic rocks.
TRACE_N – Normalization for trace elements
ELEMENT – Elemental composition
OXIDE – Oxide composition
SF – Sulfide fraction
Normative minerals of the SF, i.e. sulfide fraction, are: pyrrhotite (FeS), pyrite (FeS2),
pentlandite (Ni4.76Fe4.24S8), chalcopyrite (CuFeS2), Co-pentlandite (Co9S8), arsenopyrite
(FeAsS), sphalerite (ZnS), molybdenite (MoS2) and galena (PbS). In calculation, all of
the sulfidic base metals are allotted in a single phase as follows: lead in galena,
molybdenum in molybdenite, zinc in sphalerite, arsenic in arsenopyrite, cobalt in Co-
pentlandite, copper in chalcopyrite, and nickel in pentlandite. The remaining sulfur and
iron are balanced between pyrrhotite and pyrite. The equations and chemical
composition of normative sulfide minerals are given in the table below.
When the weight percentages of normative sulfides have been calculated, trace
elements bound in sulfides: i.e. Os, Ir, Ru, Rh, Pt, Pd, Au, Re, Ag, Cd, Sn, Sb, Bi, Se,
Te and Hg, if analyzed, are added to the sulfides. Recalculation to 100% gives the
mineral composition and trace element content of the sulfide fraction. The chemical
composition of the sulfide fraction is calculated from mineral abundances as given in
the table below (step 8).
If only bulk assays are available, the chemical composition of a sulfide fraction is
calculated by setting the pyrite to zero and by following the guidelines given in the table
below. Since nickel and cobalt are also bound in non-sulfides, the calculation gives
either too high a pentlandite and cobalt pentlandite and consequently Ni and Co
content of the sulfide fraction, or residual sulfur ends up negative. In the latter case, all
normative sulfides are set to zero and S is allotted to pyrrhotite.
Although the sulfides of a sample may also contain other sulfides than those listed in
the table below, such as cubanite, gersdorffite, and various pyrrhotites (troilite,
monoclinic and hexagonal), the result of the chemical composition of the sulfide
fraction is more accurate and reliable than if a fixed sulfur content were used. If the
sulfide fraction is calculated from total analyses, then samples containing less than 2%
sulfides must be treated with caution for the above-mentioned reasons.
Metso Outotec reserves the right to modify these specifications at any time without prior notice. Copyright © 2021, Metso Outotec Finland OyHSC – Geo - Mineralogical
Calculations and Mineral Database
32/46
Pertti Lamberg
December 11, 2020
Calculation of the sulfide fraction and normative sulfide minerals.
(1) Weight percentages of chalcopyrite, pentlandite, cobalt pentlandite, sphalerite, galena, molybdenite and arsenopyrite are
calculated as given below in the Equation column. Content of elements in equations are weight percentages in the sample.
(2) Residual sulfur content is calculated. If it is negative, then all sulfides except pyrrhotite are set to zero, and pyrrhotite is calculated
according to step 4.
(3) If Fe analysis is carried out by the bromine-methanol method, then the amounts of pyrite and pyrrhotite are solved as follows:
36.48 53.45
writing in matrix format the mass balance: = , where S and Fe are residual sulfur and iron contents
63.52 0.07×46.55
after removing S and Fe bond in previously calculated sulfides. Po and Py are solved by the non-negative least square method.
(4) If Fe bromine-methanol analysis is not available, or the only Fe sulfide is pyrrhotite, then pyrite is set to zero and the pyrrhotite is
calculated according to the equation: Po=100*S/36.48.
(5) Trace elements in sulfides: Os, Ir, Ru, Rh Pt, Pd, Au, Re, Ag, Cd, Sn, Sb, Bi, Se, Te and Hg are added to the previously calculated
sulfides.
(6) Sum of minerals and trace elements is the normative sulfide content (the word normative may be left out)
(7) Minerals and trace elements are recalculated to 100%
(8) Normalization gives the trace element content in the sulfide fraction directly. The Cu, Ni, Co, Zn, Pb, Mo, and As content of the
sulfide fraction is back-calculated from the normative minerals. E.g. The Ni tenor: Ni_SF%=Pn_SF%*36.16/100. The iron and
sulfur contents are calculated by totaling the sulfur and iron content bound in each normative mineral.
Mineral Symbol Formula used Element wt.% Fe wt.% S wt.% Equation
Chalcopyrite Ccp CuFeS2 Cu= 34.63 30.43 34.94 Ccp=100*Cu/34.63
Pentlandite Pn Ni4.76Fe4.24S8 Ni= 36.16 30.64 33.20 Pn=100*Ni/36.16
Cobalt pentlandite Cpn Co9S8 Co= 67.40 0.00 52.94 Cpn=100*Co/67.40
Sphalerite Sp ZnS Zn= 67.10 0.00 32.90 Sp=100*Zn/67.10
Galena Ga PbS Pb= 86.60 0.00 13.40 Ga=100*ga/86.60
Molybdenite Mb MoS2 Mo= 59.94 0.00 40.06 Mb=100*Mo/59.94
Arsenopyrite Apy FeAsS As= 46.01 34.30 19.69 Apy=100*As/46.01
Pyrrhotite Po FeS 63.52 36.48 (3) or (4)
Pyrite Py FeS2 46.55 53.45 (3) or (4)
VF and VSF
The calculation of volatile-free (anhydrous) composition is a common practice in
petrological studies of mafic-ultramafic rocks and is a simple recalculation of selected
elements to 100%. The main problem is the distribution of total iron between sulfides
and the divalent and trivalent states in the rock, forming silicates and oxides. Iron
incorporated in sulfides can be solved as described above in the SF routine. The
proportion of ferric iron in mafic and ultramafic cumulates is normally low. This only has
to be taken into account when chromite, magnetite or ilmenite are present as a
cumulus mineral. In this study all non-sulfidic iron was calculated as total FeO in both
volatile and volatile- and sulfide-free calculations.
Volatile- and sulfide-free composition (VSF) is the anhydrous chemical composition of
the rock where the sulfides have been removed. When the composition of the sulfide
fraction has been calculated and the portion of base metals in the sulfides is known,
the calculation of volatile- and sulfide-free composition is a simple recalculation of
selected elements to 100%. If the composition of the sulfide fraction was determined
from the bromine-methanol leach, the recalculation is reliable even for samples rich in
sulfides.
The volatile- and sulfide-free composition (VSF) is very useful for Ni-Cu sulfide-bearing
samples: it can be applied to compare the host rocks of sulfide-rich samples with
ordinary cumulates and country rocks.
Metso Outotec reserves the right to modify these specifications at any time without prior notice. Copyright © 2021, Metso Outotec Finland OyHSC – Geo - Mineralogical
Calculations and Mineral Database
33/46
Pertti Lamberg
December 11, 2020
TRC
By mass balance, the concentration of an element E in a multi-phase mineral
assemblage can be expressed as the sum of the products of the molar proportions X
(as mass fractions of 1) times the concentrations W, of element E, in a mineral phase
Ma (Bedard 1994). The weight fraction of element E in a sample is
, = , ,
where WE,Ma is the weight fraction of element E in mineral Ma and XMa is the weight
fraction of mineral Ma in a sample. When the bulk composition (WE,T) and weight
fractions of minerals (XMa) are known, one can estimate the weight fraction of the
element in mineral WE,Ma by
applying the elemental partition coefficients between the minerals.
CUMNAME
To give the proper cumulus name for an igneous rock is often time-consuming. Thin
and polished sections of representative samples have to be studied. However, it has
been found that B-normative compositions are in good harmony with the actual primary
igneous mineralogy. Consequently, a cumulus naming procedure has been developed
on the basis of the CIPW norm.
A comparison of the CIPW norm with the cumulus name defined by microscopy names
made it possible to determine the threshold abundances above which minerals belong
to a cumulus phase. For normative orthopyroxene, clinopyroxene, and plagioclase it
was found to be roughly 25% and for normative olivine 10% (see table below). The
sum of the normative cumulus minerals identified in this way is higher than 50% in
cumulates, but less than 50% in non-cumulate rocks such as volcanites.
Automated cumulus naming procedure
A cumulus name consists of four parts; the naming rules in each part are as follows:
1 Cumulus minerals 2 Cumulus type 3 Cumulus/rock 4 Intercumulus minerals
index
Listed in the order of abundance If the rock is a cumulate, one of To distinguish if a Listed in the order of abundance
using the following abbreviations. the following symbols is used to rock is cumulate or using the following abbreviations.
The normative abundance must be describe the amount of cumulus non-cumulate: The normative abundance must be
above the given boundary. minerals. C=cumulate between the given boundaries.
o=olivine (>10%) A=adcumulate (cumulus (cumulus minerals b=orthopyroxene (10-25%)
b=orthopyroxene (>25%) minerals>93%) >50%) a=clinopyroxene (10-25%)
a=clinopyroxene (>25%) M=mesocumulate (cumulus R=non-cumulate p=plagioclase (10-25%)
p=plagioclase (>25%) minerals 75-93%) rock (cumulus
m=magnetite (>10%) O=orthocumulate (cumulus minerals 0.6%) minerals 50-75%)
t=apatite(>1%)
$=sulfides (>0.3%)
e.g. oMCa=olivine mesocumulate with clinopyroxene as intercumulus mineral; bRpa=non-cumulate rock where the main phase is
orthopyroxene and the other significant phases are, in the order of abundance, plagioclase and clinopyroxene
Metso Outotec reserves the right to modify these specifications at any time without prior notice. Copyright © 2021, Metso Outotec Finland OyHSC – Geo - Mineralogical
Calculations and Mineral Database
34/46
Pertti Lamberg
December 11, 2020
84.7. Modal calculations – mass proportion of minerals in samples
84.7.1. Background and theory
Modal calculation means converting the elemental grades of a sample to mineral
grades (Whiten, 2007)6. This is also called element to mineral conversion. The method
is traditional and provides a simple way to estimate modal mineralogy (i.e. mass
proportion of minerals in a sample) by solving simultaneously a set of mass balance
equations formulated between chemical elements and minerals. The method is
restricted to relatively simple mineralogy where the number of minerals is not larger
than the number of analyzed components and the chemical composition of minerals
(mineral matrix) is known. Mathematically, this can be written as follows:
× =
Where A is the matrix on the chemical composition of minerals (Mineral Matrix), x is the
vector including the unknown mass proportion of minerals (modal mineralogy) in the
sample and b is the vector on the analyzed chemical composition of the sample. The
unknown x can be found e.g. using the non-negative least square method (Lawson &
Hanson, 1995)2.
Element to mineral conversion can be improved by also using, in addition to
conventional whole rock analysis, mineral selective methods like bromine-methanol
leaching for nickel ores (Penttinen, Palosaari, & Siura, 1977)4, copper phase analysis
for copper ores (Lamberg, Hautala, Sotka, & Saavalainen, 1997)1 and Satmagan
analysis for iron ores (Stradling, 1991, Lund et al., 2013)5,3.
84.7.2. Simple calculation
Manual input
To give the chemical assays of samples manually, select Modal calculations.
Metso Outotec reserves the right to modify these specifications at any time without prior notice. Copyright © 2021, Metso Outotec Finland OyHSC – Geo - Mineralogical
Calculations and Mineral Database
35/46
Pertti Lamberg
December 11, 2020
In the ribbon, select Add column.
In the Select Elements window, select the elements the assays are for. Additionally,
you can also choose other type of analysis such as Satmagan (Sat), Loss of Ignition
(LOI), and moisture content (H2O). Alternatively you can also select mineral assays
(example: XRD Rietveld results) using the drop down in the bottom left corner. In this
example, assays are available for Cu and S. Click on Cu and S and then “Confirm
selection.”
Type in the sample ID and assays in the grid, for example as follows:
Metso Outotec reserves the right to modify these specifications at any time without prior notice. Copyright © 2021, Metso Outotec Finland OyHSC – Geo - Mineralogical
Calculations and Mineral Database
36/46
Pertti Lamberg
December 11, 2020
Calculation Rules
Press “Rules” to define the calculation rules.
In the Calculation window, the periodic table on the top shows the analyzed elements.
The next step is to define the minerals. Press Select Minerals on the left side of the
window.
In Select Minerals, type for instance the mineral name or other search criteria in the
first row. Here chalcopyrite is written and Geo shows all the chalcopyrite records
existing in the database. Select the record and press Add or double click the
record.
Metso Outotec reserves the right to modify these specifications at any time without prior notice. Copyright © 2021, Metso Outotec Finland OyHSC – Geo - Mineralogical
Calculations and Mineral Database
37/46
Pertti Lamberg
December 11, 2020
Continue until all the minerals existing in the samples have been selected. In this
example, the minerals are chalcopyrite, pyrite and quartz. Press OK when ready.
The next step is to define the rules for calculations. In this case, the rules are as
follows:
Chalcopyrite and pyrite are calculated from the Cu and S assays
Quartz is the remaining, i.e. 100-others
Select the minerals (chalcopyrite and pyrite) and press to move them to the list of
phases (in Round 1).
Now select the elements, i.e. click on Cu and S to move them to the list of elements.
The color of Cu and S changes to red indicating that they have been used in the
calculations.
Metso Outotec reserves the right to modify these specifications at any time without prior notice. Copyright © 2021, Metso Outotec Finland OyHSC – Geo - Mineralogical
Calculations and Mineral Database
38/46
Pertti Lamberg
December 11, 2020
Press “Add Round” to add another round for quartz.
Select and move quartz to the list of phases and press to set quartz as the
remaining, i.e., 100 – (Chalcopyrite + Pyrite). The calculation rules are now defined. In
case you want to reset these rules, you can press Reset
Press Calculate
Metso Outotec reserves the right to modify these specifications at any time without prior notice. Copyright © 2021, Metso Outotec Finland OyHSC – Geo - Mineralogical
Calculations and Mineral Database
39/46
Pertti Lamberg
December 11, 2020
Studying the calculation result
The result is shown in seven tabs:
- Modal gives the mineral mass proportions (wt%)
- Distribution is for calculating the distribution of elements between the minerals
- Fraction is for calculating the composition of a given mineral fraction
- Residual gives the residue of the calculation
- Bulk Ch. gives the back-calculated chemical composition of the samples
- Notes/Statistics is for error estimation
- “Initial values” shows the sample analyses and mineral matrix
In the Modal sheet, each sample is listed horizontally, mineral grades are given as
wt%, the total is displayed, and SG is the calculated specific gravity (density) of the
sample. Please note that when calculating density, the missing part (i.e. if the sum is
below 100) is not taken into account. The calculation is made as if the modal
mineralogy were normalized to 100%.
Instead of selecting one mineral to be the remaining (as quartz in this example), the
modal result can also be normalized proportionally so that the sum of all minerals
become 100%. This is done by selecting normalize in the top ribbon.
In the pop up window, you can select on how the result should be normalized. You can
either select the total sum of the minerals to be 100 (adjustable) or select phases to sum
up to a certain amount.
Metso Outotec reserves the right to modify these specifications at any time without prior notice. Copyright © 2021, Metso Outotec Finland OyHSC – Geo - Mineralogical
Calculations and Mineral Database
40/46
Pertti Lamberg
December 11, 2020
To calculate the distribution of any element between minerals, select the Distribution
tab and select the element from the periodic table.
To calculate the composition of a mineral fraction, select the Fraction tab, select and
move the minerals to the list of minerals in the fraction and press “Calculate Fraction.”
Minerals in the fraction are normalized to 100% and the chemical composition of the
mineral fraction is displayed. The fraction is used for estimating the composition of bulk
sulfide concentrate, for example.
Metso Outotec reserves the right to modify these specifications at any time without prior notice. Copyright © 2021, Metso Outotec Finland OyHSC – Geo - Mineralogical
Calculations and Mineral Database
41/46
Pertti Lamberg
December 11, 2020
Residual (in the Residual tab) shows the residue of the calculation. You can display the
result either on an Absolute or Relative basis.
Bulk Chemistry (in the Bulk Ch. Tab) shows the chemical composition of the sample
when back-calculated from the modal composition (x) and chemical composition of
minerals (A matrix).
Pressing “Graph” on different sheets (Modal and Distribution sheets) will show the
result in a graphical format.
Metso Outotec reserves the right to modify these specifications at any time without prior notice. Copyright © 2021, Metso Outotec Finland OyHSC – Geo - Mineralogical
Calculations and Mineral Database
42/46
Pertti Lamberg
December 11, 2020
Metso Outotec reserves the right to modify these specifications at any time without prior notice. Copyright © 2021, Metso Outotec Finland OyHSC – Geo - Mineralogical
Calculations and Mineral Database
43/46
Pertti Lamberg
December 11, 2020
Error Estimation
In the modal calculation, you can also take into account the analytical and sampling
errors involved in obtaining the chemical assay. This is done in Error Estimation
window under “Rules”. The calculation rules must already be defined before doing error
estimation.
Press “Regenerate CV-tables” to generate the coefficient of variations (CV) for the
analyses. CV is also known as relative standard deviation (RSD).
Metso Outotec reserves the right to modify these specifications at any time without prior notice. Copyright © 2021, Metso Outotec Finland OyHSC – Geo - Mineralogical
Calculations and Mineral Database
44/46
Pertti Lamberg
December 11, 2020
The top sheet refers to the relative standard deviation (RSD) of the chemical analysis
of each sample (example: XRF analysis). In this case, we have the chemical analysis
of Cu and S respectively for all four samples.
The bottom sheet refers to the relative standard deviation (RSD) of the elemental
analysis of each mineral (example: electron microprobe analysis). In this case, we have
defined the minerals to be Chalcopyrite, Pyrite, and Quartz. Each elemental analysis
for each mineral has its own RSD.
After entering all the RSD values accordingly, you can adjust how many calculation
rounds that you want. Then press “Run Monte Carlo Simulation”. The result is available
in “Notes/Statistics” tab under “Result”.
The result of the error estimation is given in five tabs:
- Average ± 1 Sigma gives the modal calculation results in the form of average
modal mineralogy plus minus the standard deviation.
- Average gives the average modal mineralogy
- StdDev gives the standard deviation of the modal mineralogy
Metso Outotec reserves the right to modify these specifications at any time without prior notice. Copyright © 2021, Metso Outotec Finland OyHSC – Geo - Mineralogical
Calculations and Mineral Database
45/46
Pertti Lamberg
December 11, 2020
- Min-Max gives the minimum and maximum range of the modal mineralogy.
- CV gives the CV / RSD of the modal mineralogy.
Monte Carlo Simulation for Error Estimation
In principal, the Monte Carlo method simulates a distribution of input data to a model,
so that the output of the model can be given as a probability distribution of possible
outcomes. The model here is the element to mineral conversion routine; we want to
see the modal mineralogy if the chemical assays and elemental analysis of the
minerals is not a single value, but rather a distribution of multiple values with a certain
variability.
This is very useful since in real life, we would not have just one chemical assay; we
usually repeatedly perform chemical assays and in some cases with multiple samples.
Since assays costs money, it would be unfeasible to perform a large amount of
assaying just to evaluate the variability and its effect to the modal mineralogy
calculation. However, if we understand the typical variability of the assays, we can use
this knowledge to simulate a large amount of assay to be used for modal mineralogy
calculation.
Metso Outotec reserves the right to modify these specifications at any time without prior notice. Copyright © 2021, Metso Outotec Finland OyHSC – Geo - Mineralogical
Calculations and Mineral Database
46/46
Pertti Lamberg
December 11, 2020
84.8. References
1. Lamberg, P., Hautala, P., Sotka, P., & Saavalainen, S. (1997). Mineralogical
balances by dissolution methodology, (1992), 1–29.
2. Lawson, C. L., & Hanson, R. J. (1995). Solving Least Squares Problems. Society
for Industrial and Applied Mathematics. doi:10.1137/1.9781611971217
3. Lund, C., Lamberg, P., & Lindberg, T. (2013). Practical way to quantify minerals
from chemical assays at Malmberget iron ore operations – An important tool for
the geometallurgical program. Minerals Engineering, 49, 7–16.
doi:http://dx.doi.org/10.1016/j.mineng.2013.04.005
4. Penttinen, U., Palosaari, V., & Siura, T. (1977). Selective dissolution and
determination of sulphides in nickel ores by the bromine-methanol method. Bull
Geol Soc Finland. Retrieved from
http://scholar.google.com/scholar?hl=en&btnG=Search&q=intitle:Selective+dissol
ution+and+determination+of+sulphides+in+nickel+ores+by+the+bromine-
methanol+method#0
5. Stradling, A. (1991). Development of a mathematical model of a crossbelt
magnetic separator. Minerals Engineering, 4, 733–745. Retrieved from
http://www.sciencedirect.com/science/article/pii/089268759190061Y
6. Whiten, B. (2007). Calculation of Mineral Composition From Chemical Assays.
Mineral Processing and Extractive Metallurgy Review, 29(2), 83–97.
doi:10.1080/08827500701257860
Metso Outotec reserves the right to modify these specifications at any time without prior notice. Copyright © 2021, Metso Outotec Finland OyYou can also read


