The FCO Cockpit Global Bubble Status Report
←
→
Page content transcription
If your browser does not render page correctly, please read the page content below
The FCO Cockpit
Global Bubble Status Report

Jan-Christian Gerlach, Didier Sornette & Ke Wu

Chair of Entrepreneurial Risks
Department of Management, Technology and Economics
ETH Zurich
Scheuchzerstrasse 7
8092 Zurich, Switzerland

March 1st , 2019

                                          The FCO Cockpit - Global Bubble Status Report   1st Mar 2019
Contents

  About
  Methodology
  General Results
  Results per Asset Class
  Single Stocks
  Sectors
  Final Remarks
  Appendix

                            The FCO Cockpit - Global Bubble Status Report   1st Mar 2019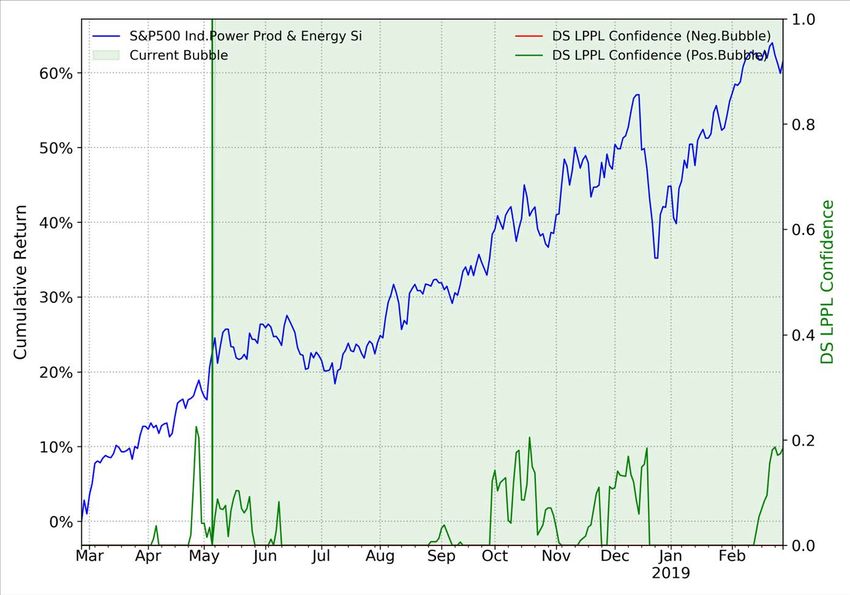
About

  The Financial Crisis Observatory (FCO) monthly report discusses the historical evolution of
  bubbles in and between different asset classes and geographies.

  It is the result of an extensive analysis done on the historical time series of about 450
  systemic assets and about 850 single stocks. The systemic assets are bond, equity and
  commodity indices, as well as a selection of currency pairs. The single stocks are mainly US
  and European equities. The data is from Thomson Reuters.

  In the first part of this report, we present the state of the world, based on the analysis of the
  systemic assets. In the second part, we zoom in on the bubble behavior of single stocks and
  discuss some specific cases.

  To new readers, we recommend proceeding to the appendix for more detailed information about the
  methodology and procedures applied in this report.

  For an intuitive explanation of the methodology and the specifics of the indicators that are used in this
  report, we refer to: D. Sornette and P. Cauwels, Financial bubbles: mechanisms and diagnostics. Review of
  Behavioral Economics 2 (3), 279- 305 (2015)
  http://arxiv.org/abs/1404.2140 and http://ssrn.com/abstract=2423790

                                                                     The FCO Cockpit - Global Bubble Status Report   1st Mar 2019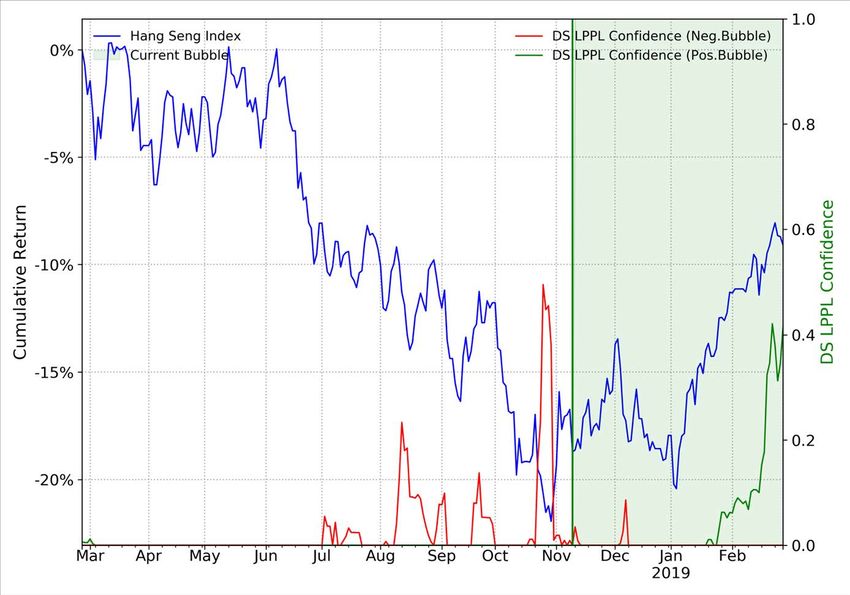
Methodology
We use the Log-Periodic Power Law Singularity (LPPLS) model to hunt for the distinct fingerprint of
Financial Bubbles. Basic assumptions of the model are:
 1. During the growth phase of a positive (negative) bubble, the price rises (falls) faster than
    exponentially. Therefore the logarithm of the price rises faster than linearly.
 2. There are accelerating log-periodic oscillations around the super-exponential price evolution that
    symbolize increases in volatility towards the end of the bubble.
 3. At the end of the bubble, the so-called critical time !" , a finite time singularity occurs after which
     the bubble bursts.
 Together, these effects encompass irrational imitation and herding phenomena amongst market
 participants that lead to blow-up and instability of asset prices.

                                                                   The FCO Cockpit - Global Bubble Status Report   1st Mar 2019
Bubble Regimes

                 The FCO Cockpit - Global Bubble Status Report   1st Mar 2019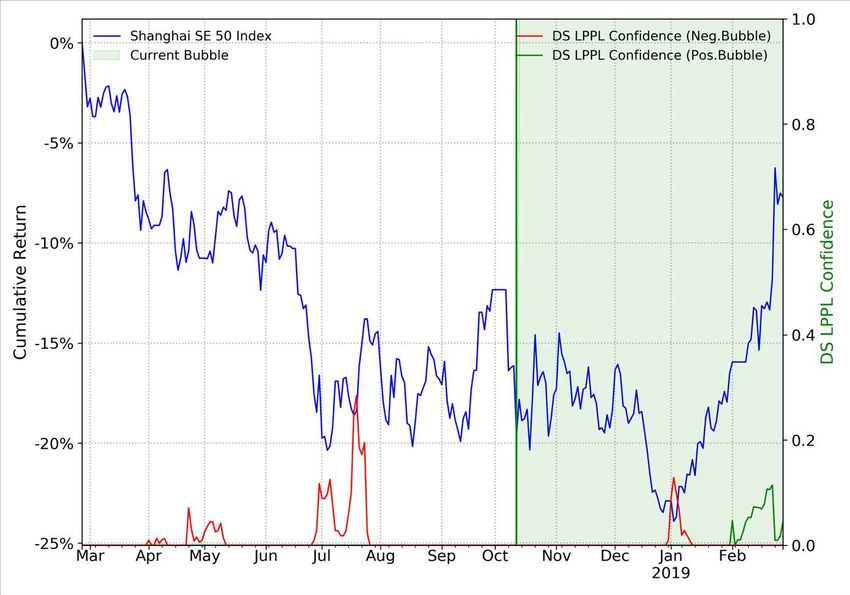
General Results – The Big Picture
              Historical evolution of the fraction of assets within an asset class that show
                                         significant bubble signals
  14%
                                                                                                                                                                    Fixed Income
  12%                                                                                                                                                               FPB

  10%                                                                                                                                                               Fixed Income
                                                                                                                                                                    FNB
  8%                                                                                                                                                                Equity FPB
  6%
                                                                                                                                                                    Equity FNB
  4%

  2%                                                                                                                                                                Commodities FPB

  0%
                                                                                                                                                                    Commodities FNB
        2-Mar-18

                   1-Apr-18

                              1-May-18

                                         31-May-18

                                                     30-Jun-18

                                                                 30-Jul-18

                                                                             29-Aug-18

                                                                                         28-Sep-18

                                                                                                     28-Oct-18

                                                                                                                 27-Nov-18

                                                                                                                                27-Dec-18

                                                                                                                                            26-Jan-19

                                                                                                                                                        25-Feb-19
  -2%
                                                                                                                                                                    Currencies FPB
  -4%

  -6%                                                                                                                                                               Currencies FNB
  -8%

                                                                             FPB – Fraction of Positive Bubbles, FNB – Fraction of Negative Bubbles
                                                                                                                             The FCO Cockpit - Global Bubble Status Report       1st Mar 2019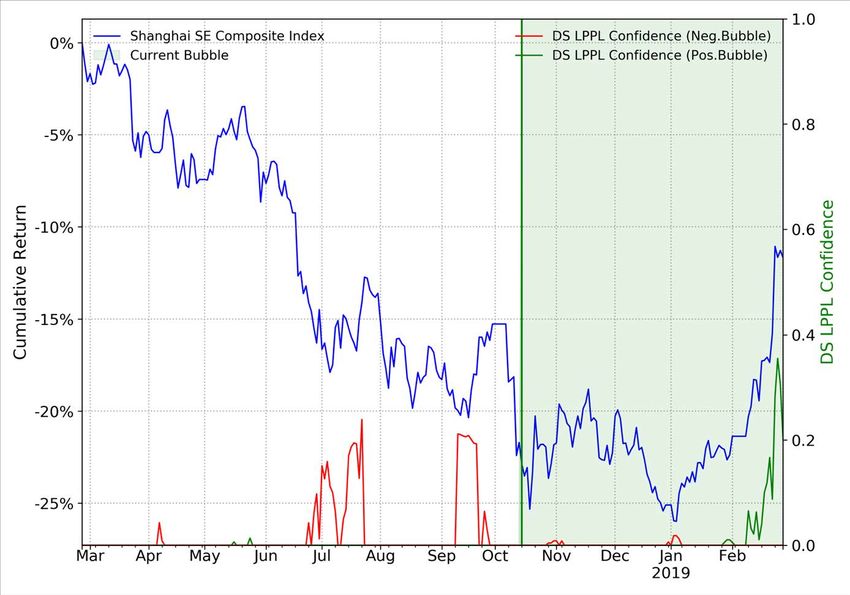
General Results – This Month’s Overview

 Throughout February, similarly as in January, bubble activity has remained at a low level, despite the
 recent appreciation of asset prices in many sectors. We however find that the price increase has put
 some of the analyzed assets into a positive bubble state. In the following, we discuss the few bubble
 signals in the Equity and Commodities sectors, as well as for Cryptocurrencies and evaluate some of
 the previous report’s predictions.

                                                                 The FCO Cockpit - Global Bubble Status Report   1st Mar 2019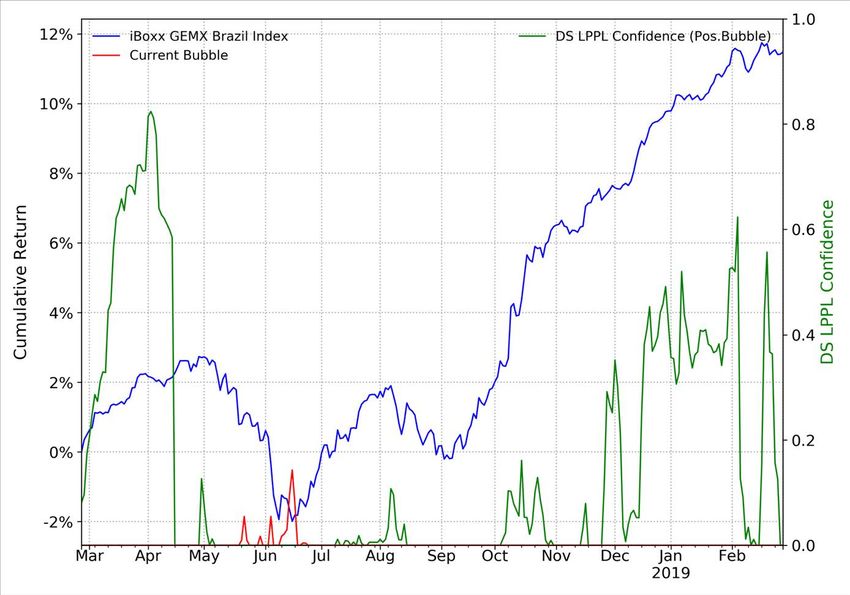
Equities – Country Indices

 Amongst the analyzed Equity stock indices, this month we find the Shanghai Index at the top of our
 positive bubbles list twice, followed by another Asian Index, the Hang Seng of Hong Kong. Detected
 bubble sizes range in 12-15% and the confidence indicator in 19-38%. The predicted critical times for
 the Shanghai Indices are both located in mid June 2019, suggesting that the forming positive bubble
 might still grow for some time. The corresponding indicator plots are shown on the following slides.
 Also shown are the Philippine and Brazil Indices which were highlighted in the previous report.

                                                                 The FCO Cockpit - Global Bubble Status Report   1st Mar 2019
The FCO Cockpit - Global Bubble Status Report 1st Mar 2019

The FCO Cockpit - Global Bubble Status Report 1st Mar 2019
The FCO Cockpit - Global Bubble Status Report 1st Mar 2019
The FCO Cockpit - Global Bubble Status Report 1st Mar 2019
The FCO Cockpit - Global Bubble Status Report 1st Mar 2019
Equities – United States Indices

 We find a number of US Equity Indices in positive bubble state at the beginning of March 2019. This
 accompanies the recently seen growth in global financial markets. The complete S&P500 has
 increased in value by more than 10% year-to-date. For the first listed index, as visible on the next
 slide, we see remarkable growth of more than 25% over the same time period. LPPLS Confidence
 Indicator values are at moderate sizes, ranging in 19-31%, while the bubble sizes are quite advanced,
 at up to 44%.

                                                                 The FCO Cockpit - Global Bubble Status Report   1st Mar 2019
The FCO Cockpit - Global Bubble Status Report 1st Mar 2019
The FCO Cockpit - Global Bubble Status Report 1st Mar 2019
Commodities

 The Palladium Excess Return Index has further grown during February, as compared to last month.
 By now, a bubble size of 47% (previously 39%) is reached, at a slightly risen indicator level of 84%
 (81%). In the last report, the predicted critical time was forecasted to 15th March 2019, while here,
 the predicted date is a bit earlier, at March 10th. Nevertheless, now, the scenario probability is
 approximately doubled with 68%, as compared to previous month’s 33%. A large scenario
 probability is based on the existence of a much larger number of LPPLS calibrations that are
 coincident in their fit parameters, which strengthens the signal. This circumstance reinforces the
 conclusion that the asset might soon undergo a change of regime.

                                                                 The FCO Cockpit - Global Bubble Status Report   1st Mar 2019
The FCO Cockpit - Global Bubble Status Report 1st Mar 2019
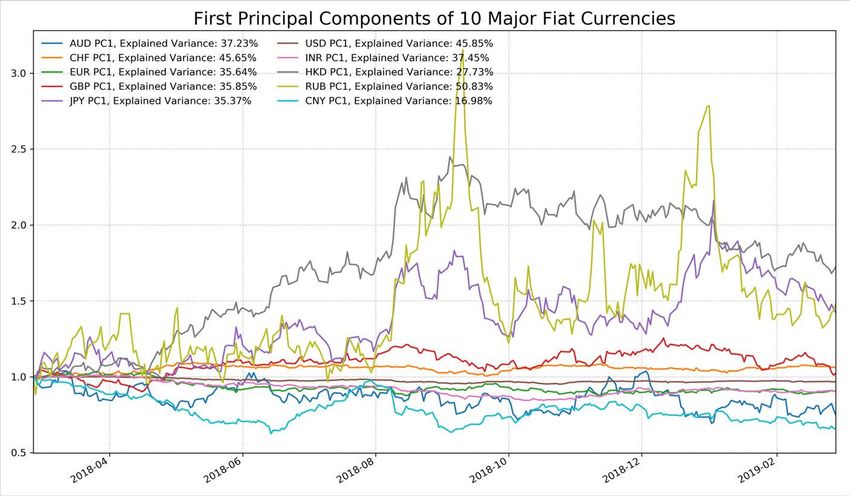
Currencies – PCA

   There are no relevant results to show for the forex sector. The PCA analysis of the major
   currencies is shown above. On the following slide, the results for the cryptocurrency sector
   are depicted.
                                                             The FCO Cockpit - Global Bubble Status Report   1st Mar 2019
Cryptocurrencies
For the first time since the big crash of the global cryptocurrency market in December 2017, positive
bubble signals for three cryptocurrencies exchange rate pairs (analyzed in USD) appear in our
analysis. The calculated values of the DS LPPLS Confidence Indicator are still in the lower range,
suggesting a small degree of super-exponential dynamics in the price. The measured durations of
the bubbles are about three to six months. Interestingly, for the first two coins, we see critical time
predictions for the second half of July 2019, which is more than a quarter in the future. This suggests
that the bubbles – which have already reached remarkable sizes (but relative to the expected sizes
of the CC market might still be small) – might still grow by a significant amount until the price level
becomes unsustainable and it crashes.
The FCO Cockpit - Global Bubble Status Report 1st Mar 2019Single Stocks
For 749 stocks, we calculate the bubble warning indicators as well as two financial
strength indicators, which indicate the fundamental value of the stock and the
growth capability respectively.
The stocks are the constituents of the Stoxx Europe 600, the S&P 500 and the
Nasdaq 100 indices. From these, all doubles and stocks with incomplete data are
removed. Because our financial strength indicators are specifically designed for
corporates, all financial institutions are taken out of the set as well.
The FCO Cockpit - Global Bubble Status Report 1st Mar 2019List of Indicators
To analyze the financial strength of individual stocks, we have two indicators. Both
scores give a value between zero and one, one being the best of the set and zero
the worst, so the higher the score, the higher the financial strength.
• A value score that is based on the ROIC (Return on Invested Capital) taking into
account the EV (Enterprise Value) to normalize for high/low market valuations
and/or high/low debt; Value scores are calculated by comparing ROIC level
versus EV/IC in each industry.
• A growth score that has characteristics similar to the PEG ratio, which is the
Price to Earnings ratio normalized by the expected growth of the EPS (Earnings
per Share).
The FCO Cockpit - Global Bubble Status Report 1st Mar 2019Single Stocks
By plotting the value score against
the aggregated bubble score, we
4 1 can divide the stocks into four
ye ian
bu trar
tre bu
r
quadrants*:
n
Co
nd yer
-fo
llow
1. Quadrant 1: Stocks with a
ing
strong positive bubble score
and a strong value score (e.g.
Roche Holding AG);
2. Quadrant 2: Stocks with a
strong positive bubble score
and a weak value score (e.g.
Workday Inc);
3. Quadrant 3: Stocks with a
strong negative bubble score
tre and a weak value score (e.g.
nd Beiersdorf AG);
-f
lle ian
se ollow 4. Quadrant 4: Stocks with
lle
r ing se trar
r
n
3 2 strong negative bubble score
co
and a strong financial strength
(e.g. Macy’s Inc)
*A strong positive bubble signal is identified if bubble score is larger than 10%, and a strong negative bubble signal is identified if bubble score is smaller than -10%.
A strong value score is identified if value score is larger than 60%, and a weak value score is identified if value score is smaller than 40%.
The FCO Cockpit - Global Bubble Status Report 1st Mar 2019Single Stocks
Each quadrant has its own specs:
1. Quadrant 1: Stocks with a strong value score are cheap relative to their earnings potential. The
strong positive bubble signal should be interpreted as a momentum indicator possibly the
consequence of a repricing based on the fundamentals. As an investor, one could be a trend-
following buyer.
2. Quadrant 2: Stocks with a weak value score are expensive relative to their earnings potential.
The strong positive bubble signal is an indication of sentiment and herding increasing the price until
it is not linked to fundamentals anymore. As an investor, one could be a contrarian seller.
3. Quadrant 3: These stocks are expensive relative to their earnings potential. On top of that,
there are clear negative bubble signals. Such stocks should be considered as falling knives. As an
investor, one could be a trend-following seller.
4. Quadrant 4: These stocks are cheap relative to their financial performance. The strong negative
bubble signal is an indication of sentiment and herding. These stocks can be considered as over-
sold. As an investor, one could be a contrarian buyer.
The FCO Cockpit - Global Bubble Status Report 1st Mar 2019Single Stocks
Quadrants 1 and 2 (stocks)
Strong positive bubble signals with strong (respectively weak) fundamentals
1 1
2 2
The FCO Cockpit - Global Bubble Status Report 1st Mar 2019Single Stocks
Quadrants 3 and 4 (stocks)
Strong negative bubble signals with weak (respectively strong) fundamentals
4 4
3
3
The FCO Cockpit - Global Bubble Status Report 1st Mar 2019Single Stocks
Quadrant 1 stocks: strong positive bubble signals with strong fundamentals
Bubble Bubble Value Growth
Company Name Country of Headquarters GICS Industry Group Name Yearly Return Bubble Size Start Score Score Score
BHP Group PLC United Kingdom Materials 21.1% 10.7% Oct-18 16.6% 68.0% 50.3%
Britvic PLC United Kingdom Food, Beverage & Tobacco 33.0% 21.9% Oct-18 17.2% 65.6% 13.4%
Coca Cola HBC AG Switzerland Food, Beverage & Tobacco 1.1% 8.5% Oct-18 16.4% 62.1% 71.8%
Novo Nordisk A/S Denmark Pharmaceuticals, Biotechnology & Life Sciences 6.7% 15.9% Oct-18 89.6% 99.1% 77.4%
Iberdrola SA Spain Utilities 27.0% 19.1% Sep-18 13.0% 68.4% 24.0%
Edenred SA France Commercial & Professional Services 34.3% 22.5% Oct-18 51.6% 95.3% 71.4%
Air France KLM SA France Transportation 21.1% 56.8% May-18 0.8% 96.4% 99.9%
KGHM Polska Miedz SA Poland Materials -1.2% 18.7% Oct-18 59.1% 84.1% 99.6%
Roche Holding AG Switzerland Pharmaceuticals, Biotechnology & Life Sciences 25.4% 16.2% Jul-18 45.5% 71.4% 24.4%
Entergy Corp United States of America Utilities 20.3% 16.3% Sep-18 67.5% 63.3% 12.8%
Exelon Corp United States of America Utilities 28.2% 16.0% Jul-18 18.7% 70.8% 80.2%
Foot Locker Inc United States of America Retailing 45.1% 27.1% Jul-18 42.0% 84.8% 26.8%
The FCO Cockpit - Global Bubble Status Report 1st Mar 2019Single Stocks - Quadrant 1 stocks
Quadrant 1 stocks: strong positive bubble signals with strong fundamentals
Example: Novo Nordisk A/S.
The above graph shows the one year cumulative return of the stock in blue (left hand scale), STOXX
600 in green (left hand scale) and the calculated DS LPPLS Bubble Score in red (right hand scale). The
green shaded period is the strong positive bubble we identified. The Bubble Score of this five month
bubble has reached 89.6% with a bubble size 15.9%.
The FCO Cockpit - Global Bubble Status Report 1st Mar 2019Single Stocks - Quadrant 1 stocks
Last month example: strong positive bubble signals with strong fundamentals,
Iberdrola SA.
The figure below plots the one year cumulative return of the stock (blue), STOXX 600 (green)
and LPPLS Bubble Score (red lines on the right y-axis). The green shaded period is the strong
positive bubble we identified and reported last month. The stock continued its appreciation
in the past month, which is in agreement with the strong fundamentals, but not with the DS
LPPLS indicator.
The FCO Cockpit - Global Bubble Status Report 1st Mar 2019Single Stocks - Quadrant 2 stocks
Quadrant 2 stocks: strong positive bubble signals with weak fundamentals
Yearly Bubble Bubble Bubble Value Growth
Company Name Country of Headquarters GICS Industry Group Name Return Size Start Score Score Score
Incyte Corp United States of America Pharmaceuticals, Biotechnology & Life Sciences -0.6% 38.1% Oct-18 17.3% 0.1% 87.3%
Starbucks Corp United States of America Consumer Services 19.3% 19.3% Mar-18 36.2% 9.1% 63.7%
Workday Inc United States of America Software & Services 38.6% 42.8% Oct-18 19.3% 0.8% 49.5%
Xilinx Inc United States of America Semiconductors & Semiconductor Equipment 67.0% 79.1% Apr-18 21.8% 15.5% 43.8%
Experian PLC Ireland; Republic of Commercial & Professional Services 22.4% 11.6% Oct-18 32.5% 14.2% 49.3%
Halma PLC United Kingdom Technology Hardware & Equipment 31.4% 24.3% Oct-18 100.0% 13.8% 38.3%
Huhtamaki Oyj Finland Materials -11.8% 21.2% Oct-18 18.9% 16.4% 23.0%
Jeronimo Martins SGPS SA Portugal Food & Staples Retailing -10.8% 15.1% Oct-18 29.8% 31.5% 90.1%
American Water Works Company Inc United States of America Utilities 24.5% 22.2% May-18 43.0% 18.2% 68.5%
Nextera Energy Inc United States of America Utilities 18.6% 14.2% Jun-18 1.4% 27.2% 78.2%
Procter & Gamble Co United States of America Household & Personal Products 25.1% 33.4% Apr-18 22.2% 39.1% 47.0%
Southern Co United States of America Utilities 13.8% 17.0% Sep-18 34.7% 39.9% 41.0%
Varian Medical Systems Inc United States of America Health Care Equipment & Services 9.0% 20.3% Aug-18 37.3% 22.0% 86.0%
The FCO Cockpit - Global Bubble Status Report 1st Mar 2019Single Stocks - Quadrant 2 stocks
Quadrant 2 stocks: strong positive bubble signals with weak fundamentals
Example: Halma PLC.
The above graph shows the one year cumulative return of the stock in blue (left hand scale), STOXX 600
in green (left hand scale) and the calculated DS LPPLS Bubble Score in red (right hand scale). The green
shaded period is the positive bubble we identified. The Bubble Score of this five month bubble has
reached 100% with a bubble size 24.3%. The strong positive bubble signals and weak fundamentals
indicate a high probability of correction in the future.
The FCO Cockpit - Global Bubble Status Report 1st Mar 2019Single Stocks - Quadrant 2 stocks
Last month example: strong positive bubble signals with weak fundamentals,
Workday Inc.
The figure below plots the one year cumulative return of the stock (blue), NASDAQ 100 (green)
and LPPLS Bubble Score (red lines on the right y-axis). The green shaded period is the strong
positive bubble we identified and reported in last month. Note that the stock price has
started a small correction in recent days after a further draw up at the beginning of the past
month, which is in agreement with the weak fundamentals and our DS LPPLS indicator.
However, one should remain cautious as the stock is still identified with strong positive
bubble signal this month.
The FCO Cockpit - Global Bubble Status Report 1st Mar 2019Single Stocks - Quadrant 3 stocks
Quadrant 3 stocks: strong negative bubble signals with weak fundamentals
Yearly Bubble Bubble Bubble Value Growth
Company Name Country of Headquarters GICS Industry Group Name Return Size Start Score Score Score
Beiersdorf AG Germany Household & Personal Products -4.7% -14.1% May-18 -16.5% 17.6% 89.5%
Axel Springer SE Germany Media & Entertainment -24.9% -24.9% Apr-18 -7.5% 20.4% 88.1%
thyssenkrupp AG Germany Materials -39.3% -39.3% Mar-18 -8.0% 24.0% 2.3%
The FCO Cockpit - Global Bubble Status Report 1st Mar 2019Single Stocks - Quadrant 3 stocks
Quadrant 3 stocks: strong negative bubble signals with weak fundamentals
Example: Beiersdorf AG.
The above graph shows the one year cumulative return of the stock in blue (left hand scale), STOXX
600 in green (left hand scale) and the calculated DS LPPLS Bubble Score in red (right hand scale). The
red shaded period is the negative bubble we identified. The Bubble Score of this ten month bubble
has reached 16.5% with a bubble size -14.1%.
The FCO Cockpit - Global Bubble Status Report 1st Mar 2019Single Stocks - Quadrant 3 stocks
Last month example: strong negative bubble signals with weak fundamentals,
Reckitt Benckiser Group PLC.
The figure below plots the one year cumulative return of the stock (blue), STOXX 600 (green)
and LPPLS Bubble Score (red line on the right y-axis). The red shaded period is the strong
negative bubble we identified and reported in last month. The stock had a strong rebound
followed by a drawdown again in the past month, which is in agreement with the DS LPPLS
indicator and the weak fundamentals.
The FCO Cockpit - Global Bubble Status Report 1st Mar 2019Single Stocks - Quadrant 4 stocks
Quadrant 4 stocks: strong negative bubble signals with strong fundamentals
Yearly Bubble Bubble Bubble Value Growth
Company Name Country of Headquarters GICS Industry Group Name Return Size Start Score Score Score
Norsk Hydro ASA Norway Materials -28.6% -33.1% Jun-18 -14.2% 78.6% 94.5%
AbbVie Inc United States of America Pharmaceuticals, Biotechnology & Life Sciences -30.3% -22.1% May-18 -9.3% 65.7% 73.4%
Macy's Inc United States of America Retailing -15.0% -38.9% Jun-18 -15.6% 95.1% 4.7%
Vodafone Group PLC United Kingdom Telecommunication Services -33.3% -31.9% Apr-18 -15.6% 93.1% 2.7%
The FCO Cockpit - Global Bubble Status Report 1st Mar 2019Single Stocks - Quadrant 4 stocks
Quadrant 4 stocks: strong negative bubble signals with strong fundamentals
Example: Macy's Inc.
The above graph shows the one year cumulative return of the stock in blue (left hand scale), S&P 500 in
green (left hand scale) and the calculated DS LPPLS Bubble Score in red (right hand scale). The red shaded
period is the strong negative bubble we identified. The Bubble Score of this nine month bubble has reached
15.6% with a bubble size -38.9%. We expect a rebound in the future, which is due to our diagnostic of a
negative bubble signal with strong fundamentals, calling for a contrarian buyer position.
The FCO Cockpit - Global Bubble Status Report 1st Mar 2019Single Stocks - Quadrant 4 stocks
Last month example: strong negative bubble signals with strong fundamentals,
Ingenico Group SA.
The figure below plots the one year cumulative return of the stock (blue), STOXX 600 (green)
and LPPLS Bubble Score (red line on the right y-axis). The red shaded period is the strong
negative bubble we identified and reported in last month. The stock stopped its drawdown and
started a strong rebound in the past month, which is in agreement with our DS LPPLS indicator
and the strong fundamentals.
The FCO Cockpit - Global Bubble Status Report 1st Mar 2019Sectors
Yearly Return Bubble Size Bubble Score Value Score Growth Score
GICS Industry Group Name Mar 1st Feb 1st Mar 1st Feb 1st Mar 1st Feb 1st Mar 1st Feb 1st Mar 1st Feb 1st
Pharmaceuticals, Biotechnology & Life Sciences 6.2% 2.9% 0.0% 0.0% 0.0% 0.0% 68.5% 66.2% 52.6% 49.0%
Consumer Services -0.7% -3.0% 0.0% 0.0% 0.0% 0.0% 32.4% 31.5% 50.7% 48.4%
Retailing 3.9% 3.5% 0.0% 0.0% 0.0% 0.0% 20.4% 18.4% 55.7% 58.5%
Transportation 1.5% -2.3% 0.0% 0.0% 0.0% 0.0% 57.5% 62.4% 50.7% 49.7%
Consumer Durables & Apparel -1.7% -6.2% 0.0% 0.0% 0.0% 0.0% 37.3% 37.0% 59.2% 59.4%
Semiconductors & Semiconductor Equipment -11.5% -9.9% 0.0% 0.0% 0.0% 0.0% 64.1% 62.2% 38.7% 30.3%
Technology Hardware & Equipment -2.0% -3.9% 0.0% 0.0% 0.0% 0.0% 68.9% 74.1% 41.5% 41.9%
Automobiles & Components -17.1% -19.2% 0.0% 0.0% 0.0% 0.0% 74.6% 77.6% 56.5% 52.9%
Telecommunication Services -6.5% -8.2% 0.0% 0.0% 0.0% 0.0% 67.4% 66.1% 32.3% 35.6%
Energy 0.3% -3.6% 0.0% 0.0% 0.0% 0.0% 53.2% 53.2% 51.0% 46.4%
Software & Services 6.5% 2.9% 0.0% 0.0% 0.0% 0.0% 37.8% 39.6% 47.1% 47.5%
Materials -8.6% -13.1% 0.0% 0.0% 0.0% 0.0% 54.4% 53.1% 46.8% 43.3%
Health Care Equipment & Services 9.0% 8.8% 0.0% 0.0% 0.0% 0.0% 61.8% 68.5% 52.8% 59.1%
Capital Goods -6.9% -12.5% 0.0% 0.0% 0.0% 0.0% 46.6% 47.9% 50.7% 51.0%
Media & Entertainment 10.0% 3.6% 0.0% 0.0% 0.0% 0.0% 37.8% 30.7% 43.0% 52.6%
Commercial & Professional Services 6.4% 3.8% 0.0% 0.0% 0.0% 0.0% 34.2% 34.5% 49.8% 51.2%
Food & Staples Retailing 8.5% 1.1% 0.0% 0.0% 0.0% 0.0% 53.6% 52.2% 55.4% 64.3%
Household & Personal Products 7.4% 1.8% 0.0% 0.0% 0.0% 0.0% 37.1% 37.3% 49.5% 50.5%
Food, Beverage & Tobacco -6.4% -9.6% 0.0% 0.0% 0.0% 0.0% 48.5% 45.8% 59.0% 59.1%
Utilities 10.3% 9.5% 0.0% 0.0% 0.0% 0.0% 51.6% 53.3% 43.5% 44.7%
Insurance -2.8% -7.4% 0.0% 0.0% 0.0% 0.0% - - - -
Real Estate 4.7% 6.1% 0.0% 0.0% 0.0% 0.0% - - - -
Diversified Financials -11.0% -12.3% 0.0% 0.0% 0.0% 0.0% - - - -
Banks -14.8% -19.0% 0.0% 0.0% 0.0% 0.0% - - - -
The FCO Cockpit - Global Bubble Status Report 1st Mar 2019Portfolio Construction & Performance
Here we illustrate the methodology of the portfolio construction process based on the results
of our previous analyses.
For individual stocks that we identified in the 4 quadrants, we constructed 4 portfolios based
on the 4 quadrants defined in the last report. Each portfolio consists of all the stocks listed in
the corresponding quadrant.
(1)Trend-Following Long Stock Portfolio (TFLSP) is made of the stocks that have a positive
bubble signal as well as a strong value score. For instance, TFLSP November consists of all the
stocks listed in quadrant 1, identified in slide 37 of November 2017 FCO Report.
(2)Trend-Following Short Stock Portfolio (TFSSP) is made of the stocks that have a negative
bubble signal as well as a weak value score.
(3)Contrarian Long Stock Portfolio (CLSP) is made of the stocks that have a negative bubble
signal as well as a strong value score.
(4)and Contrarian Short Stock Portfolio (CSSP) is made of the stocks that have a positive
bubble signal as well as a weak value score.
The FCO Cockpit - Global Bubble Status Report 1st Mar 2019Portfolio Construction & Performance
At the same time, we also classified 20 industries into 4 quadrants, and
constructed 4 type of industry portfolios based on the 4 industry quadrants. Each
portfolio consists of all the stocks in the industries listed in the corresponding
quadrant. Following the same definitions as above, we have Trend-Following Long
Industry Portfolio (TFLIP), Trend-Following Short Industry Portfolio (TFSIP),
Contrarian Long Industry Portfolio (CLIP), and Contrarian Short Industry Portfolio
(CSIP).
In each month, we initiated 8 new portfolios based on the updated results. The
performance of every 8 portfolios we initiated since November 2017 are presented
in the next slide. All of the stocks in our portfolios are weighted by their market
capitalizations and we don’t consider transaction cost in the portfolio performance.
Since we started to use a new version of bubble signals and algorithm in
November 2017, we only present the portfolios we initiated in November 2017
and later.
The FCO Cockpit - Global Bubble Status Report 1st Mar 2019Portfolio Construction & Performance
This month, we find that Contrarian Long Portfolios outperformed among others due to the market appreciations in the past
month, which contributes to drawdowns of Short Portfolios at the same time. Contrarian Portfolios are more delicate to use
due to their sensitivity to timing the expected reversal and exhibit very volatile performances, indicating that most of
bubbles in the market are still dominating and that fundamentals have not yet played out. We expect trend-following
positions to perform in the months following the position set-up and then contrarian positions to over-perform over longer
time scales as the predicted corrections play out.
The FCO Cockpit - Global Bubble Status Report 1st Mar 2019Appendix
The FCO Cockpit - Global Bubble Status Report 1st Mar 2019Methodology
We use the Log-Periodic Power Law Singularity (LPPLS) model to hunt for the distinct fingerprint of
Financial Bubbles. Basic assumptions of the model are:
1. During the growth phase of a positive (negative) bubble, the price rises (falls) faster than
exponentially. Therefore the logarithm of the price rises faster than linearly.
2. There are accelerating log-periodic oscillations around the super-exponential price evolution that
symbolize increases in volatility towards the end of the bubble.
3. At the end of the bubble, the so-called critical time !" , a finite time singularity occurs after which
the bubble bursts.
Together, these effects encompass irrational imitation and herding phenomena amongst market
participants that lead to blow-up and instability of asset prices.
The FCO Cockpit - Global Bubble Status Report 1st Mar 2019The LPPLS Model
Mathematically, the simplest version of the log-periodic power law singularity model that describes
the expected trajectory of the logarithmic price in a bubble is given as:
!""!# ≔ %[ln "(*)] = . + 0 *1 − * 3 + *1 − * 3 [4 cos 9 ln *1 − * + 4: sin 9 ln *1 − * ]
5
The seven parameters describing the model dynamics are:
• . The finite peak (valley) log-price at the time *1 when the positive (negative) bubble ends.
• < The power law exponent.
• 0 The power law intensity.
• 45|: Magnitude coefficients of the log-periodic accelerating oscillations.
• 9 The log-periodic angular frequency of the log-periodic oscillations.
• *1 The critical time at which the bubble ends.
The set of seven model parameters is obtained by fitting the LPPLS formula to the price time series
via a combination of Ordinary Least Squares and nonlinear optimization. The resulting values of the
fit parameters reveal whether an asset is in a bubble state. Furthermore, the central parameter of
interest, the critical time *1 , may warn of an imminent crash.
The FCO Cockpit - Global Bubble Status Report 1st Mar 2019LPPLS Analysis of Price Time Series
In order to avoid overfitting and to continuously collect information about price dynamics, we scan asset log-
price trajectories for super-exponential price dynamics by sequentially fitting the LPPLS model in different time
windows to the underlying price series. The procedure is illustrated in the plot.
For a fixed fit window end time, !" , we select different window start times !#,% and fit the LPPL model in each of
the resulting windows. This gives one set of calibrated LPPL parameters per fit window. In our monthly report,
!" , the time of analysis is always the start of the month, i.e. the report date (1st July 2018 for the present report).
The FCO Cockpit - Global Bubble Status Report 1st Mar 2019The DS LPPL Confidence Indicator
As illustrated on the previous slide, for a fixed analysis time, !" , we iteratively perform LPPLS fits over
many different window start times !#,% . Based on the resulting sets of fit parameters (one per fit
window), we determine the bubble start time !#∗ , i.e. the time in the past at which the price (if it did)
entered a super-exponential bubble phase from a previous phase of normal price growth. For more
information on the determination of the bubble start time, we refer the reader to [1].
Next, we discard all fit results that correspond to windows with start time earlier than the bubble start
time !#∗ . Then, we filter parameters in each of the remaining fit calibrations according to filter criteria
established in [2]. The imposed filter boundaries are chosen such that only fits with model parameter
values that likely correspond to real bubble dynamics are accepted. Such fits are then marked as
qualified.
In order to fully capture the information that is contained in the remainder of the calibrations and
condense it to a meaningful figure, we have developed the DS LPPLS Confidence Indicator. The
indicator is calculated as the number of qualified fits divided by the total number of fits. It quantifies
the presence of super-exponential price dynamics obtained over various differently sized time
windows. A high value of the indicator signals that LPPLS signatures were detected on many
timescales. A low value shows that almost no bubble dynamics were found.
We distinguish between a positive bubble and a negative bubble confidence indicator.
[1] Demos, Guilherme and Sornette, Didier, Lagrange Regularisation Approach to Compare Nested Data Sets and Determine Objectively
Financial Bubbles' Inceptions (July 22, 2017). Swiss Finance Institute Research Paper No. 18-20. Available at
SSRN: https://ssrn.com/abstract=3007070 or http://dx.doi.org/10.2139/ssrn.3007070
[2] A. Johansen and D. Sornette, Shocks, Crashes and Bubbles in Financial Markets, Brussels Economic Review (Cahiers economiques de
Bruxelles) 53 (2), 201-253 (summer 2010) and papers at http://www.er.ethz.ch/media/publications/social-systems-
finance/bubbles_and_crashes_theory_empirical_analyses.html
The FCO Cockpit - Global Bubble Status Report 1st Mar 2019K-means Clustering for Critical Time Prediction
Following the methodology established in Gerlach, Demos and Sornette [1], we employ k-
means clustering to our LPPLS calibration results to find possible future scenarios for the
ending of a bubble. We are particularly interested in providing a prediction for the critical
time tc which, according to the mathematical definition of the log-periodic power law model,
is the time at which we can expect the change of regime in the price of an asset to occur.
As we fit the LPPLS model on many different time window sizes, we often encounter variation
in the LPPLS fit parameter sets that are obtained from each fit. The higher the similarity of
the resulting parameter sets, the more we trust in their prediction for the critical time
parameter. This idea of enhanced believability of results when they repetitively occur on
multiple time scales is also the foundation of the DS LPPLS Confidence Indicator.
We detect similar LPPLS fits by applying k-means clustering to the set of LPPLS calibrations
over all selected time windows. Here, we report the mean critical times !"# and standard
deviations $"# of the largest such cluster. Furthermore, as complement to the Confidence
Indicator, we report the associated scenario probability of the biggest cluster, defined as the
number of members in the largest cluster divided by the total number of fits. The scenario
probability is therefore a measure similar to the LPPLS Confidence, however with the
difference that no constraints are imposed on the parameters to find qualified fits for the
LPPLS confidence index.
[1] Gerlach, Demos and Sornette, Didier, Dissection of Bitcoin's Multiscale Bubble History (April 12, 2018). Swiss Finance Institute
Research Paper No. 18-30. Available at SSRN: https://ssrn.com/abstract=3164246 or http://dx.doi.org/10.2139/ssrn.3164246
The FCO Cockpit - Global Bubble Status Report 1st Mar 2019Result Presentation
We present the monthly results of our bubble analysis in the form of a table such as the example
given below.
In each table, we separately list assets that are in a positive, respectively, negative bubble state.
Furthermore, the table is divided into two sections, bubble data and cluster analysis.
The first section provides asset and estimated bubble characteristics (size and duration), as well as
the value of the confidence indicator. We rank assets according to their geometric average of the
absolute of bubble size and confidence indicator. In this way, we incorporate the bubble size into
the ranking.
In the table section cluster analysis, the prediction data of the two most probable bubble burst
scenarios are presented (see previous slide).
The FCO Cockpit - Global Bubble Status Report 1st Mar 2019Result Presentation
For each asset class, we also supply the confidence indicator time series for the bubble assets listed in
the tables. The plot shows the cumulative return (left y-scale, in %) of the analyzed price trajectory
(blue) since the beginning of the plot time range. We also plot the time series of the positive (green)
and negative (red) DS LPPLS Confidence indicators (right y-scale). The indicator time series are
calculated by repetitively applying the procedure described on the slide ‘The DS LPPLS Confidence
Indicator’ over moving window end times !" . Furthermore, if, at the last analyzed time, a non-zero
indicator value results, i.e. the asset is presently in a bubble state, we outline the time interval for the
positive (green shaded) or negative (red shaded) bubble from its beginning to present.
The FCO Cockpit - Global Bubble Status Report 1st Mar 2019Real Effective Exchange Rate Indices
98 Real Effective Exchange Rate (REER) Indices for different currencies are
investigated for bubble characteristics.
The (here CPI-weighted) REER Indices are a measure for the trading competitiveness
of the corresponding country.
In contrast to single currency cross rates, the REER is a rather absolute measure of
the domestic currency value because it is calculated versus a selection of other
currencies.
This has the advantage that, unlike with the methodologies that were used in
previous reports, positive and negative bubbles in the value of the currency can
clearly be distinguished, as visible in the table above.
The FCO Cockpit - Global Bubble Status Report 1st Mar 2019Currencies – Principal Component Analysis
As an alternative method to generate a base currency time series from a variety of the currency’s
cross rates, we apply a principal component analysis (PCA). In total, we perform the PCA for 10
major fiat currencies. For each currency, more than 100 cross rates are grouped into a time series
dataset, which, using PCA, is then condensed down into a single time series to which we apply our
LPPLS analysis. The time series is assembled according to the weights of the first principal
component (PC1) of the dataset. It is used as an aggregate representation of all currency cross
rates..
More precisely, taking for instance the Swiss franc as a base currency, we consider
N=100 currency crosses expressing how much the Swiss franc is valued in these N other
currencies. We calculate N time series of returns for the each cross with the base currency (Swiss
franc). We then perform a PCA on the dataset of these N return time series. The corresponding
PC1 represents the common factor explaining the largest part of the variance of the returns of
these N time series. It is interpreted as the embodiment of the real Swiss franc dynamics, filtering
out the impact of the other currencies. The LPPLS algorithm is then applied to this equivalent time
series.
The plot given in the first part of the report depicts the equivalent time series
constructed from the PC1 for each of the ten currency pairs. In the legend, the explained variance
of the PC1 is given for each currency. A high explained variance means that most of the crosses of
the base currency with other currencies move in a correlated way, which can be interpreted as
reflecting a common factor, namely the base currency’s intrinsic value dynamics.
The FCO Cockpit - Global Bubble Status Report 1st Mar 2019Value and Growth Score
To analyze the financial strength of individual stocks in the second part of the
report, we have two indicators. Both scores give a value between zero and one,
one being the best of the set and zero the worst, so the higher the score, the
higher the financial strength.
• A value score that is based on the ROIC (Return on Invested Capital) taking into
account the EV (Enterprise Value) to normalize for high/low market valuations
and/or high/low debt; Value scores are calculated by comparing ROIC level
versus EV/IC in each industry.
• A growth score that has characteristics similar to the PEG ratio, which is the
Price to Earnings ratio normalized by the expected growth of the EPS (Earnings
per Share).
The FCO Cockpit - Global Bubble Status Report 1st Mar 2019Visit the Financial Crisis Observatory for more information
http://www.er.ethz.ch/financial-crisis-observatory.html
The FCO Cockpit - Global Bubble Status Report 1st Mar 2019You can also read