Using Google Earth to Teach the Magnitude of Deep Time
←
→
Page content transcription
If your browser does not render page correctly, please read the page content below
Strategies for the Introduction of Neuroscience

Using Google Earth to Teach
the Magnitude of Deep Time
By Joel D. Parker

                                         T
Most timeline analogies of                        eaching deep time (the time      talks to mature audiences, receiving
geologic and evolutionary time are                scale of evolutionary, geo-      excellent feedback in all cases.
fundamentally flawed. They trade off              logic, and cosmological              The key difficulty with perceiving
the problem of grasping very long                 events) is one of the great      the magnitude of time is that a student
times for the problem of grasping        classroom challenges because the          cannot meaningfully relate an expe-
very short distances. The result is      lengths of time involved are outside      rienced length of time to any of the
an understanding of relative time        of human experience (Tretter et al.       commonly used timeline analogies
with little comprehension of absolute    2006; Hillis 2007; Catley and Novick      (clock face, calendar year, interior
time. Earlier work has shown that        2009; Jones and Taylor 2009). How-        building distances, toilet paper roll,
the distances most easily understood     ever, this extreme magnitude is one       playing fields, human body, etc.). In
by teachers and students are those       of the key learning objectives when       these spatial analogies, the length of
most people can experience directly.     teaching biological evolution be-         a student’s life, and sometimes all of
Thus most timeline analogies are         cause it is essential for Darwin’s        human written history, maps onto a
flawed by either overcompressing an      theory to work. Indeed, one of the        microscopic distance that cannot be
experienceable time or relying on an     main arguments used against evolu-        directly experienced. When the analo-
unexperienceable distance. Under         tion is that the Earth is not as old as   gous distances become microscopic,
the constraint of experienceability,     science says it is, and this remains      the perception problem is only shifted
the best timeline to distance scale      one of the primary misconceptions         from the very big to the very small.
must be at least 75 miles and            for not accepting Darwin’s theory         Perception at both ends of the spec-
no more than about 500 miles             (Cotner, Brooks, and Moore 2010).         trum is difficult, and students tend to
long. Using Google Earth, one            Traditionally, the problem with deep      lump events and sizes at either end
can construct such ideal timeline        time has been divided into two parts:     into a very big and a very small cate-
analogies relative to a point in the     teaching the relative order of events     gory, losing the differentiations within
classroom with locally adaptable         (relative time) and the comprehen-        these extreme categories (Tretter
markers for important events in          sion of the magnitude of deep time        et al. 2006). Indeed, precipitous drops
geologic time. I have used these         (absolute time). Most timeline analo-     in the accuracy of scale perception
analogies for several years in           gies work very well for relative time,    have been observed for scales below
university and public lectures to        but finding appropriate analogies for     the visible (micrometers) and those
great effect.                            absolute time remains a great prob-       beyond a million meters (about 600
                                         lem (Hillis 2007; Cotner, Brooks,         mi.; Tretter et al. 2006; Jones et al.
                                         and Moore 2010). Here, I describe a       2008). These results suggest that the
                                         locally adaptable analogy that works      widest distance scale that at least
   Copyright © 2011, National Science
      Teachers Association (NSTA).       to teach both relative and absolute       half of teachers and students can be
     Reprinted with permission from      time. The analogy consists of a lo-       expected to easily comprehend will
  Journal of College Science Teaching,
          Vol. 40, No. 5, 2011.          cal and culturally specific timeline      extend from just under a millimeter
                                         bounded at the both extremes by           to hundreds of kilometers.
                                         distances that can be physically ex-          If we construct a timeline analogy
                                         perienced. Such custom timelines          under the above constraints of human
                                         are easily made with Google Earth         experience on both the recent and
                                         (a free program downloadable from         distant ends of our timeline, then an
                                         http://earth.google.com/). I have         appropriate range of distance can be
                                         used this analogy in both first-year      determined. The smallest distance
                                         undergraduate lectures and in public      that a student might be able to ap-

                                                                                                   Vol. 40, No. 5, 2011       23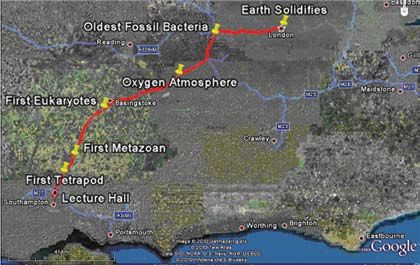
prehend by visualization without a         Figure 1
     microscope is about 0.5 mm (1/50th
     of an inch). The maximum range an          Step-by-step tips for using Google Earth to plot the analogy route.
     average student might experience           1. To start, open Google Earth and go to your presentation location, zoom in to the
     in the industrialized world is a driv-        highest magnification and place a marker on the building, then zoom out and
     able distance, which is the suggested         place a marker on your chosen landmark.
     reason for the 600 mi. (about 1,000
                                                   •   To get the initial route and distance right, click on your presentation location
     km) limit (Tretter et al. 2006). On the           marker, select “Directions to here,” then enter the location of your landmark
     time side, if we consider the longest             under the “Directions from” tab on the left. Click on the magnifying glass on the
     length of time experienced by a stu-              left window and a route will appear on the map.
     dent as his or her lifetime (about 18         •   The distance to enter in the yellow cell of the spreadsheet is found under the
                                                       Directions tab all the way at the bottom of the open route under Route.
     years), then for a college freshman           •   Clean up the route by removing the directions and associated markers (yellow
     we set 0.5 mm = 18 years. This gives              boxes with two black lines), untick all of the boxes in the tab except for the
     a scale of around 59 million years per            Route box.
     mile or about 37 million years per
                                                2. If you do not like the route chosen, then add markers at key positions on your
     kilometer. On this scale, the origin          preferred route by clicking on the thumbtack symbol and dropping the markers at
     of the Earth (4.6 billion years ago)          the correct location. You can then map routes sequentially from the presentation
     maps to about 75 mi. (121 km) away,           position by right clicking the destination side and choosing “Directions to here”
     well within our maximum limit. The            and right clicking the landmark side and clicking “Directions from here,” then click-
                                                   ing on the magnifying glass to show the route.
     analogy is then constructed from a
     specific point in the lecture hall (a         •   The various elements can be hidden or shown by unticking or ticking the ap-
     taped line) to some local landmark                propriate boxes under the Route tab to get one continuous marked route.
     at least 75 mi. away but less than a          •   The format of the line or lines can be modified by right clicking on the line and
                                                       choosing Properties. In Figure 1, the route color is changed to red, and the line
     day’s journey by car or train.                    thickness is increased.
         The freely available program
     Google Earth is ideally designed for       3. To get a distance on the route from the presentation location, click on the ruler
     creating these properly scaled local          symbol on the top menu and open the Path tab. The scale units can be adjusted
                                                   here. Once this tab is open, the cursor will change and you click once over your
     analogies. The program already has            exact position in the building. Then click along the path noting the cumulative
     a track record of being used for many         distances displayed in the Ruler tab.
     educational purposes (http://earth.
     google.co.uk/outreach/edu_culture.            •   Left clicking and holding down on the last position allows you to drag the
                                                       place holder while dynamically displaying the distance. This allows you to ex-
     html). The program can be used to plot            actly map evolutionary events from the spreadsheet. The distance units can be
     routes between chosen points and to               changed as you get further away (e.g., from feet to miles) from the presentation
     calculate distances between specific              location.
     points in different distance units. One       •   Right clicking removes the last position.
                                                   •   Pointing to an existing position and holding down the left mouse button al-
     can map any landmark that is the cor-             lows you to move that position.
     rect distance from a specific lecture/
     presentation location and create a         4. When the distance is exactly correct for some event on the spreadsheet, click on the
     locally ideal distance analogy. Thus,         thumbtack on the top menu bar and place a marker on the route at that point.
     Google Earth makes it practical to set        •   The title and style can all be entered and adjusted by right clicking on the
     up a rationally designed custom anal-             marker and selecting properties or in the box that appears when placing the
     ogy from almost any major university              marker.
     lecture hall in the world.                    •   To go back to the path mode, reclick on the Ruler tab on the menu bar.

     Methods and example                        5. All of the markers added to the map can be hidden from the Places tab. This allows you
                                                   to sequentially add or remove markers for use at different times in the presentation.
     Preparation
     Some initial time must be invested in      6. PowerPoint images can then be made with screen grabs or selecting Copy Pic-
                                                   ture under the File menu in Google Earth, followed by editing in your preferred
     customizing the exercise to go from           image program.
     the chosen landmark all the way to
     the interior of the building where the     7. To save your work, right click on the Route in the Places tab and select Save to My
     presentation is being given. In order         Places. Individual Place markers can be saved the same way. The route and markers
                                                   should then reappear next time you use Google Earth.
     to relate this to students’ real experi-
     ence, the instructor needs to select
     a landmark more than 75 mi. away

24   Journal of College Science Teaching
Using Google Earth to Teach the Magnitude of Deep Time
along a route that students are likely spreadsheet. The best estimates of the away and makes a good landmark
to have taken by car or train. The dates for critical events in geologic for this exercise location (see Table
teacher (or perhaps the student as an time are topics of great interest and ac- 1). I then put up a map of south-
assignment) first uses Google Earth tive research. Hence, it is a good idea ern England and ask students to
to generate the route and determines to recheck the literature periodically raise their hands. I trace the path
the distances for the chosen events to make sure that one is up-to-date from Big Ben to our location and
in time (see Figure 1). The route with the current sequence and timing ask students to lower their hand
can be adjusted as described in Fig- of events. I have provided a spread- when they think I have arrived at
ure 1, step 2. The total distance is sheet to convert time to distance with the stated event. The class’s guess
then put into an Excel spreadsheet some key dates that I have accumu- is when half the students have low-
to calculate the distances from a lated (www.soton.ac.uk/~jdparker/ ered their hands. This forces all of
line of tape placed on the floor in Google Earth timeline.xls). I cannot the students to participate, and af-
the lecture hall to the various events guarantee that they will be accurate ter a couple of guesses, the class
in geologic time along the chosen at the time of publication. warms to the exercise with every-
route. The key evolutionary and/or one participating. Students usually
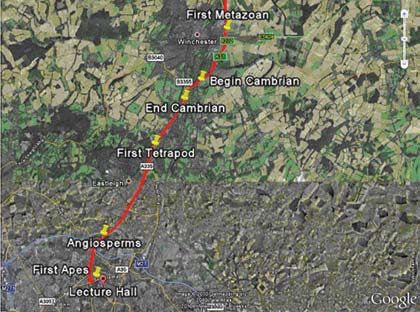
geologic events are then mapped The presentation come close to the origin of life (the
on the Google Earth map by plac- To introduce the analogy, I begin M25 ring highway around London)
ing markers along this route using by placing a piece of yellow tape but almost always miss Eukaryotic
the Ruler function. Screen captures on the floor in the front of the room cells (Basingstoke), the Cambrian
of the maps can then be used to and explain what I am doing. Here I explosion (around Winchester), and
produce PowerPoint slides at key give the rationale for why this anal- the extinction of the dinosaurs (just
points along the way or the program ogy is better than the traditional outside of town). I move on to show
itself might be used actively if there clock analogy. From a lecture hall them a map with the key events
is an open fast internet connection. at the University of Southampton marked. Figure 2 shows some typi-
One sometimes forgotten issue is on England’s southern coast, Big cal screen captures with labels at
the need to update the timeline in the Ben in London is exactly 78.4 mi various points from Table 1 along
the timeline. Events closer and on
TABLE 1
campus include India uniting with
Asia at walking distance on the
An example ideal scaled timeline.
edge of campus, and Hominids, our
Date Event Distance from line at presentation first upright walking ancestors, oc-
4.6 BYA Earth formation 78.4 mi. 126 km curring across the street from the
3.6 BYA First life 61.4 mi. 98.7 km local pub. Obviously, the analogy
2.7 BYA Oxygen atmosphere 46 mi. 74 km lends itself to many opportunities
1.5 BYA Eukaryotes arise 25.6 mi. 41.1 km for those who are comfortable with
670 MYA First Metazoan 11.4 mi. 18.4 km using humor in their teaching. The
542 MYA Begin Cambrian 9.2 mi. 14.9 km real lesson occurs inside the lecture
488 MYA End Cambrian 8.3 mi. 13.4 km hall where humans arise only 18
375 MYA First tetrapod 6.4 mi. 10.3 km
ft. (5.5 m) or so from the line and
140 MYA Angiosperms 2.4 mi. 3.8 km
Neanderthals continue until 3 ft.
25 MYA First apes 2,223 ft. 678 m
(about 90 cm) from the line. I use
a tape measure as a visual aid in-
10 MYA India connects to Asia 890 ft. 271 m
side the lecture theater. It is worth
6 MYA Earliest Hominid 534 ft. 162 m
pointing out that Biblical creation-
4.5 MYA Ardipithecus 400 ft. 122 m
ists place the origin of the Earth at
3 MYA Lucy 267 ft. 81.3 m
about 6.5 in. (16 cm) from the line
1 MYA Migration from Africa 89 ft. 27.1 m
as opposed to the 78.4 mi. (126 km)
200,000 yrs Homo sapiens arise 17.8 ft. 5.4 m
to Big Ben. This emphasizes the
34,000 yrs Neanderthals go extinct 3 ft. 92 cm
difference between the view of cre-
6,000 yrs Biblical age of Earth 6.4 in. 16.3 cm
ationists and science. The time of
2,000 yrs Christ 2.1 in. 5.4 cm
Christ occurs about 2 in. (5.4 cm)
18 yrs Student age 1/50th of an inch 0.5 mm
from the line. I end with the student
Note: BYA = billion years ago; MYA = million years ago; yrs = years. life span being about 1/50th of an
inch (0.5 mm) from the line and re-
Vol. 40, No. 5, 2011 25mind them to think about that when landmarks to correctly perceive dis- did show that we tend to use physi-
driving at 70 mph on the highway tances. At least one study on scale cal movement and anchor points to
to London for 30 minutes through perception and teaching omitted understand scale (Jones and Taylor
the prokaryotic world between Bas- this evolutionary explanation but 2009). Thus, using local geographi-
ingstoke and the M25.
The presentation length and level FIGURE 2
can be varied depending on the
amount of detail the instructor Three screen captures of the example timeline at various scales.
wishes to cover. I have used this as
a 10- to 25-minute section of larger
lectures on evolution and have re-
ceived outstanding feedback in com-
ments from students and older adult
public groups.
Discussion
There are very good reasons as to
why this geographic analogy has
proven so popular and effective.
First and foremost, it avoids the pit-
fall of trading off the incomprehen-
sibly large for the incomprehensibly
small. By shortening geologic time
too much, we lose the perspective
of real experienced time by over
compressing recent time. Getting it
right requires aligning the length of
time students can understand with
a distance that students can reason-
ably see and experience. The result
is a seamless linear scale from in-
side the room, to campus, through
to the highway distances. This is
not achievable in any other timeline
analogy scale. Hence, this scale may
be the only fit-for-purpose timeline
scale for teaching both relative and
absolute deep time.
The second reason the Google
Earth analogy works is because
humans are evolutionarily adapted
to think in terms of geography. We
are descended from hunter-gatherers
and tend to have very good geo-
graphical awareness. Indeed, some
memory competitors take advan-
tage of this trait by using a spatial
map (the journey method) to help
remember playing card orders dur-
ing competitive recall competitions
(O’Brien 1993). Cars and trains
have altered our perception of our
modern territory and foraging areas,
but we are still adapted to using
26 Journal of College Science TeachingUsing Google Earth to Teach the Magnitude of Deep Time
cal landmarks takes advantage of • Really put the timescale into themselves is an obvious extension
this natural innate predisposition perspective, was enjoyable and I of this method that is likely to im-
to achieve the learning objectives. was amazed. prove student understanding of this
This can also be highlighted in the essential concept. n
introduction of the analogy if the The first time that I used this time-
topic is evolution. line based on Google Earth, a specific References
Finally, by choosing a well-traveled question was included in the end of Catley, K.M., and L.R. Novick. 2009.
route and relating the events to lo- the course survey asking students to Digging deep: Exploring college
cal landmarks, students can review score this particular lecture on a scale students’ knowledge of macroevo-
and reexperience the analogy over of 1 to 5 (very poor to very good). It lutionary time. Journal of Re-
and over throughout their time at was scored at 4.5 with 59% giving search in Science Teaching 46 (3):
university and beyond. This allows the presentation a very good rating 311–332.
for constant reinforcement of the (61 students responding). I have Cotner, S., D.C. Brooks, and R.
exercise. Walking to class or going only received one negative comment Moore. 2010. Is the age of the
home for break literally turns into a suggesting that I “was making fun earth one of our “sorest troubles?”
study exercise. of creationists” and was “too hard Students’ perceptions about deep
The customization of the analogy on them” during a discussion of time affect their acceptance of
means that it can be used across cul- the Biblical age of the Earth. Since evolutionary theory. Evolution 64
tures and continents. The example is then, I am very careful to emphasize (3): 858–864.
given in southern England, but I can that creationists find science just as Hillis, D.M. 2007. Making evolution
imagine that an upper limit of 100 to outlandish to suggest that the world’s relevant and exciting to biology stu-
even 500 mi. might be used in parts age maps to 75 mi. away from the dents. Evolution 61 (6): 1261–1264.
of the United States and possibly even line instead of 6 in. The Biblical Jones, M.G., and A.R. Taylor. 2009. De-
500 to 1,000 mi. in Canada. In contrast, creation date and the contrast with veloping a sense of scale: Looking
train-travel distances might be a more the distance to the chosen landmark backward. Journal of Research in
appropriate standard for India and is a particularly important point to Science Teaching 46 (4): 460–475.
European nations. Truly meaningful make as the scale problem has been Jones, M.G., T. Tretter, A. Taylor, and
cultural and geographic- specific identified as one of the great prob- T. Oppewal. 2008. Experienced and
analogies can be constructed anywhere lems with convincing students of the novice teachers’ concepts of spatial
that is covered by Google Earth and validity of evolution (Hillis 2007; scale. International Journal of Sci-
where students are likely to have trav- Cotner, Brooks, and Moore 2010). ence Education 30 (3): 409–429.
eled more than 75 mi. (120 km). On such a timeline, the diversity of O’Brien, D. 1993. How to develop the
It is important to note that percep- life simply could not have evolved perfect memory. Cambridge, MA:
tion of deep time is a conceptual form within the times corresponding to Pavilion Books.
of learning (Sinatra, Brem, and Evans inside the lecture hall. Evolution can Sinatra, G., S. Brem, and E. Evans.
2008). Meeting the learning objective only be intellectually accepted with a 2008. Changing minds? Implica-
of understanding deep time is not time scale extending nearly 100 mi. tions of conceptual change for
really quantifiable, but a matter of a outside the lecture hall. teaching and learning about biolog-
Gestalt perception or feeling. Indeed, The concept of the great magni- ical evolution. Evolution: Educa-
the first time I felt like I truly appreci- tude of geologic time is an absolutely tion and Outreach 1 (2): 189–195.
ated deep time was when constructing critical component to understanding Tretter, T.R., M.G. Jones, T. An-
this timeline. The feedback from this how Darwin’s theory can explain the dre, A. Negishi, and J. Minogue.
analogy indicates that this objective origin of species. The magnitude can 2006. Conceptual boundaries and
is being met with many students and be grasped by analogy, but only if the distances: Students’ and experts’
members of the public telling me they analogy is on a human experience- concepts of the scale of scientific
were “blown away” or indicating that able scale. Teachers of evolution phenomena. Journal of Research in
this was the first time they really got should therefore opt for such scales Science Teaching 43 (3): 282–319.
the magnitude of time. Other com- when using analogies of deep time
ments received from course evalua- (fractions of inches to hundreds of
tions include the following: miles). As a lecturer, I found using Joel D. Parker (jdparker@soton.ac.uk)
Google Earth to make the slides a is a lecturer in biology in the School of
• Particularly liked the last lecture revelation for my own understand- Biological Science at the University of
with the visualisation of the time- ing of the magnitude of deep time. Southampton, Highfield Campus, in the
line it made it a lot clearer to me. Having students make such timelines United Kingdom.
Vol. 40, No. 5, 2011 27You can also read