Forecasting Gold Prices in India using Time series and Deep Learning Algorithms
←
→
Page content transcription
If your browser does not render page correctly, please read the page content below

International Journal of Engineering and Advanced Technology (IJEAT)
 ISSN: 2249-8958 (Online), Volume-10 Issue-5, June 2021

 Forecasting Gold Prices in India using Time series
 and Deep Learning Algorithms
 P. Sai Shankar, M. Krishna Reddy

 Abstract:The primary object of this paper is to compare the Time series can be defined as a sequence of data points
traditional time series models with deep learning algorithm.The which is ordered in sequence and collected at regular time
ARIMA model is developed to forecast Indian Gold prices using intervals. Time series approach can be used on any data which
daily data for the period 2016 to 2020 obtained from World Gold is changes over time. Time series are used in statistics, weather
Council.We fitted the ARIMA (2,1,2) model which exhibited the
 forecasting, sales forecasting, stock market predictions etc. In
least AIC values. In the meanwhile, MLP, CNN and LSTM
models are also examined to forecast the gold prices in India.
 decisions, that involve factor of uncertainty of the future, time
Mean absolute error, mean absolute percentage error and root series models found one of the most effective methods of
mean squared errors used to evaluate the forecasting forecasting. The classical time series analysis procedure
performance of the models. Hence, LSTM model superior than decomposes the time series data into four components: Trend,
that of the other three models for forecasting the gold prices in Seasonality, Cyclic and residual component.
India. There are a wide range of techniques to forecast the gold
 Keywords: Gold Prices, Box-Jenkins Methodology, prices. There are classic econometric and statistical techniques
ARIMA,Lag Variables, MLP, CNN and LSTMModels like the exponential smoothing method (ESM), autoregressive
 moving averages(ARMA), auto regressive integrated moving
 I. INTRODUCTION averages (ARIMA) etc., Although these methods are useful to
 capture the linear relationship and they fail to capture the non-
 Gold is a precious metal and it is completely different linear characteristics of gold prices. To tackle this problem,
from other assets and metals. It is highly liquid and sensitive artificial intelligence (AI) models are implemented to forecast
to price changes (Ranson and Wainwright, 2005). A the gold prices. The common methods are Feedforward neural
 networks, Multilayer perceptron (MLP), Recurrent neural
majority of gold is bought as jewelry items. In the gold
 networks (RNN), Convolutional neural networks (CNN) and
consumption, India and China together account almost 60%
 Long short term memory (LSTM).
of worldwide gold jewelry. Gold is consider as a traditional
gift in many weddings and often given away on the occasion
 II. MATERIALS AND MEHODS
offestivals, such as Diwali, Akshaya Tritiya and
Dantheras.Gold plays a unique role as a store of value and The data collected from World Gold Council of gold
hedge risks (Taylor, 1998; Hammoudeh et al., 2010). prices in Rupees per gram, daily frequency ranging from
People investing in gold have mainly two primary January 2016 to December 2020 consisting a total of 1304
objectives, one being hedge against inflation as over a observations. The train and test datasetsconsists of 1277 and
period of time (Baur and McDermott (2010) and Baur and 27 respectively. We built the model on train dataset and
Lucey (2010) and next is to mix your investment basket and predictions on test dataset.
hence diversify the risk and will help you reduce the overall
volatility of your portfolio. Typically the return on gold Table 1: Average Daily Gold Prices (Rs/gram)
investment is almost in line with the inflation rate. In Average Daily Gold Prices (Rs/gram) in India
modern days, people has to choose different ways to invest
 Mon Tue Wed Thu Fri
the gold by buying jewelleries which is safer way or by
purchasing goldcoins and bars which is available in public 2755.606 2756.874 2755.702 2756.907 2755.783
sector banks nowadays or by investing in Gold Exchange A. Review of Box and Jenkins Approach
traded fund (Gold ETF).Gold ETF is in financial instrument
 The Box–Jenkins methodology is one of the well known
of mutual fund in nature which in turn invests in gold and method in the field of time series. This method applies ARIMA
these are listed in a stock index. models to find the best fit of a time series to past values of this
 time series, in order to make accurate future forecasts. These
 methods are also commonly used when the data is not-
Manuscript received on April 24, 2021.
 stationarity.
Revised Manuscript received on May 03, 2021.
Manuscript published on June 30, 2021. Let{Zt} be the time series. Then {Zt} is stationary if E (Zt) = μ
* Correspondence Author and V (Zt) =σ2 for all t. Otherwise it is non –stationary. Let Z1
 P Sai Shankar*, Department of Statistics, University College of ,Z2….ZN be an observed sample. If there is no trend line and
Science (OU), Hyderabad (Telangana), India. Email: constant variance for allvalues of t in the time series plot, then
saishankar26@gmailcom
 Dr. M. Krishna Reddy, Department of Statistic, CVR College of
 the time series is said to be stationary. Alternatively, if the ACF
Engineering,and Technology, Hyderabad (Telangana), India. Email: of sample diesout slowly is an indication for stationary.
reddymk54@gmailcom

© The Authors. Published by Blue Eyes Intelligence Engineering and
Sciences Publication (BEIESP). This is an open access article under the CC
BY-NC-ND license (http://creativecommons.org/licenses/by-nc-nd/4.0/)

 Published By:
 Retrieval Number: 100.1/ijeat.D25370410421
 Blue Eyes Intelligence Engineering
 DOI:10.35940/ijeat.D2537.0610521
 and Sciences Publication
 Journal Website: www.ijeat.org 21 © Copyright: All rights reserved.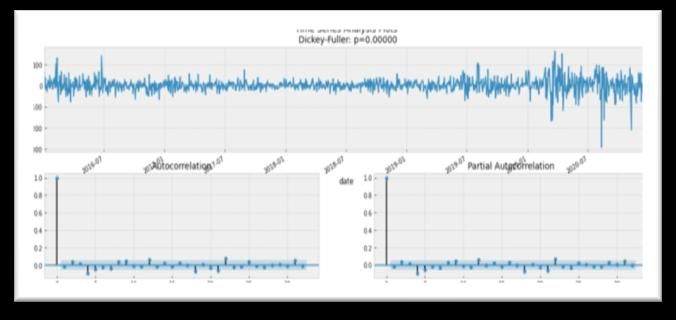
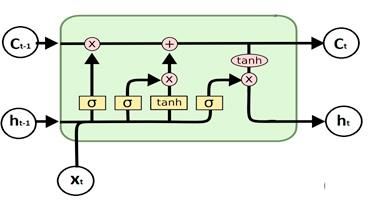
Forecasting Gold Prices in India using Time series and Deep Learning Algorithms

The Box – Jenkins Methodology is valid for only stationary
time series data. If the data is non – stationary, we convert it
into stationary by stabilizing mean using successive
differencing and stabilizing variance using logarithmic
transformation. The Auto Regressive Integrated Moving
Average model for the time series is denoted by ARIMA(p, d,
q) and is defined by ∇ = ( ) where = 1 −
 1 − 2 2 − ⋯ is polynomial in B of order p and is
known as Auto Regressive (AR) operator, = 1 − 1 −
 2 2 − ⋯ is a polynomial in B of order q and is known as
Moving Average (MA), operator, ∇= 1− B , B is the Backward
shift operator = − and d is the number of differences Figure 1. A simple schema of a three layer perceptron
required to arrive stationarity timeseries. AR(p), MA(q) and neural network
ARMA(p, q) may be obtained as particular case of it with
parameter values (p,0, 0), (0, 0, q) and (p, 0, q) respectively. Fig. 1 representing a network structure of MLPwhere
The four steps procedure forBox-Jenkins method: Identification neural network has three inputs and two hidden layers with
of model, Parameter estimation, diagnostic checking and finally four and three nodes and one output node (3-4-3-1). A
model forecast. simple single layer perceptron is illustrated in the form of
 equation in Eq. (1).
B. Review on Deep Learning Algorithms
 = =1 ∅ (1)
 In the study of ANN, the most popular algorithm is a
feed-forward neural network (FFNN). It has only forward In Eq. (1), the variable, x, is the input vector, ∅ is called
connections in between the neurons. ANNS are commonly the activation function and the output result of the MLP
used for time series forecasting. ANNs can model any form could be a number or a vector of zero numbers. The
of unknown relationship in the data with few assumptions. variable, w,is the weights and f is the output function. Log-
ANNmodels trained on train dataset and it can generalise on sigmoid, ReLUand hyperbolic tangent are the different
unseen data. Traditional time series are capable of modelling activation functions, which can be found in the neural
only liner relationships where as ANNs are capable of networks literature. Activation function is the core of any
modelling any form of relationship in the data, especially node in the hidden layers of MLP changes the input of the
non-linear relationships (Hornik et al., 1989). The node to the output. ReLUactivation function is used in this
forecasting accuracies are also better than other traditional research which is presented in Eq. (2)
time series models. In deep learning models, the most commonly used
 Tang et al. (1991) compared ARIMAmodel with deep activation function is Rectified Linear Unit. The function
learning model for forecasting and results show that deep returns for any positive value x it returns that value back and
learning models are better than the ARIMA. Claveria and
 0 if it receives any negative input. It can be written as
Torra (2014) studiedperformance of ANNs and traditional
 = 0, (2)
time series ARIMA and finally showed that ANNs are
higher accuratethan ARIMA model to a tourism-demand
forecasting problem. Zhang & Kline (2007) paper revealed
that the accuracy of the model is depends on the input
variables, best network structure and also training
procedure.
Multilayer Perceptron (MLP)
 A multilayer perceptron(MLP)is a class of feedforwad
artificial neural network(ANN). MLP Neural Networks can
be formed a relation between the input and output data and it
can be modelled by neural networks (Bildirici et al., 2010).It Figure 2. ReLU activation function
is an extension of feed forward neural network. A multilayer Long Short Term Memory (LSTM)
perceptron neural network with two hidden layers is
 RNNs are a most powerful type of artificial neural
depicted in Fig. 1 which consists of three types of layers—
 network that can internally maintain memory of the input. In
the first one input layer and output layer these two
 Recurent Neural networks(RNN) studies, one of the most
connected with hidden layers. In MLP, the input nodes are
 common algorithm is LSTM.
connected to the output nodes with the help of hidden layers
 The LSTM network is first developed by Hochreiter
in between the two layers. The input will be changed under
 & Schmidhuber. Since RNN has maintain memory gate, this
the effect of the hidden layers, which behave in nonlinear
 enables them particularly used for solving the time series
way and the results of the changes multiply the weights will
 problems.
be transferred to the output nodes.Unlike to a feed forward
network in a MLP the data flows in the forward direction
from input to output layer. The number of neurons are
trained with the back propagation learning algorithm. The
major use cases of MLP are forecasting, recognition,
prediction, pattern classification, and approximation.
 Published By:
 Retrieval Number: 100.1/ijeat.D25370410421 Blue Eyes Intelligence Engineering
 DOI:10.35940/ijeat.D2537.0610521 and Sciences Publication
 Journal Website: www.ijeat.org 22 © Copyright: All rights reserved.
International Journal of Engineering and Advanced Technology (IJEAT) ISSN: 2249-8958 (Online), Volume-10 Issue-5, June 2021 One of the drawback of RNNs isto suffer from a problem Batch size, Optimization algorithms: are SGD, ADAM and called vanishing gradient which leads to the model learning RMSProp becoming too slow or stopping altogether. LSTM models Measures: are developed such that To avoid the vanishing gradient problem. LSTMs have longer memories and can learn from If Zt is the actual price for period t and is the forecast, inputs that are separated from each other by long time lags. then the error is defined as e = Zt − . The following An LSTM has three gates: an input gate which determines measures may be considered whether or not to let the new input in, an output gate which 1 2 Root Mean Square Error (RMSE) = =1 decides what information to output and finally the import 1 gate which is a forget gate which deletes information that is Mean Absolute Percent Error (MAPE)= =1 × 100 not useful. These three gates are analog gates based on the 1 sigmoid function which works on the range 0 to 1which is Mean Absolute Error (MAE) = =1 shown in Fig. 3 below.LSTM component is a end-to-end feature (enclosed in green dash box) with a three-layer III. ARIMA MODEL model (consisted of input layer, LSTM unit layer and output Identification of Model layer). To fit any traditional time series model, the initial step is to check the stationarity condition. Stationarity can be determined from a time series plot which should show constant mean and variance. It can also be checked from an ACF plot. Specifically, very slow decay in the lags in ACF plots indicates a non-stationarity. Testing Stationary of Time Series The stationary condition can also be determined by the testcalled Augmented Dickey Fuller (ADF) unit root test. The hypothesis of the test are: Figure 3. A simple LSTM Architect The null Hypothesis H0: Xt is non – Stationary and Convolution Neural Networks (CNN) Alternative hypothesis H1: Xt is Stationary In deep learning, a CNN is a class of Deep learning The p-value of the Augmented Dickey-Fuller (ADF) test neural network, most commonly used for vision and image equals0.996 and it is larger than the value of alpha= 0.05. processing-based classification problems (object detection This result indicates that the time series of daily Gold Prices ,image classification, image segmentation, etc.). CNN are in India is not stationary. regularized versions of MLP. In MLP, each neuron in one layer connected with all then neurons of next layer. The ―full connectivity‖ of these networks make them prone overfitting of the data. Regularization is one way to deal the overfitting in the data. CNN take a different approach towards regularization. Figure 5: Time series plot of daily Gold Prices in India Fig 4. A simple CNN Architecture The backpropagation process has been used to train the model in CNN model,The tuning parameters of the CNN: Number of hidden layers Figure 6: ACF and PACF for daily Gold Prices in India Number of neurons in each layer Learning rate Activation functions: ReLu, Sigmoid Epochs, Published By: Retrieval Number: 100.1/ijeat.D25370410421 Blue Eyes Intelligence Engineering DOI:10.35940/ijeat.D2537.0610521 and Sciences Publication Journal Website: www.ijeat.org 23 © Copyright: All rights reserved.
Forecasting Gold Prices in India using Time series and Deep Learning Algorithms

All the above plots and results confirm that the original time Figure 7: Time series plot,ACF and PACF of the first
series data is non stationary, and need to apply some differences of daily Gold Prices in Indiaof the first
transformations to convert it into the stationary series. The differences of Daily Gold Prices in India.
differencing method is used to convert non-stationarytime
 Model Identification
series into stationary time seriesof the data. In this paper,
non seasonal difference of order 1 (i.e. d=1) is sufficient to This section shows how we determine the optimum
achieve stationary in mean and variance. The derived ARIMA model and identify the model specifications. We
variable .Wt = ∇1 t can now be examined for stationary. computed all relevant criteria by trial and error method to
 Figure (7) displays the time series plot of the data after select the best ARIMA model for the data. ACF and
first differencing the series and indicates that the time series PACFare used to determine the p and q values. The AR(P)
is a stationary series. To make sure of that, we conduct the model is taken from the PACF plot and MA(q) model is
unit roots test (Augmented Dickey-Fuller) for the drawn from the PACF.
transformed series Zt . From figure (7), the ACF starts from p1 value, this
 The p-value of the ADF test equals 0.00 which is less means that the series may be Auto Regressive (AR) and as
than the value of alpha=0.05 and this indicates that the non- we can observe the ACF cuts off after lag (4).On the same
stationary hypotheses of the differenced daily Gold Prices lines, it can be seen that the PACF of the stationary series
data is rejected and this demonstrates the success of cuts off after time lag (4).
difference transformation for the time series data of daily The following tentative models have been examined and
Gold Prices data. Thus, the series became stationary. estimated as shown in table (2) below. The best ARIMA
 model is chosen through the AIC criteria if it shows the
 lowest values of these criteria.

 Table (2): Tentative ARIMA Models Criteria for the daily Gold Prices in India.
 S.No Parameters AIC S.No Parameters AIC S.No Parameters AIC
 1 (2, 1, 2) 12,359.2 6 (2, 2, 1) 12,370.9 11 (4, 2, 2) 12,374.3
 2 (4, 2, 1) 12,361.7 7 (1, 2, 1) 12,371.2 12 (1, 1, 2) 12,374.8
 3 (4, 1, 1) 12,364.5 8 (3, 2, 2) 12,372.5 13 (2, 2, 2) 12,374.9
 4 (4, 1, 2) 12,366.4 9 (3, 2, 1) 12,372.8 14 (3, 1, 1) 12,375.0
 5 (3, 1, 2) 12,368.1 10 (1, 2, 2) 12,373.0 15 (2, 1, 1) 12,375.4
 Table: 3 Model Parameters of the ARIMA (2, 1, 2)
It is shown in table (2) that the ARIMA (2, 1, 2)is Model
significant with respect to parameters as well as adequacy of std P>|z
the model. This means that the ARIMA(2, 1, 2)model is coef err z | [0.025 0.975]
 -
superior among all the other models. ar.L1
 -0.5181 0.015 33.997 0 -0.548 -0.488
Parameters Estimation: -
 ar.L2
 Dep. Variable: Price -0.9352 0.019 49.252 0 -0.972 -0.898

 Model: ARIMA (2, 1, 2) ma.L1 0.4994 0.012 41.209 0 0.476 0.523
 Sample: 01-01-2016 - 24-11-2021 ma.L2 0.9742 0.013 72.402 0 0.948 1.001
 No. Observations: 1277
 sigma2 935.98 16.118 58.069 0 904.38 967.57
 AIC 12359.2
 BIC 12384.9 The fitted ARIMA model for the daily gold price in India is
 HQIC 12368.9 (1 + 0.52 + 0.93 2 ) = (1 − 0.50 − 0.97 2 )

 Published By:
 Retrieval Number: 100.1/ijeat.D25370410421 Blue Eyes Intelligence Engineering
 DOI:10.35940/ijeat.D2537.0610521 and Sciences Publication
 Journal Website: www.ijeat.org 24 © Copyright: All rights reserved.

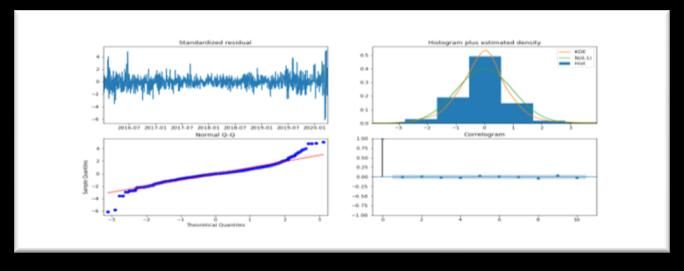
International Journal of Engineering and Advanced Technology (IJEAT)
 ISSN: 2249-8958 (Online), Volume-10 Issue-5, June 2021

Diagnostic Tests:
The autocorrelations and partial auto correlations of the
residuals plots are used for diagnostic checking.
Analysis of Residuals

 B. Long Short-Term Memory (LSTM)
 Python software has been used to train the LSTM model
 Figure (8): Residual Chart on evaluate the model on test dataset.

 Figure (8) show the estimated autocorrelation function for Structure of the Network:
the residuals of theARIMA (2, 1, 2)model for the time series
of daily Gold prices.
Box-Ljung Q- test statistic is used to test the adequacy of the
model. The hypothesis on the model is below:
H0: The ARIMA (2,1,2) model is adequate.
H1: The model is ARIMA(2,1,2) inadequate.

 Table (4): Ljung-Box Test Statistic
 Ljung-Box (Q): 0.06 Jarque-Bera (JB): 7091.2
 Prob(Q): 0.81 Prob(JB): 0
 Heteroskedasticity (H): 3.21 Skew: -0.67
 Prob(H) (two-sided): 0.00 Kurtosis: 14.47
 C. Convolutional neural networks (CNNs)
 Python software has been used to train the CNNmodel
 From the Table(4),the probability value of the test on evaluate the model on test dataset.
statistic is 0.81 which is greater than 0.05, therefore, we fails
to reject Ho. Hence, we conclude that the ARIMA (2,1,2) Structure of the Network:
model is an adequate model for the giventime series data.

 IV. DEEP LEARNING MODELS
 A. Multilayer Perceptron (MLP)
Python software has been used to train the MLP model on
evaluate the model on test dataset.
Structure of the Network:
 The MLP model consists of three: input layer, a hidden
layer and an output layer. Two input neurons considered in
this model, each representing the values of lag1 (previous
day price in the same week i.e. lag1 gold price) and lag2
(lag 2 gold price). One output unit is needed in this V. RESULTS AND DISCUSSION
modelwhich indicates the forecasts of daily gold price. Trial The train dataset is used to train the models. Several
and error approach can be usedto find the optimal number of traditional and deep learning models ARIMA, MLP, CNN
hidden units in the neural network. Typically we can use and LSTM are examined.Once we trained the dataset using
either the forward selection method or backward selectionto training dataset then we test the model on test dataset. The
arrive the optimumthe hidden layer units. In the forward performance measures are showed in the Table5. Figures 9–
selection method, we choose a small number of hidden 12 represents the line charts of actual gold price and
neurons then compute the network performance using predicted gold prices.
RMSE, MAE and MAPE values. In the next step increment .
the hidden neuronsby one until train and test error is
acceptably small or no further improvement is noted.

 Published By:
 Retrieval Number: 100.1/ijeat.D25370410421
 Blue Eyes Intelligence Engineering
 DOI:10.35940/ijeat.D2537.0610521
 and Sciences Publication
 Journal Website: www.ijeat.org 25 © Copyright: All rights reserved.
Forecasting Gold Prices in India using Time series and Deep Learning Algorithms

 Table 5: Accuracy measures for different models to 4500
 predict daily gold price (Rs/gram) in India 4450
 Forecasting Model Error Measures Train Set Test set 4400
 MAPE 0.7 2.19 4350
 4300
 ARIMA RMSE 70.1 110.55 4250
 MAE 21.68 97.07 4200
 MAPE 0.69 0.72 4150
 MLP RMSE 33.28 38.85 4100

 25-11-2020
 27-11-2020
 29-11-2020
 01-12-2020
 03-12-2020
 05-12-2020
 07-12-2020
 09-12-2020
 11-12-2020
 13-12-2020
 15-12-2020
 17-12-2020
 19-12-2020
 21-12-2020
 23-12-2020
 25-12-2020
 27-12-2020
 29-12-2020
 31-12-2020
 MAE 22.13 31.21
 MAPE 0.71 0.74
 CNN RMSE 33.95 39.93
 MAE 22.66 32.23 Price LSTM Pred_Price
 MAPE 0.65 0.69
 LSTM RMSE 31.46 35.87 Figure 11: LSTM prediction (forecasted) of gold
 MAE 20.59 29.31 price(Rs/gram).
.
 The experimental results revealed that the LSTM model
 4500
is the best among the four methods. In terms of forecasting 4450
performance measures, MAPE is 0.69, MAE is 29.31 and 4400
RMSE is 35.87, which is the lowest among the four 4350
 4300
forecasting models. Therefore, the LSTM model is superior 4250
to the other three comparative models in terms of 4200
forecasting gold prices in India. 4150
 4100

 25-11-2020
 27-11-2020
 29-11-2020
 01-12-2020
 03-12-2020
 05-12-2020
 07-12-2020
 09-12-2020
 11-12-2020
 13-12-2020
 15-12-2020
 17-12-2020
 19-12-2020
 21-12-2020
 23-12-2020
 25-12-2020
 27-12-2020
 29-12-2020
 31-12-2020
 4500
 4400
 4300 Price CNN Pred_Price
 4200
 Figure. 12: CNN prediction (forecasted) of gold
 4100 price(Rs/gram).
 25-11-2020
 27-11-2020
 29-11-2020
 01-12-2020
 03-12-2020
 05-12-2020
 07-12-2020
 09-12-2020
 11-12-2020
 13-12-2020
 15-12-2020
 17-12-2020
 19-12-2020
 21-12-2020
 23-12-2020
 25-12-2020
 27-12-2020
 29-12-2020
 31-12-2020

 VI. CONCLUSIONS
 The main object of the paper is to compare the
 Price ARIMA Pred_Price traditional time series models with deep learning algorithm.
 The historical data is collected from World Gold Council of
 Figure. 9: ARIMA prediction (forecasted) of gold gold prices in Rupees per gram, daily frequency ranging
 price(Rs/gram).
 from January 2016 to December 2020. LSTM model
 outforms than other three modelsto forecast the gold price in
 4500 India using historical data. This study is based on secondary
 4400 data collected from. The analysis showed that the LSTM
 4300 model has the lowestMAPE, RMSE and MAE and
 4200 performed better compared with the traditional time series
 model like ARIMA, MLP and CNN.However, the model
 4100
 can be improved further by incorporate other factors such as
 25-11-2020
 27-11-2020
 29-11-2020
 01-12-2020
 03-12-2020
 05-12-2020
 07-12-2020
 09-12-2020
 11-12-2020
 13-12-2020
 15-12-2020
 17-12-2020
 19-12-2020
 21-12-2020
 23-12-2020
 25-12-2020
 27-12-2020
 29-12-2020
 31-12-2020

 US dollar, Crude oil, Inflation and Bank rates into the
 forecastmodel. Our future research work ismainly to
 incorporate some explanatory variables which are influences
 Price MLP Pred_Price the gold prices to ensure the accuracy of gold
 forecast.Forecasts for test data using LSTM model presented
 Figure. 10: MLP prediction (forecasted) of gold in the following table (6).
 price(Rs/gram).

 Published By:
 Retrieval Number: 100.1/ijeat.D25370410421 Blue Eyes Intelligence Engineering
 DOI:10.35940/ijeat.D2537.0610521 and Sciences Publication
 Journal Website: www.ijeat.org 26 © Copyright: All rights reserved.
International Journal of Engineering and Advanced Technology (IJEAT)
 ISSN: 2249-8958 (Online), Volume-10 Issue-5, June 2021

Table 6. Gold price forecasts using LSTM model for the systematicliterature review: 2005–2019‖, Applied Soft Computing
 Journal
 test dataset 17. Farah Naz, Zahid Ahmad (2016), ―Forecasting of Indian Gold Prices
 Date Price Pred_Price Date Price Pred_Price using Box Jenkins Methodology‖, Journal of Indian Studies, 2, 75 –
 25-11-20 4286.8 4328.7 15-12-20 4383.6 4339.7 83
 18. G. Zhang, B. Eddy Patuwo, and M. Y. Hu, ―Forecasting with artificial
 26-11-20 16-12-20
 4298.6 4295.0 4414.2 4374.3 neural networks: the state of the art,‖ International Journal of
 27-11-20 4249.6 4299.6 17-12-20 4458.8 4410.9 Forecasting, vol. 14, no. 1, pp. 35–62, 1998.
 30-11-20 18-12-20 19. K. Anitha Kumari, Naveen Kumar Boiroju, P. Rajashekara Reddy
 4230.0 4264.7 4450.0 4452.2 (2014), ―Forecasting of Monthly Mean of Maximum Surface Air
 01-12-20 4289.8 4238.2 21-12-20 4465.3 4455.9 Temperature in India‖, International Journal of Statistika and
 02-12-20 22-12-20 Mathematika, 9, 14-19.
 4342.1 4279.5 4416.7 4465.5 20. Khan, M. M. A (2013), ―Forecasting of gold prices (Box Jenkins
 03-12-20 4372.4 4333.6 23-12-20 4446.3 4431.8 approach). International Journal of Emerging Technology and
 04-12-20 24-12-20 Advanced Engineering‖, 3(3), 662-670.
 4362.2 4369.1 4437.4 4443.2 21. Krishna Reddy. M., Naveen Kumar .B (2008), ―Forecasting Foreign
 07-12-20 4421.0 4368.3 25-12-20 4411.9 4443.3 Exchange Rates Using Time Delay Neural Networks‖, Proceedingsof
 08-12-20 28-12-20 IV International Conference on Data Mining 2008, Las Vegas,
 4434.9 4411.0 4428.8 4421.6 Nevada, USA, 267-273.
 09-12-20 4360.8 4435.4 29-12-20 4431.8 4428.6 22. Ranson, D., Wainright, H.C. (2005), Why Gold, not Oil, is the
 10-12-20 30-12-20 Superior Predictor of Inflation. Gold Report, World Gold Council,
 4352.9 4381.8 4456.3 4434.9 November.
 11-12-20 4362.6 4358.5 31-12-20 4460.0 4454.4 23. S. Hochreiter and J. Schmidhuber, ―Long short-term memory,‖
 14-12-20 NeuralComputation, vol. 9, no. 8, pp. 1735–1780, 1997. [Online].
 4327.8 4364.1
 Available:https://doi.org/10.1162/neco.1997.9.8.1735
 24. Shichang Shen, Shan Chen (2017) ―Application of SARIMA Model on
REFERENCES Money Supply‖, Open Journal of Statistics, 7, 112-121
 25. Stanley Jere, Bornwell Kasense, Obvious Chilyabanyama (2017),
1. Graves, A. Mohamed, and G. Hinton, ―Speech recognition with ―Forecasting Foreign Direct Investment to Zambia: A Time Series
 deeprecurrent neural networks,‖ in 2013 IEEE International Analysis‖, Open Journal of Statistics, 2017, 7, 122-131.
 Conference on Acoustics, Speech and Signal Processing, May 2013, 26. Taylor, N.J. (1998), Precious metals and inflation. Applied Financial
 pp. 6645–6649. Economics, 8(2), 201-210.
2. Abhay Kumar Agarwal (2020), Swati Kumari, Gold price prediction 27. W. Wang, P. H. Van Gelder, J. Vrijling, and J. Ma, ―Forecasting daily
 using Machine Learning, International Journal of Trend in Scientific streamflow using hybrid ann models,‖ Journal of Hydrology, vol. 324,
 Research and Development. no. 1, pp. 383–399, 2006.
3. Anderson, J. A., (1995), ―Introduction to Neural Networks‖,
 Cambridge, MA: MIT Press.
4. Amalendu Bhunia1 and Somnath Mukhuti (2013), ―The impact of AUTHORS PROFILE
 domestic gold price on stock price indices-An empirical study of P Sai Shankar, is a data science enthusiast with a
 Indian stock exchanges‖, Universal Journal of Marketing and
 strong inclination towards problem-solving and
 Business Research (ISSN: 2315-5000) Vol. 2(2) pp. 035-043, May, propelling data-driven decisions. He is currently
 2013. pursuing his Ph.D in Statistics under Dr. M Krishna
5. Baur, D. G., & McDermott, T. K. (2010). Is gold a safe haven?
 Reddy from University college of Science (Osmani a
 International evidence. Journal of Banking and Finance, 34, 1886– University). He has worked on multiple projects in
 1898. the field of machine learning.He is a keen learner of
6. Baur, D. G., & Lucey, B. M. (2010). Is gold a hedge or a safe haven?
 new Technologies. His field of research is Time
 An analysis of stocks,bonds and gold. The Financial Review, 45, 217– series, Machine learning and Deep learning, E-
 229. mail:saishankar26@gmail.com
7. Batten, J.A., Ciner, C. and Lucey, B.M. (2010), The macroeconomic
 determinants of volatility in precious metals markets. Resources Prof. M. Krishna Reddy, has more than 42 years of
 Policy. 35, pp.65–71 teaching and research experience. He served as
8. Box, G. E. P., Jenkins, G. M. And Reinsel, G. C (1994), ―Time Series Professor, Head and Chairperson, Board of Studies at
 Analysis Forecasting and Control‖, 3rd ed.,Englewood Cliffs, N. J. Department of Statistics, Osmania University,
 Prentice Hall. Hyderabad, Telangana. Presently, he is Professor of
9. Brown, R. G (1959), Statistical forecasting for inventory control. New statistics at CVR college of Engineering, Hyderabad.
 York: McGraw Hill. He guided 15 Ph.D.s in Statistics and more than 40
10. G. Mohan Naidu*, B. Ravindra Reddy and B. Ramana Murthy publications in national and international journals.E-
 (2018), TIME SERIES FORECASTING USING ARIMA AND mail:reddymk54@gmail.com
 NEURAL NETWORK APPROACHES, Int. J. Agricult. Stat. Sci.
 Vol. 14, No. 1, pp. 275-278, 2018
11. Hammoudeh, S., Yuan, Y., McAleer, M., Thompson, M. (2010),
 Precious metals-exchange rate volatility transmission and hedging
 strategies. International Review of Economics and Finance, 19(4),
 698-710.
12. Hassan A. N. Hejase and Ali H. Assi (2012), ―Time-Series Regression
 Model for Prediction of Mean Daily Global Solar Radiation in Al-
 Ain, UAE‖, International Scholarly Research Network.
13. Iftikhar ul Sami, Khurum Nazir Junejo (2017),‖ Predicting Future
 Gold Rates using Machine Learning Approach‖, International Journal
 of Advanced Computer Science and Applications
14. Jyothi Manoj* and Suresh K K (2019), Forecast Model for Price of
 Gold: Multiple Linear Regression with Principal Component
 Analysis, Thailand Statistician
15. Matheus Henrique Dal Molin Ribeiro, Leandro dos Santos Coelho
 (2020), ―Ensemble approach based on bagging, boosting and stacking
 for short-term prediction in agribusiness time series‖, Applied Soft
 Computing Journal
16. Omer Berat Sezer, Mehmet Ugur Gudelek, Ahmet Murat Ozbayoglu
 (2020), ―Financial time series forecasting with deep learning : A

 Published By:
 Retrieval Number: 100.1/ijeat.D25370410421
 Blue Eyes Intelligence Engineering
 DOI:10.35940/ijeat.D2537.0610521
 and Sciences Publication
 Journal Website: www.ijeat.org 27 © Copyright: All rights reserved.
You can also read