Modeling and forecasting the early evolution of the Covid-19 pandemic in Brazil
←
→
Page content transcription
If your browser does not render page correctly, please read the page content below
Modeling and forecasting the early evolution of the Covid-19
                                                                  pandemic in Brazil
                                                                                       1
                                                                   Saulo B. Bastos         and Daniel O. Cajueiro1,2,3
                                                1
                                                  Departamento de Economia, FACE, Universidade de Brası́lia (UnB), Campus
                                                            Universitário Darcy Ribeiro, 70910-900, Brası́lia, Brazil.
                                               2
                                                 Nacional Institute of Science and Technology for Complex Systems (INCT-SC).
                                               3
                                                 LAMFO, FACE - Universidade de Brası́lia (UnB), Campus Universitário Darcy
                                                                       Ribeiro, 70910-900, Brası́lia, Brazil.
arXiv:2003.14288v2 [q-bio.PE] 9 Apr 2020

                                                                                      April 10, 2020

                                                                                           Abstract
                                                    We model and forecast the early evolution of the COVID-19 pandemic in Brazil us-
                                                ing Brazilian recent data from February 25, 2020 to March 30, 2020. This early period
                                                accounts for unawareness of the epidemiological characteristics of the disease in a new ter-
                                                ritory, sub-notification of the real numbers of infected people and the timely introduction
                                                of social distancing policies to flatten the spread of the disease. We use two variations of
                                                the SIR model and we include a parameter that comprises the effects of social distancing
                                                measures. Short and Long terms forecasts show that the social distancing policy imposed
                                                by the government is able to flatten the pattern of infection of the COVID-19. However,
                                                our results also show that if this policy does not last enough time, it is only able to shift
                                                the peak of infection into the future keeping the value of the peak in almost the same value.
                                                Furthermore, our long term simulations forecast the optimal date to end the policy. Finally,
                                                we show that the proportion of asymptomatic individuals affects the amplitude of the peak
                                                of symptomatic infected, suggesting that it is important to test the population.

                                           Introduction
                                           The world has seen an ongoing pandemic of COVID-19 (coronavirus 2) caused by severe acute
                                           respiratory syndrome SARS-CoV-2. According to the World Health Organization (WHO)
                                           (World Heath Organization, 2020a), although most people infected with it will present mild
                                           respiratory symptoms, or no signs of the disease, and recover without needing special treatment,
                                           older people, and those with severe medical conditions like diabetes, cardiovascular disease, or
                                           chronic respiratory disease may develop serious illness. While the COVID-19 outbreak was first
                                           identified in Wuhan, Hubei, China, in December 2019, we could only confirm the first case in
                                           Brazil on February 25, 2020. The first known patient in Brasil was a 61-year-old man from São
                                           Paulo who had returned from Lombardy (Italy) and tested positive for the virus. Since then,
                                           we may confirm 4579 cases and 159 deaths (March 30, 2020) in roughly the entire Brazilian
                                           territory. Like in the rest of the world (Adam, 2020), the Brazilian government response to the
                                           pandemic has been the introduction of measures to ensure social distancing, such as schools
                                           closure, restricting commerce, banning public events and home office.
                                               We use the Brazilian recent data from February 25, 2020 to March 30, 2020 to model and
                                           forecast the evolution of the COVID-19 pandemic. Our study focuses on the early period
                                           of the pandemics that accounts for unawareness of the epidemiological characteristics of the
                                           disease in a new territory, sub-notification of the real numbers of infected people and the timely
                                                                                              1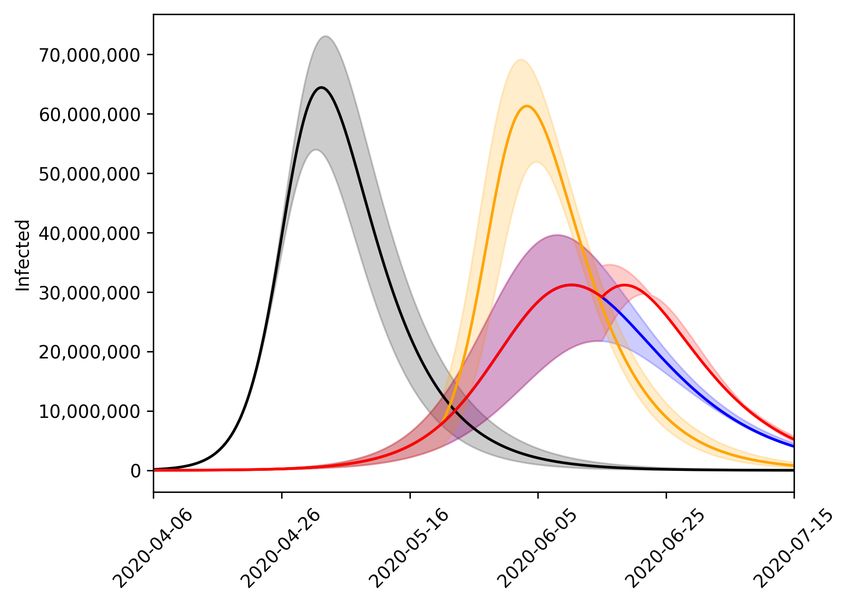
introduction of social distancing policies to flatten the spread of the disease. This work has had
the practical appeal for providing preliminary estimates of Covid-19 epidemiological parameters
and the duration of the social distancing policy in Brazil.
    The computational modeling of infectious diseases comprises a large collection of models
(Grassly and Fraser, 2008; Keeling and Rohani, 2011; Brauer et al., 2019). In order to model
the evolution of the Covid-19 in Brazil we modify two versions of the the Susceptible-Infected-
Recovered (SIR) model (Kermack and McKendrick, 1927) to consider the effects of social dis-
tancing measures in the evolution of the disease. The SIR model describes the spread of a
disease in a population split into three non-intersecting classes: Susceptible (S) are individuals
who are healthy but can contract the disease; Infected (I) are individuals who are sick; Recov-
ered (I) are individuals who recovered from the disease. Due to the evolution of the disease,
the size of each of these classes change over time and the total population size N is the sum of
these classes

                                   N (t) = S(t) + I(t) + R(t).                                (1)
    Let β be the average number of contacts that are sufficient for transmission of a person per
unit of time t. Then βI/N is the average number of contacts that are sufficient for transmission
with infective individuals per unit of time of one susceptible and (βI/N )S is the number of new
cases per unit of time due to the S susceptible individuals. Furthermore, let γ be the recovery
rate, which is the rate that infected individuals recover or die, leaving the infected class, at
constant per capita probability per unit of time.
    Based on these definitions, we can write the SIR model as

                                 dS          βIS
                                      = −
                                  dt          N         [SIR].                             (2)
                                  dI       βIS
                                      =         − γI
                                  dt        N
    The number of recovered individuals can be evaluated from Eq. (1), since in this version
of the SIR model [Eq. (2)] the population is constant. This is equivalent to add the equation
dR
 dt = γI to the system above. Actually, since we are modeling a short term pandemic, we do
not consider the demographic effects and we assume that an individual does not contract the
disease twice. We do not implement this model, we only included it for the sake of reference.
    We actually want to estimate the fraction of people that die from the disease. Then we
include a probability ρ of an individual in the class I dying from infection before recovering
(Keeling and Rohani, 2011). In this case, we get the following set of equations

                       dS
                             = − βIS N
                        dt
                        dI
                             = βIS              ρ      βIS
                                  N − γI − 1−ρ γI = N − 1−ρ
                                                              γI    [SID],                    (3)
                        dt
                       dD          ρ
                             = 1−ρ    γI
                        dt
        ρ
where 1−ρ  γI is the number of people in the population that die due to the disease per unity
of time and D is the number of people that die due to the disease. Note that in this case the
                                                                                           ρ
number of individuals in the population reduces due to the infection according to dN
                                                                                   dt = − 1−ρ γI.
Since the number of recovered individuals play no role in this model, we remove them from the
system. For the ease of reference, we call this model “SID” (Susceptible-Infected-Dead) model.
    Since, in the case of the COVID-19, there is a relevant percentage of the infected indi-
viduals that are asymptomatic, we split the class of infected individuals in symptomatic and
asymptomatic (Robinson and Stilianakis, 2013; Arino et al., 2008; Longini-Jr. et al., 2004):

                                                2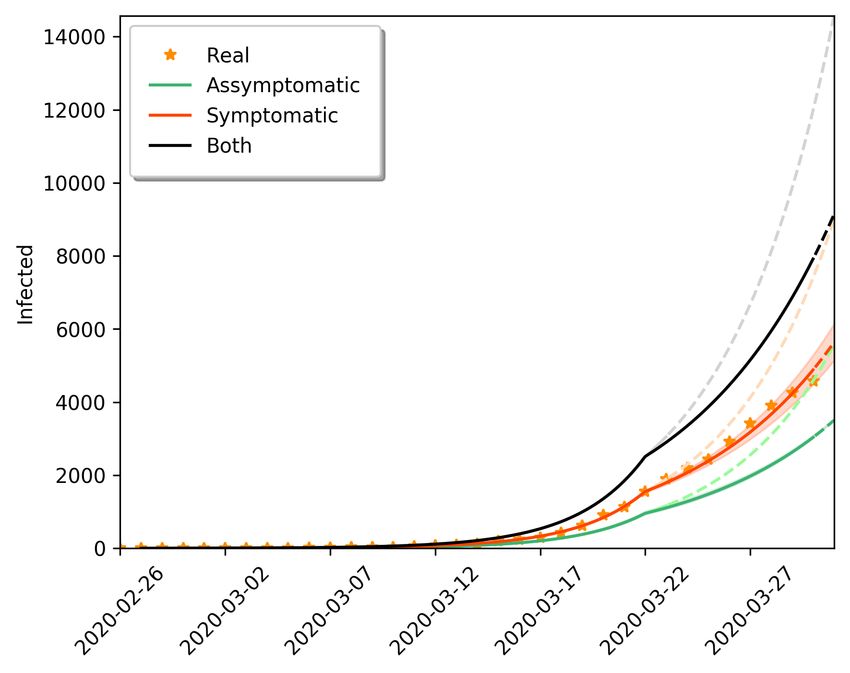
dS                         S
        = −(βA IA + βS IS )
   dt                         N
  dIA                          S
        = (1 − p)(βA IA + βS IS ) − (γA )IA
   dt                         N
  dIS                      S             ρ                           S  γS IS           [SIASD],
        = p(βA IA + βS IS ) − γS IS −       γS IS = p(βA IA + βS IS ) −
   dt                      N          1−ρ                            N  1−ρ
  dD        ρ
        =       γS IS
   dt     1−ρ
                                                                                                 (4)
where IA is the number of asymptomatic individuals, IS is the number of symptomatic indi-
viduals and p is the proportion of individuals who develop symptoms. For ease of reference,
we call this model “SIASD” (Susceptible-Infected-Asymptomatic-Symptomatic-Dead) model.
Like the SID model, the condition that N is constant does not hold anymore and if we need to
                                                        ρ
evaluate N over time, we need to integrate dN dt = − 1−ρ γS IS .
    In order to consider the effect of the social distancing policy, we modify the transmission
factors of Eqs. (3) and (4) by multiplying them by a parameter ψ ∈ [0, 1], when the date belongs
to the period of the implementation of government policy. Otherwise, we use ψ = 1. To be
precise, we replace β in Eq. (3) by ψβ, βA in Eq. (4) by ψβA and βS in Eq. (4) by ψβS . Note
that doing this procedure we avoid the introduction and estimations of new “βs” and we may
use ψ to evaluate the effectiveness of social distancing policy. In the end, we may measure the
social distance as 1 − ψ.
    Our models provide estimates of the epidemiological parameters, that are consistent with
the international literature, and good forecasts of the short-term Brazilian time series of infected
individuals in Brazil. Furthermore, one of our models assesses the number of asymptomatic (or
individuals with mild symptoms that do not look for the hospitals and are not being tested).
We use these models to simulate long-term scenarios of the pandemics that depend on the level
of engagement of the Brazilian social distancing policy. We show that: (1) The social distancing
policy imposed by the government is able to flatten the pattern of contamination provided by
the COVID-19; (2) There is an optimal date for abandoning the social distancing policy; (3)
Short-term social distancing policies only shift the peak of infection into the future keeping the
value of the peak in almost the same value. (4) The proportion of asymptomatic individuals
affects the amplitude of the peak of symptomatic infected, meaning that it is important to
invest in testing the population, massively or by random sampling.
    Our work relates to the recent interesting contributions (Kucharski et al., 2020; Berger et al.,
2020; Read et al., 2020; Walker et al., 2020) in the sense that all these works try to model the
spread of the COVID-19 and to evaluate the countermeasures against this virus. However,
our paper differs from these works in the following dimensions: (1) Data: Our work focuses in
Brazilian data. This is an important characteristic since different countries may present different
demographies and we know that the COVID-19 is riskier for older populations that appear with
higher proportion in developed countries. Furthermore, the level of nutrition of the population
of the country may affect the probability of contracting and developing the disease. The quality
of data may vary from developed countries to underdeveloped ones and, in our paper, we do
not use data from other countries to calibrate our models. (2) Model: We use variations of
the SIR model mentioned above. One of the advantages of the SIR model is the simplicity and
researchers have used this model in several successful attempts to model the spread of infectious
diseases (Shaman et al., 2013; Berge et al., 2017; Osthus et al., 2017; Khaleque and Sen, 2017).
(3) Estimation: Our paper estimates all the parameters based on a clear hierarchical procedure
based on squared error minimization.

                                                 3
Figure 1: Estimations of the SID model for different final date points. The solid line corresponds
to the last date which the model was estimated, and the dashed line are model predictions. We
represent the real data as points.
Results
Data analysis
We use the real data provided by the Ministry of Health of Brazil from February 25, 2020 to
March 30, 2020 to estimate the epidemiological parameters of Eqs. (3) and (4). We estimate
all parameters of our model by minimizing the squared error of integrated variables and their
real values (Bard, 1974; Brauer et al., 2019). We proceed in a hierarchical procedure. First, we
estimate the parameters of the SID model, namely β, γ and ρ by minimizing the squared error
P
1 ˆ 2 2
minβ,γ,ρ 2 t (It − It ) + (Dt − D̂t ) , (5)
where It and Dt are the real data provided by the Ministry of Health of Brazil and Iˆt and D̂t are
their estimated values. Second, we estimate the SIASD model. Note that we lack information
on the number of asymptomatic individuals, since the clear recommendation of the Ministry of
Health is to test for the virus only if one has strong symptoms. Otherwise, follow the “stay
at home” policy. Furthermore, the mortality rate is evaluated mostly over the symptomatic
ones, since the asymptomatic are in many cases not tested. Therefore, we suppose that βS = β,
γS = γ and we keep the value of ρ. Using these parameters, we estimate the parameters βA , γA
and p in order to minimize the squared error
P
1 ˆ 2 2
minβA ,γA ,p 2 t (It − IS,t ) + (Dt − D̂t ) , (6)
where It and Dt are the real data provided by the Ministry of Health of Brazil and IˆS,t and D̂t are
their estimated values. Table 1 presents the epidemiological parameters of our model and some
reference values. Some of the lines of this table deserve remarks. First, the basic reproductive
number R0 in both models are comparable to the values for China and Italy. Second, the death
rate ρ is very close to the values disclosed by the Brazilian Ministry of Health and the average of
international values. We point out that our estimation of the death rate uses data that presumes
there are places in hospitals to treat patients with severe infections, that is the situation that
is present in the data now. Depending on the government policy, we do not know whether this
is true or not at the peak of infection. Third, the proportion of symptomatic individuals p is
smaller the international reference due to the Brazilian Ministry of Health policy “only test if
you have strong symptoms”. In fact, the same problem of underdiagnosis also seems to have
happened in the early epidemics in China (Nishiura et al., 2020b).
4Model Parameter Value Other sources
0.455
SID β —
(0.429-0.492)
0.145
SID γ 1/10 to 1/2 (World Heath Organization, 2020c)
(0.119-0.182)
0.049 released by WHO (World Heath Organization,
2020b) in 2020-04-01, 0.028 in 2020-03-27 released by
Brazilian Ministry of Health (Brazilian Ministry of
0.029
SID ρ Health, 2020a), 0.032 in 2020-03-29 released by
(0.023-0.035)
Brazilian Ministry of Health (Brazilian Ministry of
Health, 2020b) and 0.014 (0.009-0.021) in Wuhan
(Wu et al., 2020a),
3.8 (3.6-4.0) (Read et al., 2020) and 2.68 (2.47-2.86)
(Wu et al., 2020b) in early stages of the disease in
3.049
SID R0 China. 2.76 to 3.25 in Italy (Remuzzi and Remuzzi,
(2.641-3.491)
2020). 2.28 (2.06-2.52) (Zhang et al., 2020) for the
passengers of the Diamond Princess cruise.
0.455
SIASD βS —
(0.429-0.492)
0.145
SIASD γS —
(0.119-0.182)
1.901
SIASD RS —
(1.644-2.188)
0.458
SIASD βA —
(0.458-0.458)
0.144
SIASD γA —
(0.144-0.144)
1.202
SIASD RA —
(1.202-1.202)
3.103
SIASD R0 The same as above.
(2.846-3.390)
0.029
SIASD ρ The same as above.
(0.023-0.035)
0.821 (0.798-0.845) for the passengers of the
0.624 Diamond Princess Cruise (Mizumoto et al., 2020).
SIASD p
(0.624-0.624) 0.692 (0.462-0.923) for the Japanese citizens
evacuated from Wuhan (Nishiura et al., 2020a).
Notes:
(1) In the SID model, R0 = β(1−ρ)/γ. In the SIASD model, RA = βA (1−ρ)/γA and RS = βS (1−ρ)/γS and R0 = RA +RS .
(2) Some parameters have not presented relevant variation in the significance level of this study. In these cases, the 95%
interval includes only the value of the parameter.
Table 1: Estimated values of the epidemiological parameters.
5SID SIASD
Date ψ R0 ψ R0
03-23-2020 0.760 2.317 0.752 2.333
03-24-2020 0.716 2.183 0.712 2.209
03-25-2020 0.671 2.046 0.669 2.076
03-26-2020 0.670 2.043 0.669 2.076
03-27-2020 0.670 2.043 0.669 2.076
03-28-2020 0.673 2.052 0.664 2.060
03-29-2020 0.660 2.012 0.652 2.023
03-30-2020 0.646 1.969 0.638 1.980
Table 2: Estimated values of ψ for the SID and SIASD models and the impact on the basic
reproductive number R0 .
By changing the final date of the period of estimation of the epidemiological parameters of
the model, we note that there is a structural change in the data suggesting the effectiveness of
the social distancing policy. It is worth mentioning that it is hard to know exactly when social
distance measures took effect, mostly because there is a variable incubation period of the virus
(World Heath Organization, 2020c) (indicate a range from 2 to 10 days) and some initiatives of
social distance measures (such as home office) started even before the official implementation
of the social distancing policy. In fact, after March 22, 2020, we are able to see in the data two
consecutive reductions in the taxes of transmission, depending on the final date that is used for
the estimation of the SID model as shown in Figure 1. So, we define March 23, 2020, as the
initial date that we use to estimate the parameter ψ. In order to estimate the parameter ψ,
we keep all model parameters as previously estimated and we also minimize the mean squared
error using loss functions similar to the ones defined in Eqs. (5) and (6) depending on the case.
Furthermore, in order to evaluate the effectiveness of the social distancing policy, we estimate
a new value of ψ for each new point of the time series as shown in Table 2, where the column
2 shows the estimations of ψ for the SID model and column 4 shows estimations of the same
parameter for the SIASD model. Although there is a small gap between the values of ψ for
different models (SID or SIASD), both columns suggest that the social distance factor ψ is
going down, meaning that more people are joining the government policy. According to the
models, the transmission rate is reduced to approximately 64% of its original value. Table 2
also presents the impact of ψ on the basic reproductive number.
Forecasts
Figures 2 and 3 present respectively the short-term forcasts of the SID and the SIASD models,
where the models incorporate the ψ factor in order to rescale the transmission factors (β, βA
and βS ) in the scenario with the social distancing policy imposed by the government. Note
that Figure 3 explicitly shows the proportion of unknown asymptomatic individuals that when
added to the symptomatic individuals skew the total value of infected individuals upwards.
We also use the SID and SIASD models to provide long term forecasts of the evolution of
the COVID-19 pandemic in Brazil depending on the social distancing policy considered. While
Figure 4 shows the forecasts for the SID model, Figure 5 shows the forecasts for the SIASD
model. In particular, we may note that while the SIASD model predicts that the number of
infected is higher than the estimates of the SID model, it also predicts a lower peak for the
infected with symptoms, which are the ones that could require medical attention.
We explore four cenarios: (I) no measures of social distancing policy (black line); (II) current
social distancing policy imposed by the government for an indefinite time (blue line); (III) 2-
month social distancing policy imposed by the government (yellow line); and (IV) optimum
limited time social distancing policy imposed by the government, so that the second infection
6Figure 2: Short term forecast of the SID model taking into account government social distance
measures. The solid line corresponds to the last date which the model was estimated, and the
dashed line are model predictions. We show the evolution of the infected with 95% confidence
interval. We represent the real data as points.
Figure 3: Short term forecast of the SIASD model taking into account government social distance
measures. The solid line corresponds to the last date which the model was estimated, and the
dashed line are model predictions. We show the evolution of the infected (assymptomatic,
symptomatic and both) with 95% confidence interval. We represent the real data as points.
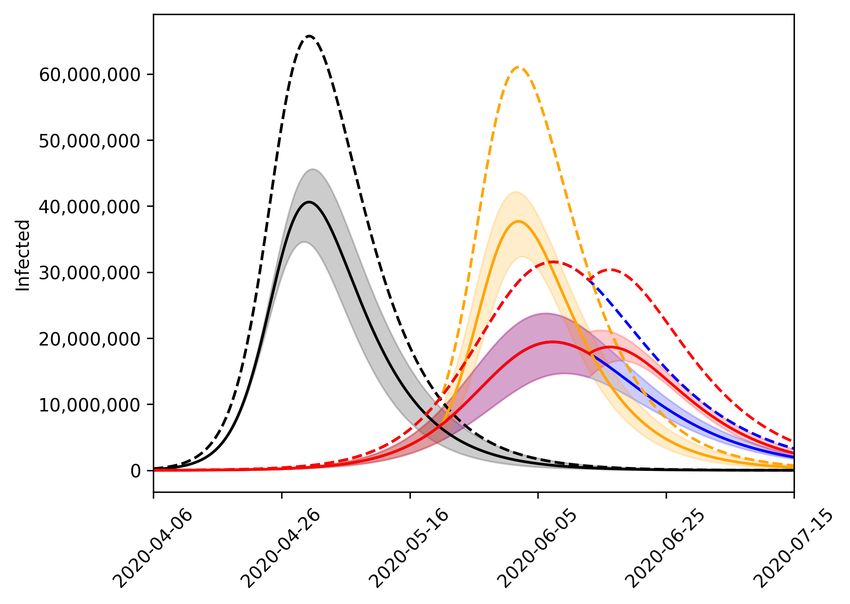
7Figure 4: Long term forecasts of number of infected for different scenarios using the SID model.
Black, blue, yellow and red lines represent scenarios I to IV, respectively.
Figure 5: Long term forecasts of number of infected for different scenarios using the SIASD
model. Black, blue, yellow and red lines represent scenarios I to IV, respectively. While solid
lines represent the symptomatic infected individuals, dashed lines represent total infected indi-
viduals.
8SID SIASD
Infected (I) Infected (IA + IS ) Symptomatic (IS )
Scenario Peak (%) Date Peak (%) Date Peak (%) Date
I (Black) 30.7 May 2 31.3 April 30 19.3 April 30
II (Blue) 14.9 June 10 15.0 June 7 9.3 June 7
III
29.2 June 3 29.0 June 2 17.9 June 2
(Orange)
IV (Red) 14.8 June 10 15.0 June 7 9.2 June 7
Table 3: Peaks in each scenario and the dates of occurrence.
Figure 6: Proportions of asymptomatic and symptomatic over time using IA,0 = 0.5. Approxi-
mately 38% are asymptomatic in March 30, 2020.
peak is not greater than cenario II (red line). Scenario III suggests that policies based on short-
term social distancing policy are not enough to constrain the evolution of the pandemic, that
is, if social distancing policy measurements are released before the optimal time, a second peak
should be experienced. The peaks and dates in which they occur are detailed in Table 3. In the
case of Scenario IV, the last day of the social distancing policy is June 15, 2020.
In addition to Figure 5, we also present the evolution of the proportion of asymptomatic
and symptomatic in Figure 6. Note that the proportion of individuals who develop symptoms,
p in Eq. (4), alters the transmission rate, so it also affects the evolution of the number of
asymptomatic and symptomatic individuals over time. So this plot estimates the evolution
of this proportion. The last column of the last line of Table 1 shows that the proportion
of asymptomatic may vary from 10% to 30%, but this value is not fixed and evolves over
time (Mizumoto et al., 2020). Our estimates suggest that the proportion of asymptomatic
is approximately 38% in March 30, 2020, that may account for some individuals with mild
symptoms that were not tested.
Finally, it is worth considering that the SIASD differential equations, presented in Eq. (4),
need an initial condition for the number of asymptomatic individuals. If we find the parameters
values (βA , γA , p) by solving the optimization problem of Eq. (6) using different conditions,
we get different results, that is, different peak values for the symptomatic individuals. If the
proportion of asymptomatic individuals is larger, then this may be good news since it may
represent less pressure for the health care system. But since we do not have enough tests to
map the whole population, we need to work with hypotheses. Figure 7 shows the effect of
different initial conditions in the ratio between asymptomatic and symptomatic and the peak
value of symptomatic, that is, we impose the ratio between asymptomatic and symptomatic
on March 30, then calculate the peak value of symptomatic infected. So if we assume that
9Figure 7: The effect of the ratio between asymptomatic and symptomatic in March 30, 2020 in
the proportion of symptomatic in the peak.
the number of asymptomatic (symptomatic) individuals in data is larger (smaller) today, the
number of asymptomatic (symptomatic) individuals will also be larger (smaller) in the time of
the peak, leading to a smaller peak for the symptomatic.
Discussion
We use the Brazilian recent data from February 25, 2020 to March 30, 2020 to model and
forecast the evolution of the COVID-19 pandemic in Brazil.
We estimate two variations of the SIR model using historical data and we find parameters
that are in accordance with the international literature. We also introduce a factor ψ to ac-
count for the effect of the government social distancing measures. Our methodology is able to
estimate the asymptomatic individuals, that may not be entirely present in data. Since the
Brazilian government does not have enough tests for mass testing, this measure may provide
some additional information. In fact, we show the relevance of the number of asymptomatic
individuals, since the larger the number of asymptomatic individuals, the smaller the number
hospital beds needed.
While our short-term forecasts are in great accordance with the data, our long-term forecasts
may help us to discuss different types of social distancing policies. We also show that the social
distancing policy imposed by the government is able to flatten the pattern of contamination
provided by the COVID-19, but short-term policies is only able to shift the peak of infection
into the future keeping the value of the peak in almost the same value. Furthermore, we define
the idea of the optimal social distancing policy as the finite social distancing policy that the
second peak that happens after stopping the policy is not larger than the first. Based on this
definition, we provide an estimate of the optimal date to end the social distancing policy.
An important discussion is about the effectiveness of vertical containment policies, where
only people at risk follow social distance policies. In these kinds of policies, the two fractions of
the population, the one at risk and the other one, present very different behaviors. First, the
dynamics of the population at risk behaves similarly to the case with social distancing measures,
but with a higher death rate. Second, the dynamics of the population that is not at risk behaves
similarly to the case without social distance measures but with a low death rate. Third, since
the fraction of the population that is at risk is much smaller than the rest of the population,
the number of infected of the total population behaves similarly to the case without control.
In fact, the policy’s effectiveness is not in reducing the number of infected, but in reducing the
number of deaths by confining individuals at risk. It is worth mentioning that the effectiveness
10Interval of
Model Parameter initial
conditions
SID ρ [0,0.1]
SID β [1/20,1/0.25]
SID γ [1/14,1/2]
SIASD βS {β}
SIASD γS {γ}
SIASD βA [0,βS ]
SIASD γA [1/14,1/2]
Both Models ψ [0,1]
Table 4: Parameters estimation region.
of these vertical containment polices depends strongly on the ability to separate the individuals
at high risk from the individuals at low risk and on the number of vacancies in hospitals to
treat the disease. We may extend our model to explore these type of scenarios and we leave for
future work.
Finally, another interesting research path is to evaluate the economic side effects of pandemic
control (Eichenbaum et al., 2020; Gormsen and Koijen, 2020) and to propose measures to
minimize these impacts (Hone et al., 2019).
Methods
The solution of the systems of differential equations
We find the numerical solutions of Eqs. (3) and (4) through integration using the explicit
Runge-Kutta method of order 5(4) (Dormand and Prince, 1980). While this method controls
the error assuming accuracy of the fourth-order, it uses a fifth-order accurate formula to take
the steps. We use the implementation “solve ivp” of the scipy Python’s library (Virtanen et al.,
2020).
The solution of the systems of differential equations depends on the definition of initial
conditions. We use N0 = 210147125, that is the Brazilian population according to Brazilian
Institute of Geography and Statistics (IBGE) which is the agency responsible for official collec-
tion of statistical, geographic, cartographic, geodetic and environmental information in Brazil,
for both models. For the case of the SID model, we use S0 = N0 − 1 and I0 = 1. For the case,
SIASD model, we use IS0 = 1 and S0 = N0 − IA0 − IS0 . We use IA0 = 0.5 in all simulations of
the paper, but the simulations presented in Figure 7, since we want to learn about the effect of
IA0 in the proportion of symptomatic and asymptomatic individuals in the peak date.
The estimation procedure
Our estimation procedure requires simultaneous integration of the differential equations (SID
or SIASD model depending on the case) and minimization of the loss functions [(5) or (6)]
depending on the case for each time t. We minimize the loss functions using the method “op-
timize.least squares” also from the scipy Python’s library (Virtanen et al., 2020). To minimize
the impact of the initial point assumption and data incompleteness, we repeat the estimation
procedure 100 times using random initial conditions. Since this is a difficult nonlinear problem
we bound the parameters estimation region. In particular, we use the bounds presented in
Table 4. To be clear, the fact that βS = β and γS = γ is a consequence of our hierarchical
estimation procedure previously described in the “Results” section. Furthermore, βA ∈ [0, βS ]
11means that βA ≤ βS (Robinson and Stilianakis, 2013), since the asymptomatic individuals do
not have symptoms that may help the spread of the infection.
The long term forecasts
The long term forecasts use the estimations presented in Table 1 and the integration of the
systems of differential equations as described in the beginning of this section. We build the
95% confidence intervals of these curves randomizing the values of the parameters in the 95%
confidence intervals presented in Table 1.
Acknowledgment
The second author is indebted to CNPQ for partial financial support under grant 302629/2019-0.
12References
D. Adam. The simulations driving the world’s response to covid-19. how epidemiologists rushed
to model the coronavirus pandemic? Nature, April, 2020.
J. Arino, F. Brauer, P. van-den Driessche, J. Watmough, and J. Wu. How will country-based
mitigation measures influence the course of the covid-19 epidemic? Journal of Theoretical
Biology, 253:118–130, 2008.
Y. Bard. Nonlinear Parameter Estimation. 1974.
T. Berge, J.-S. Lubuma, G. Moremedi, N. Morris, and R. Kondera-Shava. A simple mathemat-
ical model for ebola in africa. Journal of Biological Dynamics, 11(1):42–74, 2017.
D. Berger, K. Herkenhoff, and S. Mongey. An seir infectious disease model with testing and
conditional quarantine. Technical report, Federal Reserve Bank of Minneapolis, 2020.
F. Brauer, C. Castillo-Chavez, and Z. Feng. Mathematical Models in Epidemiology. 2019.
Brazilian Ministry of Health. Coronavirus panel. https://covid.saude.gov.br/, 2020a. Ac-
cessed: 2020-03-27.
Brazilian Ministry of Health. Coronavirus panel. https://covid.saude.gov.br/, 2020b. Ac-
cessed: 2020-03-29.
J. R. Dormand and P. J. Prince. A family of embedded runge-kutta formulae. Journal of
Computational and Applied Mathematics, 6:19–26, 1980.
M. S. Eichenbaum, S. Rebelo, and M. Trabandt. The macroeconomics of epidemics. Working
Paper 26882, National Bureau of Economic Research, March 2020. URL http://www.nber.
org/papers/w26882.
N. J. Gormsen and R. S. J. Koijen. Coronavirus: Impact on stock prices and growth expecta-
tions. Working Paper of the University of Chicago, pages 1–27, 2020.
N. Grassly and C. Fraser. Mathematical models of infectious disease transmission. Nature
Reviews Microbiology, 6:477–487, 2008.
T. Hone, A. J. Mirelman, D. Rasella, R. Paes-Sousa, P. M. L. Barreto, R. Rocha, and C. Millett.
An empirical analysis of the ebola outbreak in west africa. The Lancet, 7:1575–1583, 2019.
M. J. Keeling and P. Rohani. Modeling Infectious Diseases in Humans and Animals. 2011.
W. O. Kermack and A. G. McKendrick. A contribution to the mathematical theory of epidemics.
Proceedings of the Royal Society A, 115:700–721, 1927.
A. Khaleque and P. Sen. An empirical analysis of the ebola outbreak in west africa. Scientific
Reports, 7:42594, 2017.
A. J. Kucharski, T. W. Russell, C. Diamond, Y. Liu, J. Edmunds, S. Funk, and R. M. Eggo.
Early dynamics of transmission and control of covid-19: a mathematical modelling study.
The Lancet Infectious Diseases, March:1–7, 2020.
I. M. Longini-Jr., M. E. Halloran, A. Nizam, and Y. Yang. Containing pandemic influenza with
antiviral agents. American Journal of Epidemiology, 159:623–633, 2004.
K. Mizumoto, K. Kagaya, A. Zarebski, and G. Chowell. Estimating the asymptomatic propor-
tion of coronavirus disease 2019 (covid-19) cases on board the diamond princess cruise ship.
Eurosurveillance, 25:2000180, 2020.
13H. Nishiura, T. Kobayashi, A. Suzuki, S.-M. Jung, K. Hayashi, R. Kinoshita, Y. Yang, B. Yuan,
A. R. Akhmetzhanov, and N. M. Linton. Estimation of the asymptomatic ratio of novel
coronavirus infections. Forthcoming in International Journal of Infectious Diseases, 2020a.
H. Nishiura, T. Kobayashi, Y. Yang, K. Hayashi, T. Miyama, R. Kinoshita, N. M. Linton, S. M.
Jung, B. Yuan, A. Suzuki, and A. R. Akhmetzhanov. The rate of underascertainment of novel
coronavirus (2019-ncov) infection: Estimation using japanese passengers data on evacuation
flights. Journal of Clinical Medicine, 4:419, 2020b.
D. Osthus, K. S. Hickmann, P. C. Caragea, D. Higdon, and S. Y. D. Valle. Forecasting seasonal
influenza with a state-space sir model. Annals of Applied Statistics, 11:202–224, 2017.
J. M. Read, J. R. E. Bridgen, D. A. T. Cummings, A. Ho, and C. P. Jewell. Novel coronavirus
2019-ncov: early estimation of epidemiological parameters and epidemic predictions. medRxiv,
2020. doi: 10.1101/2020.01.23.20018549. URL https://www.medrxiv.org/content/early/
2020/01/28/2020.01.23.20018549.
A. Remuzzi and G. Remuzzi. Covid-19 and italy: what next? The Lancet, March:1–4, 2020.
M. Robinson and N. I. Stilianakis. A model for the emergence of drug resistance in the presence
of asymptomatic infections. Mathematical Biosciences, 243:163–177, 2013.
J. Shaman, A. Karspeck, W. Yang, J. Tamerius, and M. Lipsitch. Real-time influenza forecasts
during the 2012–2013 season. Nature Communications, 4:2837, 2013.
P. Virtanen, R. Gommers, T. E. Oliphant, M. Haberland, T. Reddy, D. Cournapeau,
E. Burovski, P. Peterson, W. Weckesser, J. Bright, S. J. van der Walt, M. Brett, J. Wilson,
K. Jarrod Millman, N. Mayorov, A. R. J. Nelson, E. Jones, R. Kern, E. Larson, C. Carey,
İ. Polat, Y. Feng, E. W. Moore, J. Vand erPlas, D. Laxalde, J. Perktold, R. Cimrman,
I. Henriksen, E. A. Quintero, C. R. Harris, A. M. Archibald, A. H. Ribeiro, F. Pedregosa,
P. van Mulbregt, and S. . . Contributors. SciPy 1.0: Fundamental Algorithms for Scientific
Computing in Python. Nature Methods, 17:261–272, 2020.
P. G. T. Walker, C. Whittaker, O. Watson, M. Baguelin, K. E. C. Ainslie, S. Bhatia, S. Bhatt,
A. Boonyasiri, O. Boyd, L. Cattarino, Z. Cucunuba, G. Cuomo-Dannenburg, A. Dighe, C. A.
Donnelly, I. Dorigatti, S. van Elsland, R. FitzJohn, S. Flaxman, H. Fu, K. Gaythorpe, L. Gei-
delberg, N. Grassly, W. Green, A. Hamlet, K. Hauck, D. Haw, S. Hayes, W. Hinsley, N. Imai,
D. Jorgensen, E. Knock, D. Laydon, S. Mishra, G. Nedjati-Gilani, L. C. Okell, S. Riley,
H. Thompson, J. Unwin, R. Verity, M. Vollmer, C. Walters, H. W. Wang, Y. Wang, P. Win-
skill, X. Xi, N. M. Ferguson, and A. C. Ghani. The global impact of covid-19 and strategies
for mitigation and suppression. Technical report, Imperial College, 2020.
World Heath Organization. Coronavirus overview. https://www.who.int/health-topics/
coronavirus, 2020a.
World Heath Organization. Coronavirus disease 2019 (covid-19)situation report
–72. https://www.who.int/docs/default-source/coronaviruse/situation-reports/
20200401-sitrep-72-covid-19.pdf?sfvrsn=3dd8971b_2, 2020b.
World Heath Organization. Novel coronavirus(2019-ncov). situation report - 7. Technical report,
World Heath Organization, 2020c. URL https://www.who.int/docs/default-source/
coronaviruse/situation-reports/20200127-sitrep-7-2019--ncov.pdf.
J. T. Wu, K. Leung, M. Bushman, N. Kishore, R. Niehus, P. M. de Salazar, B. J. Cowling,
M. Lipsitch, and G. M. Leung. Estimating clinical severity of covid-19 from the transmission
dynamics in wuhan, china. Nature Medicine, 2020a.
14J. T. Wu, K. Leung, and G. M. Leung. Nowcasting and forecasting the potential domestic
and international spread of the 2019-ncov outbreak originating in wuhan, china: a modelling
study. The Lancet, 395:689–697, 2020b.
S. Zhang, M. Diao, W. Yu, L. Pei, Z. Lin, and D. Chen. Estimation of the reproductive number
of novel coronavirus (covid-19) and the probable outbreak size on the diamond princess cruise
ship: A data-driven analysis. International Journal of Infectious Diseases, 93:201–204, 2020.
15You can also read