Multi-category Bangla News Classification using Machine Learning Classifiers and Multi-layer Dense Neural Network
←
→
Page content transcription
If your browser does not render page correctly, please read the page content below

(IJACSA) International Journal of Advanced Computer Science and Applications,
                                                                                                                    Vol. 12, No. 5, 2021

   Multi-category Bangla News Classification using
  Machine Learning Classifiers and Multi-layer Dense
                   Neural Network
                                Sharmin Yeasmin1, Ratnadip Kuri2, A R M Mahamudul Hasan Rana3*
                                     Ashraf Uddin4, A. Q. M. Sala Uddin Pathan5, Hasnat Riaz6
                             Department of Computer Science and Telecommunication Engineering
                                Noakhali Science and Technology University, Bangladesh1, 2, 3, 5, 6
                  Department of Computer Science, American International University-Bangladesh, Bangladesh4

    Abstract—Online and offline newspaper articles have become        newspaper to newspaper. So, these might not be sufficient for
an integral phenomenon to our society. News articles have a           fulfilling users‟ choice of interest. Readers like to explore news
significant impact on our personal and social activities but          from various news sources rather than one source and
picking a piece of an appropriate news article is a challenging       recommending suitable news to the readers based on its
task for users from the ocean of sources. Recommending the            contents can improve the readers‟ experience.
appropriate news category helps find desired articles for the
readers but categorizing news article manually is laborious,              The paper's main motivation is to help in recommending
sluggish and expensive. Moreover, it gets more difficult when         relevant news to the Bengali online news readers using multi-
considering a resource-insufficient language like Bengali which is    category classification. Readers are only attracted to the news
the fourth most spoken language of the world. However, very few       articles of their interest [2]. For this purpose, the readers have
approaches have been proposed for categorizing Bangla news            to explore all the news articles of different news sites to get the
articles where few machine learning algorithms were applied           desired items. For example, a user interested in entertainment-
with limited resources. In this paper, we accentuate multiple         related news has to go through all the news articles from
machine learning approaches including a neural network to             various news sites and analyze information from multiple
categorize Bangla news articles for two different datasets. News      tiresome sources. A user would prefer such a system or
articles have been collected from the popular Bengali newspaper       framework that would gather news articles of interest from
Prothom Alo to build Dataset I and dataset II has been gathered
                                                                      various news sites and access the system anywhere on any
from the famous machine learning competition platform Kaggle.
                                                                      electronic device. Although frameworks are available to notify
We develop a modified stop-word set and apply it in the
preprocessing stage which leads to significant improvement in
                                                                      the readers about news' on their desire categories, manually
the performance. Our result shows that the Multi-layer Neural         categorizing thousands of online Bangla news articles is
network, Naïve Bayes and support vector machine provide better        challenging. Moreover, appropriate categorization of Bangla
performance. Accuracy of 94.99%, 94.60%, 95.50% has been              news articles considering their content is essential for the
achieved for SVM, Logistic regression and Multi-layer dense           readers and designing an automated system for this purpose is
neural network, respectively.                                         a crying need.
                                                                          Several approaches have been proposed for news
    Keywords—Bangla news classification; supervised learning;
feature extraction; category prediction; machine learning; neural
                                                                      categorization for different languages, i.e. Indonesian [4],
network                                                               Hindi[5], Arabic[6][11], Spanish [7], and these approaches
                                                                      mainly based on traditional machine learning algorithms such
                           I.   INTRODUCTION                          as Naïve Bayes, decision tree, K-Nearest Neighbors etc. Since
                                                                      Bengali is morphologically rich and complex considering the
    A newspaper is known as a powerhouse of information.
                                                                      large scale of alphabets, grapheme and dialects, it needs special
People get the latest information about their desired content
                                                                      consideration of its features in the training phase for
through online or offline newspapers. Thousands of
                                                                      classification on Bangla news based on its context. However,
newspapers are published in different languages all over the
                                                                      some approaches are available in Bangla language [13-16], but
world. Whatever happens around the world may be a thousand
                                                                      these researches were limited to some traditional methods and
miles away but reaches us within a second through online news
                                                                      dealt with small datasets. Due to the scarcity of resources and
content. In the recent years, the importance of online articles
                                                                      the complex structure of Bangla text, it's been a challenging
has also increased rapidly due to the rapid rise and availability
                                                                      task to classify the Bangla news.
of smart devices. Bangla is the fourth most spoken language
and vast amounts of Bangla news articles are produced every               In this paper several popular machine learning models and
hour worldwide. Choosing the appropriate information from             a multi-layer dense neural network are implemented on two
the sea of web is difficult as the news has no categorization         different datasets. Dataset I has been built of five categories
based on its content. Online news websites provide subject            called Economics, Entertainment, International, Science and
categories and sub-categories [1] which significantly vary            Technology and, Sports containing 1425 documents from

   *Corresponding Author

                                                                                                                          757 | P a g e
                                                             www.ijacsa.thesai.org
(IJACSA) International Journal of Advanced Computer Science and Applications,
                                                                                                                    Vol. 12, No. 5, 2021

popular Bangla newspaper Prothom Alo available on [20] and            terms based on Arabic corpus and Arabic language dictionary.
collected a dataset named dataset II from the Kaggle website          Then, the field association terms were classified according to
[17] which has a total of 532509 records with nineteen                FA word classification algorithm. It is customary for people to
categories. But, 169791 records of five categories are used           identify the field of document when they notice peculiar words.
from that dataset in this paper. A list of Bangla stop words are      These peculiar words are referred to as Field Associating
built containing 875 words [21] to remove from the newspaper          words (FA words); specifically, they are words that allow us to
contents for preprocessing purpose. Similar preprocessing steps       recognize intuitively a field of text or field-coherent passage.
are applied for both datasets separately and achieved better          Therefore, to identify the field of a passage FA terms can be
accuracy for multiple machine learning models. The accuracy           used, and to classify various fields among passages FA terms
of 92.63% and 95.50% for dataset I and dataset II was achieved        can be also used.
for the multi-layer dense neural network, respectively.
                                                                          Cervino U et al. applied machine learning techniques to the
    The remaining part of the paper is organized as follows -         automatic classification of news articles from the local
Section II reviews several related works on different types of        newspaper La Capitaolf Rosario, Argentina [7]. The corpus
news classification both for Bangla and other languages.              (LCC) is an archive of approximately 75,000 manually
Section III presents research methodology which describes             categorized articles in Spanish published in 1991. They
datasets and proposed methods. Section IV depicts result              benchmarked on LCC using three widely used supervised
analysis. Finally, this work is concluded and provides future         learning methods: k-Nearest Neighbors, Naive Bayes and
direction in Section V.                                               Artificial Neural Networks, illustrating the corpus properties.
                       II. RELATED WORK                                   This paper delineates the Bangla Document Categorization
                                                                      using Stochastic Gradient Descent (SGD) classifier [8]. Here,
    Text classification is the process of assigning labels to text    document categorization is the task in which text documents
according to its content. It is one of the most fundamental tasks     are classified into one or more of predefined classes based on
in Natural Language Processing (NLP) with broad application           their contents using Support Vector Machines and Logistic
such as sentiment analysis, topic labeling, spam detection,           Regression. Even though SGD has been around in the machine
intent detection etc. Nowadays, many tasks have been                  learning community for a long time, it has received a
conducted on this field. Especially it is done for English            considerable amount of attention just recently in the context of
language as there are enough resources for English language           large-scale learning. In text classification and natural language
[3]. On the other hand, there are not enough resources except         processing, SGD has been successfully applied to large-scale
English for the task because very few works have been carried         and sparse machine learning problems often encountered.
out for the task. However, working on this field is also
increasing day by day in recent times. Some works of text                 Fouzi Harrag, Eyas EI Qawasmah [11] used ANN for the
classification on non-English languages are overviewed in the         classification of Arabic language document. In this paper
following:                                                            Singular Value Decomposition (SVD) had been used to select
                                                                      the most relevant features for the classification.
    Naïve Bayes and Two-Phase Feature Selection Model were
used to predict the test sample category for Indonesian news              Neural network was used for web page classification based
classification. Naive Bayes classifier is quicker and efficient       on augmented PCA [12]. In this paper, each news web page
than the other discriminative models. In text classification           was represented by term weighting schema. The principal
applications and experiments, Naive Bayes (Naïve Bayes)               component analysis (PCA) had been used to select the most
probabilistic classifier is often used because of its simplicity       relevant features for the classification. Then, the final output of
and effectiveness using the joint probabilities of words and          the PCA is augmented with the feature vectors from the class-
categories given a document [4]. M. Ali Fauzi et al. [4] used         profile which contains the most regular words in each class
Naïve Bayes for Indonesian news classification. Abu Nowshed           before feeding them to the neural networks. According to this
Chy et al. [10] used Naïve Bayes for Bangla news                      paper it's evident that, in case of Sports news, WPCM provides
classification.                                                       most acceptable classification accuracy based on their datasets.
                                                                      Their experiment evaluation also demonstrates the same.
    Machine learning approach was used for the classification
of indirect anaphora in Hindi corpus [5]. The direct anaphora             A research group of Shahjalal University of Science &
has the ability to find the noun phrase antecedent within a            Technology used different machine learning based approaches
sentence or across few sentences. But, indirect anaphora does         of baseline and deep learning models for Bengali news
not have explicit referent in the discourse. They suggested           categorization [13]. They used baseline models such as: Naïve
looking for certain patterns following the indirect anaphora and      Bayes, Logistic Regression, Random Forest and Linear SVM
marking demonstrative pronoun as directly or indirectly               and deep learning models like BiLSTM, CNN. They found out
anaphoric accordingly. Their focus of study was pronouns              that the highest result comes from the Support Vector Machine
without noun phrase antecedent.                                       in the base model and CNN in deep learning where CNN gave
                                                                      the best performance for their Dataset.
    A method was designed for classification of Arabic news,
the classification system that best fits data given a certain             In paper [14] authors used multi-layer dense neural network
representation [6]. A new method was presented for Arabic             for Bangla document categorization. As feature selection
news classification using field association words (FA words).         technique they used TF-IDF method. They used three dense
The document preprocessing system generated the meaningful            layers and 2 dropout layers. They got 85.208% accuracy.

                                                                                                                          758 | P a g e
                                                             www.ijacsa.thesai.org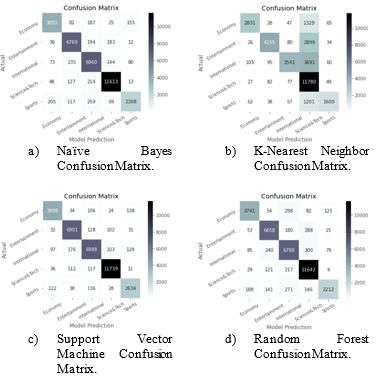
(IJACSA) International Journal of Advanced Computer Science and Applications,
                                                                                                                          Vol. 12, No. 5, 2021

    Authors on [15] used four supervised learning methods                                    TABLE I.     DETAILS OF DATASET I
namely Decision Tree, K-Nearest Neighbor, Naïve Bayes, and                  Category                 No. of Docs       Words/Doc(Average)
Support Vector Machine for categorization of Bangla web                     Economics                285               433
documents. They also build their own dataset corpus but they
                                                                            Entertainment            285               380
didn‟t publish it. Their corpus included 1000 documents with a
                                                                            International            285               299
total number of words being 22,218. Their Dataset included
five categories such as business, health, technology, sports and            Science &Technology      285               381
education. As feature selection they used TF-IDF method and                 Sports                   285               349
they got 85.22% f-measure for Naïve Bayes, 74.24% for K-                    Total                    1425              367
Nearest Neighbor, 80.65% for Decision Tree and 89.14% for
Support Vector Machine.                                                                      TABLE II.    DETAILS OF DATASET II

    An exploration group used Bidirectional Long Short Term                 Category                No. of Docs           Words/Doc
Memory (BiLSTM) for classification of Bangla news articles                  Economics               20858                 277
[16]. They used Gensim and fastText model for vectorization                 Entertainment           36791                 237
of their text. Their Dataset contained around 1 million articles            International           37176                 235
and 8 different categories. They got 85.14% accuracy for                    Science & Tech          15117                 231
BiLSTM for their Dataset.                                                   Sports                  59849                 261
                                                                            Total                   169791                250
                        III. METHODOLOGY
    The goal of this proposed model is to categorize Bangla                 B. Data Pre-processing
news automatically based on the content of the document. In                     Data Preprocessing is a technique that is used to convert the
order to meet this up, some steps are performed such as 1) Data             raw data into a clean data set. Preprocessing the data is an
collection, 2) Data preprocessing, 3) Feature selection and                 important task and it is essential for getting better accuracy. In
extraction, 4) Dividing Dataset into training and testing set,              the experiment, the data was processed by several techniques
5) Building and fitting models, 6) Category prediction. Fig. 1              such as removing empty data from document, tokenization,
depicts an overview of the approach. The details of the steps               punctuation removal and stop word removal, white space
are explained in following paragraphs.                                      removal, number removal.
A. Data Collection                                                              1) Tokenization: Splitting a text into sentences, then
    Data is crucial in machine learning which required a lot of             words, and then characters. Based on spaces, texts are broken
data to come up with somewhat generalizable models. The                     down into words and using the list function; words are broken
Bangla dataset corpus is built for this research task & the news            down into characters.
articles have been collected from the popular news portal                       2) Punctuation, special character and number removal:
Prothom Alo online newspaper. News articles of five                         Punctuation like ; : । „ " ‟ , ? !, etc. and special character like
categories     such     as     „International‟,     „Economics‟,
                                                                            @, #, $, %, ^, &, (, *, ), etc. and number that is not important
„Entertainment‟, „Sports‟, „Science and Technology‟ has been
used for the dataset. This dataset corpus consists of 1425                  for classification are removed from the whole Dataset.
documents. Each category contains 285 documents, which can                      3) Stop word removal: High-frequency words common in
be found at [20]. Details of the dataset are represented in                 every document and have not much influence in the text are
Table I.                                                                    called stop words. Stop words are collected from two different
                                                                            sources [18]&[19], and combined unique stop words and
    Another dataset is also downloaded from the Kaggle
website [17]. This Dataset contains newspaper articles from                 increased the number of stopwords. The stop words list that
2013 to 2019 from Prothom Alo. The newspaper articles have                  was build contains 875 stop words, and it can be found at [21].
already been classified into different categories such as                   The list of 361 bangali stop words like “            ,         , এ,
International, State, Economy, etc. Only five categories,                   এ ,           ,             ,       , হয়, etc.” All the stop words
namely, Entertainment, International, Economic, Sports, and                 are removed from the Dataset for getting better accuracy.
Technology. In the Table II, the details and statistical analysis               4) Categorical encoding: There are two types of
of the whole Dataset are given.                                             categorical encoding entitled label encoding and one-hot
                                                                            encoding. In label encoding, each label is assigned a unique
                                                                            integer based on alphabetical ordering. On the other hand,
                                                                            each category is represented as a one-hot vector in one hot
                                                                            encoding. That means only one bit is hot or true at a time. An
                                                                            example of a one-hot encoding of a dataset with two
                                                                            categories is given in Table III. Label encoding technique has
                                                                            been used for encoding category in machine learning
                                                                            algorithms and one-hot encoding for multi-layer dense neural
                                                                            network.
        Fig. 1. Overview of Bangla News Classification System.

                                                                                                                                  759 | P a g e
                                                                  www.ijacsa.thesai.org
(IJACSA) International Journal of Advanced Computer Science and Applications,
                                                                                                                       Vol. 12, No. 5, 2021

            TABLE III.     EXAMPLE OF ONE HOT ENCODING                   Term Frequency is defined as how frequently the word
                 Label 1           Label 2          Label 3              appears in the document or corpus. Term frequency can be
                                                                         defined as:
Doc 1            0                 0                1
Doc 2            1                 0                0                    TF = No. of time word appear in the doc. / Total no. of word
                                                                         in the doc.
    After the data preprocessing step, statistical analysis step is
performed on both Dataset to see if data preprocessing step is               Inverse document frequency is another concept that is used
successfully performed and how words are related to each                 for finding out the importance of the word. It is based on the
category. Fig. 2 illustrates the flow chart of the data                  fact that less frequent words are more informative and
preprocessing system. Fig. 3 and Fig. 4 illustrate the 14 most           essential. IDF is represented by the formula:
frequent words of each category of Dataset I and Dataset II. It          IDF = No of Docs / No of Docs in which the word appears
is seen that these words are strongly related to corresponding
categories that help the model successfully predict a document               TF-IDF is a multiplication between TF and IDF value. It
category. After pre-processing step, structure and number of             reduces the importance of the common word that is used in a
word is changed on datasets. The detailing after pre-processing          different document. And only take important words that are
step of the two dataset is given in Table IV and Table V.                used in classification. TF-IDF matrix of first 10 docs and first
                                                                         six words of dataset I is given in Table VI.
C. Feature Selection and Extraction
    In this step, string features are converted into numerical
features. Bag of words and TF-IDF model are used for
converting string features into numerical features for
performing the mathematical operation. Dataset I consists of
43404 unique words, and Dataset II that is downloaded from
the Kaggle website [17] consists of 915428 unique words after
data preprocessing. All the words do not have impact on the
classification. So, the most frequent words have been used as
features that have importance to classification. For selecting
features, a Count vectorizer was utilized, which works based
on the frequencies of words. Both datasets‟ model accuracy are                           Fig. 2. Flow Chart of Data Preprocessing System.
observed in the Count vectorizer approach by considering
different minimum document frequencies and maximum                                  TABLE IV.      DATASET I DETAILS AFTER PREPROCESSING
document frequencies. And for Dataset I, the best result is              Category                 Total Words        Words/Doc     Unique Words
found by considering minimum document frequency 10, which
means the words are excluded that are only on 10 or less than            Economics                75379              282           12462
10 documents and maximum document frequency 0.6, which                   Entertainment            64895              243           15722
means the words that are on the 60% document or more than
                                                                         International            53174              199           11883
that. For Dataset II, the highest accuracy is got by considering
minimum frequency 10 and maximum document frequency 0.6                  Science and
                                                                                                  65830              244           14381
                                                                         Technology
because those words have no significance in determining the
class. In this paper 1320 most frequent words are used as a              Sports                   62449              230           13300
feature vector for Dataset I, and the rest of the words are              Total                    341702             240           55748
excluded. For Dataset II, 10,000 most frequent words are used
as a feature vector.                                                              TABLE V.         DATASET II DETAILS AFTER PREPROCESSING
    After selecting features, the TF-IDF vectorizer has been
                                                                         Category               Total Words        Words/Doc       Unique Words
used for feature extraction because count vectorizer doesn‟t
return the proper value. As it is known, count vectorizer only           Economics              5071921            243             271773
returns 0 or 1 as the value of a different word which does not           Entertainment          4972334            135             290961
states the transparent frequency of different words from a
                                                                         International          3319266            89              158302
document.
                                                                         Science and
    1) Bag of words: It is a basic model used in natural                                        1971826            130             147524
                                                                         Technology
language processing. A bag-of-words is a representation of               Sports                 8879569            148             379027
text that describes the occurrence of words within a document.
                                                                         Total                  24214916           142             1247587
    2) TF-IDF: TF-IDF stands for Term Frequency-Inverse
Document Frequency which says the word's importance in the
corpus or Dataset. TF-IDF contain two concept Term
Frequency (TF) and Inverse Document Frequency (IDF).

                                                                                                                                      760 | P a g e
                                                               www.ijacsa.thesai.org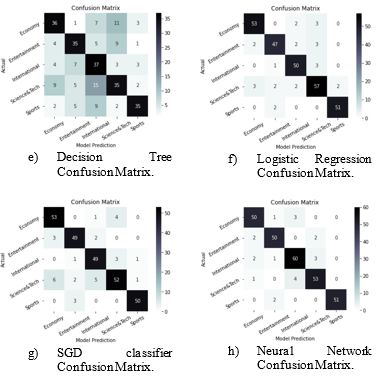
(IJACSA) International Journal of Advanced Computer Science and Applications,
                                                                                           Vol. 12, No. 5, 2021

  Fig. 3. Fourteen most frequent words of each category after data cleaning of Dataset I

Fig. 4. Fourteen most Frequent Words of each Category after Data Cleaning of Dataset II.

                                                                                                 761 | P a g e
                                    www.ijacsa.thesai.org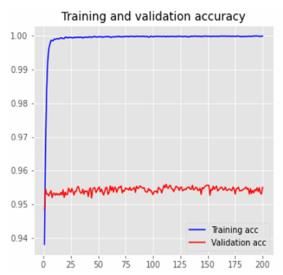
(IJACSA) International Journal of Advanced Computer Science and Applications,
                                                                                                                       Vol. 12, No. 5, 2021

 TABLE VI.       TF-IDF MATRIX OF FIRST TEN DOCS AND FIRST SIX WORDS      each dense layer, one dropout layer added with a 20% dropout
                             OF DATASET I
                                                                          rate.
                        WORD
             WORD 1              WORD 3   WORD 4    WORD 5    WORD 6          For the layers between the input and output layer, relu
                        2
                                                                          activation function is used, and in the output layer, the softmax
DOC 1        0          0        0        0         0         0
                                                                          function is used as an activation function. Before training the
DOC 2        0          0        0        0         0         0           model, the learning process is configured using optimizer and
DOC 3        0          0        0.038    0         0         0           loss      function.      Here      adam       optimizer       and
                                                                          categorical_crossentropy is used as optimizer and loss function
DOC 4        0          0        0        0         0         0
                                                                          respectively to train the model. Different numbers of dense
DOC 5        0          0.038    0        0         0         0           layers, different numbers of nodes between layers, and
DOC 6        0          0        0        0         0         0           different epochs are used for checking the accuracy of the
                                                                          model. Finally, the model is built by adding three dense layers.
DOC 7        0.032      0.033    0        0         0         0
                                                                          On the first layer, 750 nodes are added, on the second layer
DOC 8        0          0        0        0         0         0           450 nodes, and on the third layer, 5 nodes are added as the
DOC 9        0          0        0        0         0         0           dataset is of five categories. The multi-layer dense neural
                                                                          network model for the two datasets is depicted in Fig. 5. The
DOC10        0          0        0        0         0         0
                                                                          model is trained in 200 epochs. By doing so, the highest
                                                                          accuracy is got for both Datasets. Step by step procedure that is
E. Splitting Dataset into Training and Testing Set
                                                                          done for building a multilayer dense neural network model for
    After Successful feature extraction, Datasets are split into          getting the highest accuracy Bangla news classification is
train and test datasets. Both datasets are divided into 4:1. Four         represented in Fig. 6. How the training loss and accuracy
portions of dataset are used for the training set, and the rest           changes in both Dataset is represented in Fig. 7 and Fig. 8,
portion is for testing. That means 80% of data from the datasets          respectively.
are used for training, and the rest 20% is considered as the
testing. This step is done using the sklearn library, which is
very simple.
F. Building and Fitting Models
    In this stage, the datasets are fitted into different machine
learning classifier algorithms and neural network.
    1) Using machine learning classifier algorithm: Here
several machine learning classifiers used such as Naïve Bayes,
K-Nearest Neighbor, Support Vector Machine, Random
Forest, Decision Tree for the classification of Bangla news &
import sklearn built-in classifier for this.
    2) Using multi-layer dense neural network: Here the data
preprocessing technique and feature extraction technique is
the same as machine learning algorithms. However, one hot
encoder is used for encoding the encoding category. For
categorizing task, feed forward neural network is used as                             (a) For dataset I               (b) For dataset II
classification algorithm. It is organized in the form of multiple                     Fig. 5. Multi-layer Dense Neural Network Model.
layers. In the proposed model, dense layer has been used. Feed
forward neural network consists of the input layer, the hidden
layers and the output layer. Dataset generated Input patterns
are transmitted from input layer to next layer which is also
called by first hidden layer. Later output from the first hidden
layer is being used as the input of the second hidden layer.
The same process continueing untill reach the last hidden
layer. Finally, the output of the last hidden layer is being used
as the input of output layer or last layer. For building such
model, Sequential model has been used. This model uses a
linear stack of layers. The most common layer is a dense layer
which is a regular densely connected neural network layer
with all the weights and biases. In the first layer input shape is
determined since the following layers can make automatic
shape inference. To build the Sequential model, layers one by              Fig. 6. Step by Step Procedure of Feed-forward Multi-layer Dense Neural
                                                                                           Network for Bangla News Classification.
one are added in order. Total three dense layers used. After

                                                                                                                                     762 | P a g e
                                                                  www.ijacsa.thesai.org
(IJACSA) International Journal of Advanced Computer Science and Applications,
                                                                                                                            Vol. 12, No. 5, 2021

                                                                                                  IV. RESULT AND DISCUSSION
                                                                                    In this section, the performances of the model are analyzed
                                                                                on different machine learning algorithms and neural network
                                                                                for both Datasets.
                                                                                A. Accuracy of Model
                                                                                    Onfusion matrix is a presentation for summarizing the
                                                                                performance of a classification algorithm. The confusion
                                                                                matrix for all classifier algorithms is given in Fig. 10 and
                                                                                Fig. 11 for Dataset I and Dataset II, respectively. By judging
     Fig. 7. Training and Validation Accuracy and Loss for Dataset I.
                                                                                the confusion matrix the best model can be decided. From this
                                                                                matrix, the accuracy, precision, recall, and f1-score of the built
                                                                                model can be calculated. For different classifiers, different
                                                                                confusion matrices are built and from those confusion matrices,
                                                                                the accuracy, precision, recall, and f1-score of different
                                                                                classifiers is calculated. The performances of the different
                                                                                models are represented in Tables VII and VIII for dataset I and
                                                                                dataset II respectively and the highest precision, recall and
                                                                                accuracy category wise for all the classifiers are shown as bold
                                                                                font. Overall performance of different classifier model is
                                                                                shown in Tables IX and X for both dataset respectively. Here,
                                                                                highest accuracy, precision and recall, and f1-score of
                                                                                algorithms are shown also as bold font. Fig. 12 is a plot of the
    Fig. 8. Training and Validation Accuracy and Loss for Dataset II.           accuracy of different classifiers for both datasets. F1-score of
                                                                                classifiers according to news type is shown on Fig. 13 and
G. Category Prediction                                                          Fig. 14 for Dataset I and Dataset II respectively.
    After fitting Dataset to classifier, the main job is to predict
category. In this stage, the model is trained to predict the test                   1) Naïve bayes: Both dataset have five categories. From
data that are unseen to the machine. If any vectorized sample of                Tables VII and VIII it is clear that there are variations in
Bangla news is given to the model, it can predict the category                  different performance rate for different types of news. For
of the sample data. Here for training, as different classifiers are             dataset I Entertainment has the lowest f1-score and for dataset
used such as Naïve Byes, Decision Tree, K-Nearest Neighbors,                    II sports has the lowest f1-score when Naïve Bayes classifier
Support Vector Machine, Random Forest, and also the model                       is used. If all the categories are combined the accuracy for
which is made by neural network can predict the category of                     Naïve Bayes model is 91.23% and 92.76% for dataset I and
vectorized sample data.                                                         dataset II, respectively.
     The model and vectorizer are saved as a pickle file and then                   2) K-Nearest neighbor: The accuracy of this model is
it is used to classify. A random sample is given to the model                   84.81 % for dataset I and 70.4% for dataset II. The lowest
and it successfully classifies the random sample. A screenshot                  performance rate is found for entertainment category in
of the random testing is given in Fig. 9.                                       dataset I and the same is international category in dataset II.
                                                                                    3) Support vector machine: Support Vector Machine can
                                                                                be defined over a vector space where the problem is for
                                                                                finding a decision surface that “best” separates the data points
                                                                                in two classes [9]. Support Vector Machine has different types
                                                                                of kernels. The linear kernel is used for the purpose. Overall
                                                                                accuracy of this model is 89.12% for dataset I and 94.99% for
                                                                                dataset II. Here science and technology category shows the
                                                                                lowest performance rate for dataset I and for dataset II sports
                                                                                category shows the lowest performance.
                                                                                    4) Random forest: For building Random Forest classifier
                                                                                model entropy criterion and 50 n_estimators are used here and
                                                                                got accuracy 87.01% for dataset I and 91.4% for dataset II. In
                                                                                the prediction model the lowest rate of performance is found
                                                                                in science and technology category for dataset I and sports for
                                                                                dataset II.
  Fig. 9. Screenshot of Output of Successfully Classifying given Sample.
                                                                                    5) Decision tree: The overall accuracy of this model is
                                                                                62.45% for dataset I and for dataset II accuracy is 79.87%.
                                                                                Again for dataset I science and technology has the lowest rate
                                                                                of performance and for dataset II sports has the lowest rate of

                                                                                                                                   763 | P a g e
                                                                        www.ijacsa.thesai.org
(IJACSA) International Journal of Advanced Computer Science and Applications,
Vol. 12, No. 5, 2021
performance in this prediction model. On the other hand the
highest rate of performance is found in sports category for
dataset I and science and technology is for dataset II.
6) Logistic regression: Again, the lowest accuracy is
found for science and technology category in dataset I and
sports category in dataset II in this model.. The highest rate of
performance in the prediction model is sports for dataset I and
science and technology for dataset II. The overall accuracy of
this model is 90.52 % for dataset I and 94.6% for dataset II.
7) SGD classifier: If all the categories are combined to get
the accuracy of the SGD classifier, the accuracy is 88.77% and
93.78% for dataset I and dataset II, respectively. The SGD
confusion matrix is shown in Fig. 10(g) and 11(g) for both
dataset which shows which category has high performance.
For dataset I sports has the highest f1-score and science and
technology category has the lowest f1-score and for dataset II
science and technology has the highest f1-score and sports has
the lowest f1-score.
Fig. 11. Confusion Matrix of different Classifiers for Dataset II.
TABLE VII. RESULT COMPARISON BETWEEN MACHINE ALGORITHMS OF
DATASET I
Classifiers Category Precision Recall F1-score
Economics 0.94 0.93 0.93
Entertainment 0.83 0.90 0.86
Naïve
International 0.91 0.92 0.91
Bayes
Science&Tech 0.92 0.89 0.90
Sports 0.96 0.90 0.93
Economics 0.84 0.93 0.88
Entertainment 0.81 0.81 0.81
K-Nearest
International 0.78 0.87 0.82
Neighbor
Science&Tech 0.89 0.78 0.83
Sports 0.91 0.85 0.87
Fig. 10. Confusion Matrix of different Classifiers for Dataset I.
764 | P a g e
www.ijacsa.thesai.org(IJACSA) International Journal of Advanced Computer Science and Applications,
Vol. 12, No. 5, 2021
Economics 0.90 0.86 0.88 Science&Tech 0.97 0.97 0.97
Entertainment 0.87 0.88 0.87 Sports 0.89 0.89 0.89
Support
Vector International 0.87 0.92 0.89 Economics 0.91 0.87 0.89
Machine
Science&Tech 0.85 0.86 0.85 Entertainment 0.92 0.92 0.92
Random
Sports 0.96 0.92 0.94 International 0.87 0.90 0.88
Forest
Economics 0.85 0.89 0.87 Science&Tech 0.93 0.97 0.95
Entertainment 0.87 0.92 0.89 Sports 0.90 0.74 0.81
Random
International 0.84 0.89 0.86 Economics 0.76 0.75 0.75
Forest
Science&Tech 0.84 0.75 0.79 Entertainment 0.81 0.81 0.81
Decision
Sports 0.94 0.90 0.92 International 0.73 0.74 0.73
Tree
Economics 0.65 0.62 0.63 Science&Tech 0.87 0.88 0.87
Entertainment 0.66 0.65 0.65 Sports 0.67 0.66 0.66
Decision
International 0.51 0.68 0.58 Economics 0.93 0.92 0.92
Tree
Science&Tech 0.58 0.53 0.55 Entertainment 0.94 0.95 0.94
Sports 0.79 0.66 0.72 Logistic International 0.92 0.93 0.92
Regression
Economics 0.91 0.91 0.91 Science&Tech 0.97 0.97 0.97
Entertainment 0.90 0.87 0.88 Sports 0.90 0.87 0.88
Logistic International 0.89 0.92 0.90 Economics 0.91 0.91 0.91
Regression
Science&Tech 0.86 0.86 0.86 Entertainment 0.93 0.95 0.94
SGD
Sports 0.96 0.96 0.96 International 0.93 0.91 0.92
Classifier
Economics 0.85 0.91 0.88 Science&Tech 0.96 0.98 0.97
Entertainment 0.89 0.90 0.89 Sports 0.89 0.84 0.86
SGD International 0.85 0.90 0.87 Economics 0.94 0.94 0.94
Classifier
Science&Tech 0.88 0.78 0.82 Multi-layer Entertainment 0.98 0.98 0.98
Dense
Sports 0.96 0.94 0.95 International 0.94 0.94 0.94
Neural
Economics 0.91 0.93 0.92 Network Science&Tech 0.91 0.89 0.90
Multi-layer Entertainment 0.93 0.93 0.93 Sports 0.96 0.96 0.96
Dense
International 0.90 0.91 0.90
Neural
Network Science&Tech 0.91 0.91 0.91
Sports 1.00 0.96 0.98
TABLE VIII. RESULT COMPARISON BETWEEN MACHINE LEARNING
ALGORITHMS OF DATASET II
Classifiers Category Precision Recall F1-score
Economics 0.91 0.89 0.90
Entertainment 0.92 0.94 0.93
Naïve Fig. 12. Accuracy of different Classifier for both Dataset.
International 0.89 0.93 0.91
Bayes
Science&Tech 0.96 0.96 0.96
Sports 0.90 0.78 0.83
Economics 0.92 0.66 0.77
Entertainment 0.94 0.57 0.71
K-Nearest
International 0.93 0.47 0.62
Neighbor
Science&Tech 0.56 0.98 0.71
Sports 0.88 0.54 0.67
Economics 0.93 0.93 0.93
Support
Vector Entertainment 0.95 0.96 0.95
Machine Fig. 13. Comparison of f1-score of Dataset I of different Classifier according
International 0.93 0.93 0.93
to the News Types.
765 | P a g e
www.ijacsa.thesai.org(IJACSA) International Journal of Advanced Computer Science and Applications,
Vol. 12, No. 5, 2021
TABLE IX. OVERALL PERFORMANCE OF DIFFERENT CLASSIFIER MODEL
ON DATASET I
Classifiers F1-
Accuracy Precision Recall
Type Name score
Naïve
91.23% 91.37% 91.28% 91.32%
Bayes
K-Nearest
84.81% 85.13% 85.06% 85.09%
Neighbor
Support
Vector 89.12% 89.41% 89.30% 89.35%
Machine
Machine
Fig. 14. Comparison of f1-score of Dataset II of different Classifier according Learning Random
87.01% 87.20% 87.49% 87.34%
to the News Types. Algorithm Forest
Decision
62.45% 64.01% 62.29% 63.44%
8) Multi-layer dense neural network: In this case, Tree
international news for dataset I and science and technology Logistic
90.52% 90.72% 90.71% 90.72%
news for dataset II have the lowest rate of performance. In Regression
Machine learning model it can be seen that, In dataset I, all SGD
88.77% 88.96% 89.19% 89.08%
classifiers returned lowest performance in science & Classifier
Technology category, except Naive Bayes and K-Nearest Multi-layer
Neighbor. Where in dataset II, all classifiers gives lowest Neural Dense
92.63% 93% 92.8% 92.8%
Network Neural
performance in sports category where only K-nearest Network
neighbour gives lowest performance on other category. But ,it
doesn‟t happen in multi-layer dense neural network model. TABLE X. OVERALL PERFORMANCE OF DIFFERENT CLASSIFIER MODEL
The accuracy of this model is also quite impressive. For ON DATASET II
dataset I sports and for dataset II, entertainment has the Classifiers F1-
highest rate of performance. This model has the highest Accuracy Precision Recall
score
Type Name
accuracy comparing the other traditional machine learning
models. The overall accuracy of this model is 92.63% for Naïve
92.76% 91.84% 90.24% 91.03%
Bayes
dataset I and 95.50% for dataset II.
K-Nearest
70.4% 85.05% 64.6% 73.42%
B. Comparison of Algorithms Neighbor
Table IX shows that in the traditional machine learning Support
algorithms for dataset I the highest result comes from the Vector 94.99% 93.84% 93.78% 93.81%
Machine
Naïve Bayes classifier model and Table X shows for dataset II Machine
Support Vector Machine has the highest result. But for both Learning Random
91.4% 91.07% 88.36% 89.7%
dataset the highest accuracy comes from multi-layer dense Algorithm Forest
neural network. That means multi-layer dense neural network Decision
79.87% 77.03% 76.81% 76.92%
gives the best performance for both dataset. In Table IX it is Tree
also shown that decision tree classifier gives the worst result Logistic
94.6% 93.54% 93.14% 93.34%
for dataset I. On the other hand from Table X, it is shown that Regression
k-nearest neighbor classifier gives the worst result. If the SGD
confusion matrix of Fig. 11(b) is observed it is seen that the 93.78% 92.68% 91.92% 92.30%
Classifier
highest false classification is found for k-nearest neighbor. Multi-layer
From Tables IX and X of overall performance, it is shown that Neural Dense
95.50% 94.6% 94.2% 94.4%
most of the classifiers have low variance and low bias which Network Neural
indicates the proposed model doesn‟t have underfitting and Network
overfitting.
766 | P a g e
www.ijacsa.thesai.org(IJACSA) International Journal of Advanced Computer Science and Applications,
Vol. 12, No. 5, 2021
[8] Kabir, F., Siddique, S., Kotwal, M. R. A., & Huda, M. N. (2015,
V. CONCLUSION AND FUTURE WORK March). “Bangla text document categorization using stochastic gradient
descent (sgd) classifier”. In 2015 International Conference on Cognitive
The main focus of this research is to build an automatic Computing and Information Processing (CCIP) (pp. 14). IEEE.
classification system for Bangla News documents. This system [9] Y. Yang and X. Liu, “A re-examination of text categorization methods,”
provides users an efficient and reliable access to classified in Proceedings of the 22Nd Annual International ACM SIGIR
news from different sources. Different as well as most widely Conference on Research and Development in Information Retrieval, ser.
used machine learning classifiers and multi-layer dense neural SIGIR ‟99. New York, NY, USA: ACM, 1999, pp. 42–49. [Online].
Available: http://doi.acm.org/10.1145/312624.312647.
network are used for categorization and a comparison has been
[10] Chy, Abu Nowshed & Seddiqui, Hanif & Das, Sowmitra. (2014).
conducted between them. Among the classifier algorithms, “Bangla news classification using naive Bayes classifier”. 16th Int'l
Support Vector machine Classifier provides the best result. In Conf. Computer and Information Technology, ICCIT 2013.
the model, TF-IDF technique is used for vectorization to fit 10.1109/ICCITechn.2014.6997369.
data to the classifier. [11] FouziHarrag,Farhat ABBAS University,Eyas EI Qawasmah,JUST
University,“Neural Network for Arabic Text Classification”, in 2009
In future, word2vec model will be used for better result and Second International Conference on the Applications of Digital
for preventing the limitation of TF-IDF model. In TF-IDF Information and Web Technologies,
model, more importance is put on the uncommon words. But, doi:10.1109/ICADIWT.2009.5273841.
semantic information of the words is not stored in TF-IDF [12] Selamat, A., & Omatu, S. (2003, July). Neural networks for web page
model. classification based on augmented PCA. In Proceedings of the
International Joint Conference on Neural Networks, 2003. (Vol. 3, pp.
In this research, multi-layer dense neural network and some 1792-1797). IEEE.
built in classifier like Naïve Bayes classifier, k-nearest [13] Hossain, M. R., Sarkar, S., & Rahman, M. “Different Machine Learning
neighbor classifier, random forest classifier, support vector based Approaches of Baseline and Deep Learning Models for Bengali
News Categorization”. International Journal of Computer Applications,
machine classifier and decision tree classifier were used. In 975, 8887.
future, CNN, RNN and other neural network model will be [14] Manisha Chakraborty, and Mohammad Nurul Huda, “Bangla Document
examined to build the model for better performance. Categorization using Multilayer Dense Neural Network with TF-IDF”,
REFERENCES International Conference on Advances in Science, Engineering Robotics
Technology (ICASERT 2019), May 3-5, 2019, Dhaka, Bangladesh, pp.
[1] Tenenboim, L., Shapira, B. and Shoval, P. 2008. “Ontology-based 1-4.J. Clerk Maxwell, A Treatise on Electricity and Magnetism, 3rd ed.,
classification of news in an electronic newspaper”. vol. 2. Oxford: Clarendon, 1892, pp.68–73.
[2] Pendharkar, B., Ambekar, P., Godbole, P., Joshi, S. and Abhyankar, S. [15] Mandal, A. K., & Sen, R. (2014). “Supervised learning methods for
2007. “Topic categorization of rss news feeds, Group”. bangla web document categorization”. arXiv preprint arXiv:1410.2045.
[3] Carreira, R., Crato, J. M., Gonçalves, D. and Jorge, J. A. 2004. [16] M. M. H. Shahin, T. Ahmmed, S. H. Piyal and M. Shopon,
“Evaluating adaptive user profiles for news classification”. 9th "Classification of Bangla News Articles Using Bidirectional Long Short
international conference on Intelligent user interfaces, pp. 206–212. Term Memory," 2020 IEEE Region 10 Symposium (TENSYMP),
[4] Fauzi, M. A., Arifin, A. Z., Gosaria, S. C., & Prabowo, I. S. (2016). Dhaka, Bangladesh, 2020, pp. 1547-1551, doi:
“Indonesian News Classification Using Naïve Bayes and Two-Phase 10.1109/TENSYMP50017.2020.9230737.
Feature Selection Model”. Indonesian Journal of Electrical Engineering [17] twintyOne, “Prothom alo [2013 - 2019]”, Aug 2019. [Online].
and Computer Science, 2(3), 401-408. Available: https://www.kaggle.com/twintyone/prothomal .
[5] Dutta, K., Kaushik, S., & Prakash, N. (2011). “Machine learning [18] stopwords-iso stopwords-bn. [Online]. Available: https://github.com/
approach for the classification of demonstrative pronouns for Indirect stopwords-iso/stopwords-bn.
Anaphora in Hindi News Items”. The Prague Bulletin of Mathematical
Linguistics, 95(1), 33-50. [19] Bengali Stopwords, [Online]. Available: https://www.ranks.nl/
stopwords/bengali?fbclid=IwAR3gFJxN8Yo3BT6S9bMGY87NQzudq
[6] El-Barbary, O. G. (2016). “Arabic news classification using field Mf7z9kxX4veH0aYMLZBBrDaCrZH1jo.
association words”. Advances in research, 1-9.
[20] sharminyeasmin198, “Bengali News Dataset (Prothom alo)”, March
[7] Beresi, U. C., Adeva, J. G., Calvo, R. A., & Ceccatto, A. H. (2004, 2021. [Online]. Available: https://www.kaggle.com/sharminyeasmin198
August). “Automatic classification of news articles in Spanish”. In Actas /bengali-news-dataset-prothom-alo.
del Congreso Argentino de Ciencias de Computación (CACIC) (pp.
1588-1600). [21] sharminyeasmin198, “Bengali Stopwords 2021”, March 2021. [Online].
Available: https://www.kaggle.com/sharminyeasmin198/bengali-
stopwords-2021.
767 | P a g e
www.ijacsa.thesai.orgYou can also read