Analysis of European Power Price Increase Drivers - A EURELECTRIC study May 2014
←
→
Page content transcription
If your browser does not render page correctly, please read the page content below
Analysis of European Power Price Increase
Drivers
A EURELECTRIC study

May 2014
EURELECTRIC is the voice of the electricity industry in Europe.

We speak for more than 3,500 companies in power generation, distribution, and supply.

We Stand For:

Carbon-neutral electricity by 2050

We have committed to making Europe’s electricity cleaner. To deliver, we need to make use of all low-carbon technologies: more renewables, but
also clean coal and gas, and nuclear. Efficient electric technologies in transport and buildings, combined with the development of smart grids and a
major push in energy efficiency play a key role in reducing fossil fuel consumption and making our electricity more sustainable.

Competitive electricity for our customers

We support well-functioning, distortion-free energy and carbon markets as the best way to produce electricity and reduce emissions cost-efficiently.
Integrated EU-wide electricity and gas markets are also crucial to offer our customers the full benefits of liberalisation: they ensure the best use of
generation resources, improve security of supply, allow full EU-wide competition, and increase customer choice.

Continent-wide electricity through a coherent European approach

Europe’s energy and climate challenges can only be solved by European – or even global – policies, not incoherent national measures. Such policies
should complement, not contradict each other: coherent and integrated approaches reduce costs. This will encourage effective investment to ensure
a sustainable and reliable electricity supply for Europe’s businesses and consumers.

EURELECTRIC. Electricity for Europe.

                                            Dépôt légal: D/2014/12.105/20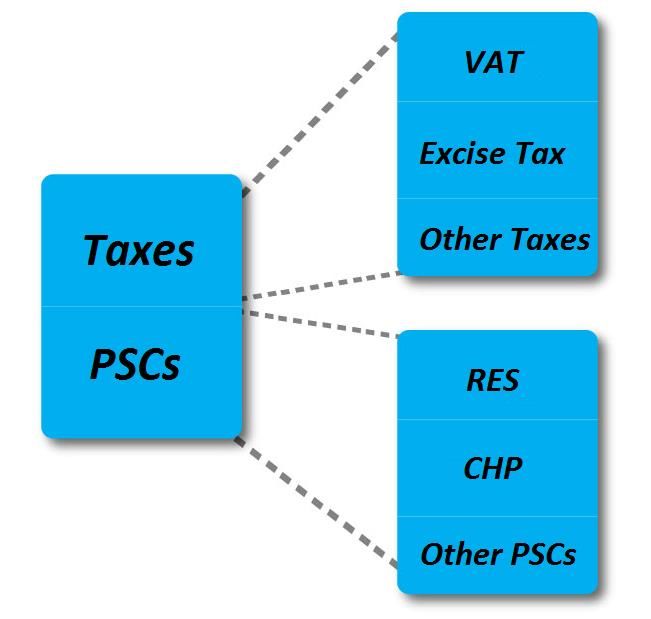
Analysis of European Power Price Increase Drivers
A EURELECTRIC paper May 2014
KEY MESSAGES
Rising power prices are of major concern throughout Europe. Efforts are thus being made by several
stakeholders to understand what the drivers of such increase are. In the wake of the publication of the
European Commission’s analysis of energy prices and costs in Europe (COM (2014) 21), EURELECTRIC
decided to launch its own enquiry into what drives bills up. Its main results are:
Transparency in the way electricity statistics are collected, validated and disseminated is
missing. As a result, customers are not able to see what they pay for.
Member states reporting to the European Commission can include policy support elements – for
instance support given to specific generation technologies – in any of the three components
(energy & supply; network; taxes & levies). These non-standardised reporting obligations lead to
a lack of comparability.
Increases in electricity prices are largely a result of government add-ons, falling within the taxes
& levies component. Between 2008 and 2012 energy & supply costs decreased by 4% and
network costs increased by 10% for households. Taxes & levies rose by as much as 31%, wiping
out any benefits derived from functioning wholesale markets.
Within the taxes & levies component, policy support costs (levies) have more than doubled
between 2008 and 2012. However, taxes such as value-added tax and excise duties still cost 56%
more and make up most of burden. In 2012, European households spent an average of
39€/MWh on taxes and 25€/MWh on policy support costs.
Contact:
Armin Magyar, Economics and Trends Advisor
amagyar@eurelectric.org
Giuseppe Lorubio, Head of Retail Customers Unit
glorubio@eurelectric.org
We would like to express our gratitude to all experts who have contributed national data and enabled
the conduction of this study:

Dominik Lindner (Austria), Vincent Deblocq (Belgium), Ivanka Dilovska and Vesela Katreva (Bulgaria),
Tassos Gregoriou (Cyprus), Lucie Horova and Martin Červenka (Czech Republic), Anders Espensen
(Denmark), Tonis Vare (Estonia), Taina Wilhelms and Antti Kohopää (Finland), Nicole Lepvrier and Jean-
Jacques Nieuviaert (France), Christian Bantle (Germany), Tassos Varthalis (Greece), Agnes Gerse
(Hungary), John MacNamara (Ireland), Marcella Judica (Italy), Edijs Vesperis and Kristaps Ločmelis
(Latvia), Daina Bilkštytė (Lithuania), Louis Philippe (Luxembourg), Anne Marie Grech (Malta), Daphne
Verreth (Netherlands), Ingvar Solberg (Norway), Rejner Andrzej and Pacek Zbigniew (Poland), Robert
Jambrich and Michaela Strazovcova (Slovakia), Klemen Vehovar (Slovenia), Cristina Vazquez Hernandez
(Spain), Anders Sjögren (Sweden), Katrin Lindenberger (Switzerland), Nathan Pamart (United Kingdom).
Contents
1.     Introduction .......................................................................................................................................... 6
     1.1      Background ................................................................................................................................... 6
     1.2      Reporting systems at a glance ...................................................................................................... 7
2.     Identification of Price Increase Drivers ................................................................................................. 9
     2.1      Industrial Price Components ......................................................................................................... 9
     2.2      Household Price Components..................................................................................................... 10
     2.3      European Commission vs. EURELECTRIC Price Components ...................................................... 13
       2.3.1          Taxes and Levies Component.............................................................................................. 13
       2.3.2          Network Component .......................................................................................................... 15
       2.3.3          Energy Component ............................................................................................................. 16
3.     Analysis of Price Increase Drivers ....................................................................................................... 19
     3.1      Policy Support Costs (Levies) ...................................................................................................... 19
       3.1.1          Industrial PSC ...................................................................................................................... 20
       3.1.2          Household PSC .................................................................................................................... 21
       3.1.3          Breakdown of Household Policy Support Costs .................................................................. 22
     3.2      Taxes ........................................................................................................................................... 23
       3.2.1          Industrial Taxes ................................................................................................................... 23
       3.2.2          Household Taxes ................................................................................................................. 23
Annex 1 Methodology................................................................................................................................. 26
Annex 2 Current Legal Framework of Electricity Price Statistics ................................................................ 27
Annex 3 Country Notes ............................................................................................................................... 28
1. Introduction
Rising power prices are of major concern throughout Europe. Efforts are thus being made to understand
what drives bills up. Yet, the current national reporting system does not allow the identification of price
increase drivers in sufficient detail.
To tackle this shortcoming and provide a clearer picture, EURELECTRIC has carried out an analysis of
European power prices with a special focus on price increase drivers.
The analysis is based on a methodological approach that creates a harmonised picture of the effect of
taxes and levies on the total price while other elements are based on official government data.1 This
allows comparability and the identification of the most significant trends at EU and national levels.
The EURELECTRIC study yields a distinct and – to the highest possible extent – homogenous
identification of price increase drivers, along with the assessment of their impact on end-user prices. It
serves as a stepping stone towards any future analysis, providing a quantitative basis for policies that
aim to increase the competitiveness of Europe’s industries and ease the financial burden on European
households.
Results of the EURELECTRIC study are presented in two parts. Chapter 2 identifies price increase drivers.
Chapter 3 provides a detailed analysis of the identified elements that contribute the most to the recent
rise of power prices. Findings of the study are based on an inventory of policy support costs covering 27
countries. Such data has been collected and analyzed for the first time in a comprehensive pan-
European way.
1.1 Background
In May 2013 the European Council mandated the European Commission (EC) to conduct an in-depth
analysis of European energy prices and costs.2 The EC based their analysis on three main price
components: energy & supply, network, and taxes & levies. The EURELECTRIC study keeps this price
1
For further information on the analysed consumer types, consumption bands, reporting period and metadata please
consult the methodological annex.
2
All related documents available at: http://ec.europa.eu/energy/2030_en.htm
6breakdown, with one crucial difference: EURELECTRIC has striven to harmonise the reporting of taxes
and levies. This ensures a cleaner distinction and thus avoids comparisons of overlapping components.
1.2 Reporting systems at a glance
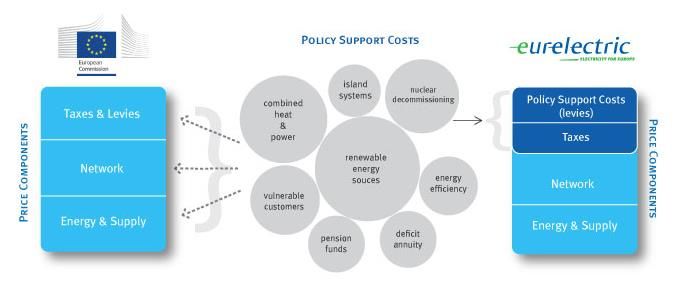
No binding EU framework exists that would ensure the fully harmonised reporting of price components.
The reporting obligation of industrial prices, allows Member States to interpret the legislation in
different ways. For household price components there is no legislation in place at all. Instead, household
prices are currently reported on voluntary basis along the lines of the industrial legislation. As a result,
any country can report to Eurostat any policy support element in any of the three components.3
Therefore, comparing a certain component across member states means that only the name of the
components is identical, while their composition is highly divergent. Conversely, EURELECTRIC’s
reporting system ensures that explicit taxes and levies are not accounted in the energy & supply or the
network component (Figure 1).4
5
Figure 1: Reporting Systems
3
Only policy support costs that are explicitly displayed on consumer bills must be reported in taxes and levies.
4
Embedded taxes, such as real estate or corporate taxation, and the impact of the EU Emission Trading Scheme are
not reallocated from the Energy & Supply or Network components into the Taxes and Levies component.
5
The figure displays the most common policy support items. It does not aim to provide an exhaustive list.
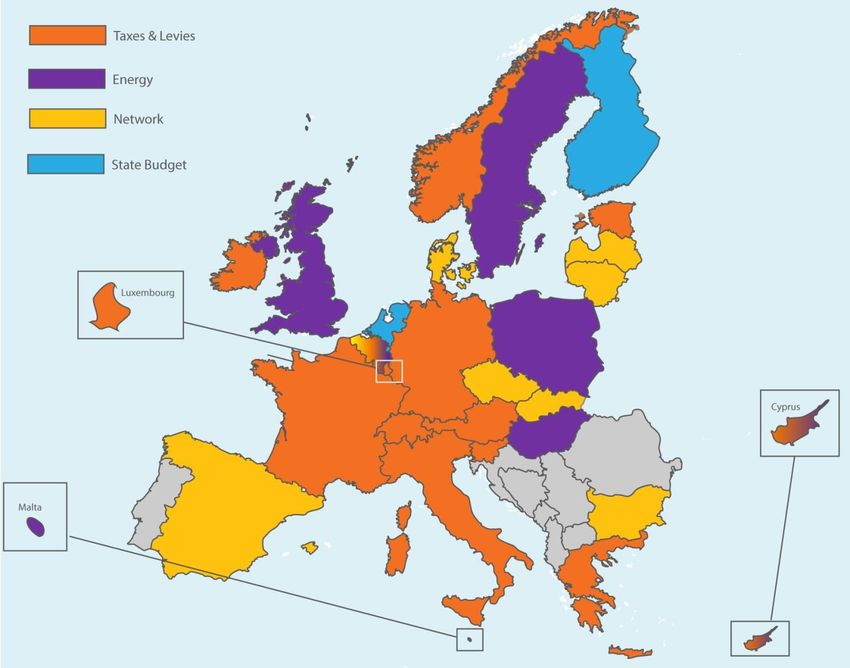
7Figure 2 illustrates in which component countries typically reported their policy support costs (levies) to
Eurostat in the period 2008-2012.6,7
8,9
Figure 2: National reporting to the EC
In order to eliminate the above mentioned distortions and provide a clearer picture of European power
price drivers EURELECTRIC has conducted its own analysis. The study is based on data provided by
EURELECTRIC national member associations.
6
The underlying study examines explicit costs and therefore does not capture the impact of the centrally provided
financial support. For further information on countries financing policy support costs from state budget please
consult country comments CZ1, FI1, NL1, LU1.
7
For changes in the accounting of policy support costs after the reporting period please see country comments AT1,
BG1, HU1.
8
For further information on the reporting of Cypriot policy supports costs and their implication for the
EURELECTRIC study, please consult country comment CY1.
9
For further information on the reporting of Belgian policy support costs and their implication for the
EURELECTRIC study, please consult country comment BE1.
8The following countries have answered the EURELECTRIC questionnaire: Austria, Belgium, Bulgaria,
Czech Republic, Cyprus, Denmark, Estonia Finland, France, Germany, Greece, Hungary, Ireland, Italy,
Latvia, Lithuania, Luxembourg, Malta, Netherlands, Poland, Norway, Slovakia, Slovenia, Spain, Sweden,
Switzerland, United Kingdom. Their aggregated power consumption accounts for 97% of the total EU-27
plus Norway and Switzerland consumption.
2. Identification of Price Increase Drivers
2.1 Industrial Price Components
Taxes & levies for industrial customers more than doubled. They accounted for €26.7/MWh in 2012
compared to €12.8/MWh in 2008. Throughout this period, the share of this component in the total
average price increased from 13% to 24% (+11p.p.), reflecting the change in the absolute cost.
The average network component for industrial customers increased by €3/MWh or 17%. The share of
the network component marginally increased from 20% to 21% (+1 p.p.).
The energy & supply component decreased by an average of €7/MWh or 10%. The share of this
component in the total price declined from 67% in 2008 to 55% in 2012 (-12 p.p.).
The regulated part of the bill– the sum of network tariff and taxes and levies – increased from 32% to
45% for industrial customers.
EUR/MWh
70
60 -10%
50
40
30 +109%
+17%
20
10
+17%
0
2008 2009 2010 2011 2012
Energy Network Taxes & Levies
Figure 3 Evolution of industrial price components in 2012
9EUR/MWh
120
100
80
60
40
20
0
2008 2009 2010 2011 2012
Taxes & Levies Network Energy
Figure 4 Share of industrial price components in 2012
The significant increase of the taxes & levies component, the slight increment of the network
component and the decrease of the energy & supply component led to a 11% increase on the total price
for industrial consumers.
2.2 Household Price Components
Taxes & levies for household consumers increased from €51/MWh to €67/MWh, a rise of 31%. The
share of this component in the total price increased from 29% to 34% in the period 2008-2012 (5 p.p.).
The network component increased by €4.5/MWh or 9%. The share of the Network component remained
constant accounting for roughly a quarter of the total average price.
The energy & supply component decreased also for household consumers both in absolute and relative
terms. In 2012 it was 4% lower than in 2008 as it decreased from €81/MWh to €77/MWh. In 2012 it
made up 40% of the total bill having experienced a 5 p.p. decrease.
For household consumers the energy & supply component decreased annually by 1%. The network
component increased by 2%, meanwhile the taxes & levies component rose by 6% annually.10 If these
10
Compound Average Growth Rate 2008-2012
10growth patterns are sustained over the period 2013-2014 taxes & levies in 2015 will cost the average
European household consumer more than energy & supply.
Overall household prices rose slightly slower than industrial prices, as they were 9% higher in 2012 than
in 200811.
EUR/MWh
85
80
-4%
75
70
65
+31%
60
55
50
+10%
45
40
2008 2009 2010 2011 2012
Energy Network Taxes & Levies
Figure 5 Evolution of average household price components
EUR/MWh
200
180
160
140
120
100
80
60
40
20
0
2008 2009 2010 2011 2012
Taxes & Levies Network Energy
Figure 6 Share of household price components
11
Household retail prices were regulated in 15 out of the 25 reporting countries at the end of the reporting period.
http://www.acer.europa.eu/Official_documents/Acts_of_the_Agency/Publication/ACER%20Market%20Monitoring
%20Report%202013.pdf
11EUR/MWh
350
300
250
200
150
100
50
0
Taxes & Levies Network Energy
Figure 7 Household price components by country in 2012
% of Total price
100% 5%
15% 13% 15% 15%
90% 23% 22%
29% 29% 30% 29% 24% 27% 27% 30% 29% 23% 29%
30% 33% 34% 30% 31% 37%
80% 46% 50%
70% 63%
60%
50%
40%
30%
20%
10%
0%
Taxes & Levies Network Energy
Figure 8 Share of household price components by country in 2012
122.3 European Commission vs. EURELECTRIC Price Components
The following figures provide a comparison of the European Commission (EC) and the EURELECTRIC
results for the taxes and levies component. For countries that report their PSCs in either the energy &
supply or the network component, the corresponding components of the EURELECTRIC analysis are
smaller than the EC component while the EURELECTRIC taxes and levies component is respectively
higher. In cases where countries report PSC as part of the taxes and levies component the EC and
EURELECTRIC data are identical.
2.3.1 Taxes and Levies Component
Figure 9 and 10 provide a comparison of the EC12 vs. EURELECTRIC results for the taxes & levies
component13,14:
EUR/MWh
50
40
30
20
10
0
EC EURELECTRIC
Figure 9 Distortion of the industrial taxes and levies component in 2012
12
The EC does not collect Swiss data.
13
Excluding VAT and other recoverable taxes and levies.
14
For further information on the damage of the Vasilikos power station on Cyprus and its implications to the level
of policy support costs, please consult country comment CY2.
13EUR/MWh
180
160
140
120
100
80
60
40
20
0
EC EURELECTRIC
Figure 10 Distortion of the household taxes and levies component in 2012
The EC data provides a distorted picture of all 14 countries that include their PSCs in the energy or
network component, resulting in the taxes & levies component being disproportionally low. The real
cost of taxes & levies for these countries, is displayed in the highlighted bars. EURELECTRIC data shows
that household taxes and levies amounted for 66.4 EUR/MMh on average, meanwhile the EC data
displays 56.2 EUR/MWh.
The average industrial and household taxes and levies components are respectively 27% and 18%
higher once policy support costs are allocated in a harmonised manner. The average distortion of the
industrial and household taxes and levies components across the concerned countries are at 767% and
59% respectively. The EC data is zero for the Maltese and Latvian industrial taxes and levies
components. In reality industrial consumers have to pay policy support costs (levies) in both countries.
142.3.2 Network Component
Figure 11 and 12 provide a comparison of the EC vs. EURELECTRIC results for the network component:15
EUR/MWh
60
50
40
30
20
10
0
EC EURELECTRIC
Figure 11 Distortion of the industrial network component in 2012
EUR/MWh
90
80
70
60
50
40
30
20
10
0
EC EURELECTRIC
Figure 12 Distortion of the household network component in 2012
15
For further information on concerns expressed by the Estonian EURELECTRIC member please consult country
comment EE1.
15The EC data provides a distorted picture of all 8 countries that include PSCs in their network component,
resulting in the network component being disproportionally high. The average distortion of the
industrial and household network components across the concerned countries are at 39% and 30%
respectively. In single cases, such as Spain, the distortion can be as high as 68%.
2.3.3 Energy & Supply Component
Figure 13 and 14 provide a comparison of the EC vs. EURELECTRIC results for the energy & supply
component16,17:
EUR/MWh
200
150
100
50
0
EC EURELECTRIC
Figure 13 Distortion of the industrial energy component in 2012
16
For further information on the level of the energy component in island systems, please consult country notes CY1
and MT1.
17
For more information on the Italian industrial energy component in 2012, please consult country comments IT1.
16EUR/MWh
200
150
100
50
0
EC EURELECTRIC
Figure 14 Distortion of the household energy component in 2012
The EC data provides a distorted picture of all 7 countries that include PSC in the energy & supply
component.
172.3.4 Implication for Countries that Report PSCs in Taxes & Levies
Figure 15 displays the impact of the inclusion of PSC on countries that report those in their taxes & levies
component. In almost every country this component is dominated by taxes, so that the inclusion of PSC
does not lead to differences between the EC and EURELECTRIC results that are as significant as for the
network or energy & supply component. However, with only one exception, every country that reports
its policy support costs in the taxes & levies component is ranked lower in the EURELECTRIC chart than
in the EC chart. While Germany ranks second in both charts, Italy (#3 to #5), Austria (#5 to #8), Norway
(#8 to #10), France ( #12 to #15), Slovenia (#13 to #19) Greece (#14 to #20), Ireland (#15 to #21),
Estonia (#18 to #22) and Luxembourg (#22 to #24) all have a lower taxes and levies component in
international benchmarking, when the harmonised taxes & levies components are displayed.
Figure 15 International comparison of the 2012 taxes and levies component in different reporting systems
183. Analysis of Price Increase Drivers
Chapter 2 showed that the taxes & levies component accounted for most of the increase in the total
average price. This chapter analyses the identified price increase driver in greater detail. It is exclusively
based on EURELECTRIC data.
Figure 16 Composition of taxes & levies
3.1 Policy Support Costs (Levies)
Policy support costs consist of a wide range of elements. Renewable energy sources (RES) and combined
heat and power (CHP) premiums are the most common charges.
Renewables support is levied on electricity bills in each reporting country for household customers and
with one exception to industrial consumers as well. 22 out of 27 countries have designated RES billing in
place, while 3 countries combine RES support with other cost elements.18 The Netherlands and Finland
imposed no levies.
CHP is explicitly levied in 16 countries for both consumer categories.
18
For further information on the Swiss policy support system and its implications for the Study, please
consult country comment CH1.
19A wide range of other policy support costs exists. They can include nuclear decommissioning, support
for vulnerable consumers, energy efficiency support, island systems compensation, tariff deficit
annuities, stranded cost and compensation fees, research funding, security of supply surcharges,
concession fees, offshore grid connection surcharges, coal decommissioning, pension funds and several
other items.19 The variety of other policy support costs does not allow the creation of any further sub-
categories. Policy support costs assigned to this category exist in 17 countries.
3.1.1 Industrial PSC
Industrial policy support costs grew by an average of 157% across all reporting countries, meaning that
their cost more than doubled between 2008 and 2012. In 2012 the average industrial levy was 21
€/MWh.20 At the beginning of the reporting period 22 countries billed quantifiable policy supports costs
to industrial consumers. By 2013 this number has grown to 26.
EUR/MWh
45
40
40 38
35
29
30 27
25 21 21 21
18 17 19
20
16
14
15 12
10 11
10 6
5 4 4 4
4 3 4
5 2
0 0.04 0
0
Average
Figure 17 Industrial PSC in 2012 by country
19
For further information on German policy support costs introduced after the reporting period, please consult
country comment DE1.
20
For further information on Austrian metadata on the level of industrial policy supports costs, please consult
country comment AT2.
203.1.2 Household PSC
Policy support costs for household consumers grew by 141% on average across all reporting countries.
In 2012 the average household policy support cost was €25/MWh. At the beginning of the reporting
period 22 countries billed quantifiable policy supports costs to household consumers. By 2013 this
number has grown to 26.
EUR/MWh 66
60
55
50
39
40
29
30
21 21
18 17 19 19
20 17
15
12 13
11 10 11
10 8
6 6 6
4 4
1 2
0 0
0
Average
Figure 18 Household PSC in 2012 by country
Across all reporting countries, every PSC that is imposed on household consumers is also imposed on
industrial consumers. There are no PSCs specifically levied to domestic or industrial consumers. The only
exception is Hungary where the RES PSC does not apply to industrial consumers.
The burden is shared equally between industrial and household consumers in 14 out of 2721 countries,
with the same PSC rates applied to both consumer categories. 13 countries apply different rates, 12 of
them impose a higher financial burden on household consumers (AT, CY, DE, ES, GR, HU, IE, IT, LU, MT,
PL, SI, UK).22 Italy is the only country that imposes higher PSCs to industrial compared to household
21
In terms of this study the burden sharing is equal also in Finland and in the Netherlands.
21consumers. Burden allocation of PSCs is more equal than the burden allocation of taxes as household
consumers face significantly higher tax obligations in almost every country. This is mostly resulting from
recoverable VAT and other exemptions for industrial consumers.
3.1.3 Breakdown of Household Policy Support Costs
Due to the fact that the consumption band 500 to 2000 MWh annual consumption is not a
representative band for energy intensive industries, the study provides a detailed analysis only of
household PSCs.
The average household RES levy in 2008 was €4.8/MWH. It increased to €15.8 /MWh by 2012. The share
of RES in the total average PSC value increased from 40% to 62% in the same period (+22 p.p.).
The average household CHP levy was €1.14/MWh in 2008. This amount increased to €1.73/MWh by
2012. The share of CHP in the total average levy across the reporting countries decreased from 9% to 7%
(-2 p.p.).
All other policy supports costs made up for 51% of the total average PSC in 2008, weighting €7.8/MWh
on household consumer bills. The share of these policy support costs in the total average PSC decreased.
from 51% to 31% (-20 p.p.). In absolute terms other policy support costs increased by 1.6 EUR/MWh.
Figure 19 Breakdown of Household PSC in 2012
223.2 Taxes
The most common imposed taxes are VAT and excise tax. VAT exists in every country and ranges from
5% in the United Kingdom to 27% in Hungary. Excise tax has been regulated at EU level since 2003 by
Council Directive 2003/96/EC. The legislation introduced a minimum excise tax level of €0.5/MWh for
business use and €1/MWh for non-business use.
3.2.1 Industrial Taxes
In several countries taxes imposed on industrial consumers are recoverable. Furthermore a significant
number of tax exemptions exist. It is to be noted that these exemptions apply mostly to larger
consumption bands23 and therefore most probably do not significantly impact a smaller consumption
band such as the chosen IC band. As no comprehensive list of tax exemptions exist, further analysis of
the current study focuses on taxes imposed on household consumers. 24
3.2.2 Household Taxes
Household excise taxes per megawatt hour ranged from €1 in Latvia to €108.3 in Denmark in 2012. In
the United Kingdom, Slovakia, Cyprus and Bulgaria household consumers were exempted. All tax data
are publicly available in the CIRCABC archives.25
A numerical verification method developed by EURELECTRIC shows that the role of other taxes is not
significant. Merely environmental or local taxes might exist, accounting for € 1-2/MWh26 on average
across the reporting countries.
23
Typically Eurostat’s consumption band ID und upwards.
24
For further information on the reduction of the industrial excise tax rate in Denmark after the reporting period,
please consult country comment DK1.
25
For further information on the Dutch excise tax rate, its statistical accounting and its implications on the Study,
please consult country comment NL2.
26
Includes all statistical differences and the costs of different voltage connection rates.
23Even though the cost of designated levies has been increasing since 2008, taxes still cost household
consumers 56% more than levies. Household consumers across the reporting countries paid €39/MWh
taxes and €25/MWh levies on average in 2012. This clearly shows that electricity bills do not equal
electricity prices. Significant state imposed add-ons turn electricity bills into carriers of various policies.
The following graph displays the absolute amount of taxes and policy support costs (levies) in each
country in 2012:
EUR/MWh
90 90
80 80
70 70
60 60
50 50
40 40
30 30
20 20
10 10
0 0
Taxes PSCs Average Tax Average PSC
27
Figure 20 PSC and tax levels in 2012 by country
27
Danish taxes totalled at 167.74 EUR/MWh in 2012
24EUR/MWh
108.3
100
80
59.4
60
42.3 42.7 41.7
39.5
40 33.7 37.1 35.4 35.5
33.1 31.7
29.2 27.2 28.6 28.7
25.0 23.8 25.7
20.5 22.1 23.7 22.0
18.7 17.0 17.7
20 15.0 15.9 16.3 16.3 14.213.0
9.7 8.7 9.1 8.5 8.8
4.5 4.6 3.1
1.2 0.0 0.0 1.1 1.5 2.2 1.9 1.0 1.0 1.0 1.0 1.5 0.0 0.0
0
VAT Excise Tax
28
Figure 21 VAT and excise tax rates in 2012
28
The sum of VAT, excise tax and PSC does not equal the total taxes and levies component. Depending on the
country and consumer category the total taxes and levies component might contain further taxes that are not
elaborated in this study.
25Annex 1 Methodology
EURELECTRIC surveyed its members for a detailed breakdown of policy support costs. Source
for total prices and price components (including total price and EC price components) was
Eurostat.
EURELECTRIC price components are based on Eurostat data. Differences between EURELECTRIC
and EC data result from the harmonised allocation of policy support costs. For the Eurostat
price component data used in the study please consult the Eurostat Data Base:
Industrial electricity price components: nrg_pc_205_c
Household electricity price components: nrg_pc_204_c
Total annual prices are computed as a sum of the three components. It is to be noted that total
prices based on the bi- annual Eurostat data (nrg_pc_204 and nrg_pc_205) differ from total
prices calculated as a sum of the components.
All values refer to the industrial consumption band IC (500-2000 MwH annual consumption)
and to the household consumption band DC29 (2500-5000 KwH annual consumption). For
further information please consult Eurostat metadata.
Aggregated average values computed for the responding countries are weighted averages. For
Eurostat consumption data used in the study please consult the Eurostat Data Base:
Final electricity consumption: nrg_105a
Industrial code: B_101800
Residential code: B_102010
No consumption data for the specific bands is available.
To the values of countries that reported levies in national currencies, a GDP deflator was
applied to (partially) eliminate the impact of exchange rates. GDP figures are available in the
World Bank database. ECB exchange rates were applied.
29
For further information on the representative validity of the chosen consumption band in certain countries, please
consult country comments NO1 and SE1.
26Levies are defined as policy support costs. EURELECTRIC acknowledges that excise tax on
electricity could be interpreted as an implicit policy support cost. Excise tax is considered a tax
in the current report.
Annex 2 Current Legal Framework of Electricity Price Statistics
Electricity statistics on the European level are governed by Regulation (EC) No 1099/2008, the
Council Directive 90/377/EEC with regard to the methodology to be applied for the collection of
gas and electricity prices charged to industrial end-users and of the Council of 22 October 2008
on Energy Statistics and Directive 2008/92/EC concerning a Community procedure to improve
the transparency of gas and electricity prices charged to industrial end-users. Directive
2008/92/EC determines only the list of taxes and levies that must be provided but does not
specify in which component they must be reported. Levies might fall under “other specific
costs”. This item represents costs which are neither network costs nor energy and supply costs
nor taxes. If this kind of costs exists, they are to be reported separately.
Whereas the first document contains no specific provisions on electricity prices Annex II of the
latter one sets the legal framework for reporting. As the title suggests, the legislation concerns
only industrial prices; no legal obligation exists for the reporting of household prices. Eurostat
currently covers close to 100% of the household sector due to voluntary data provision. The
legal umbrella is expected to be extended to household prices in the near future.
Directive 2008/92/EC determines two annual data collection processes. The first one covers the
period January- June of each year, while the second collection covers the period July-
December. This data is presented in the Eurostat data base as bi-annual data.
Each January reporting must be accompanied by information about the main average
characteristics and factors affecting the prices reported for each consumption band. Such
information must consist of the rates and method of calculation as well as a description of the
taxes levied on electricity sales to industrial end-users. The description must include any non-
tax levy covering system costs and public service obligations.
27Once a year, alongside the January price reporting, a breakdown of electricity prices into their
main components must be communicated to Eurostat.
EURELECTRIC acknowledges the indispensable and valuable work carried out by Eurostat as well
as the fact that Eurostat operates in a binding legal framework, set by the EU Member States.
Annex 3 Country Notes
Austria
AT1: in July 2012 Austria changed the national accounting of policy supports costs from the
energy to the network component.
AT2: Due to data availability and confidentiality reasons, the level of industrial policy support
cost is based on the exceptional consumption band of all industrial consumers with an annual
consumption up to 10,000 MWh.
Belgium
BE1: Belgium reports its policy support costs in all three components. Commodity related RES
and CHP support (50%) is reported in the energy component, system related RES support (23%)
is reported in the network component. Public service obligations and social bound policy
supports costs (27%) are reported in the taxes and levies component.
Bulgaria
BG1: Bulgaria includes policy supports costs in the energy component since August 2013 in its
national accounting.
Czech Republic
CZ1: CZ1: In the Czech Republic policy support costs are partially covered by the state budget.
For more information please visit Act No. 165 of 31 January 2012 on promoted energy sources
and on amendment to some laws.
28Cyprus
CY1: Main drivers for the high energy component on island Member States are high
dependency on liquid hydrocarbons and the isolation faced by these countries, which have to
manage the island’s cyclic demand by relying solely on their own power systems. This results in
their less efficient operation.
CY2: A consumption based temporary surcharge of 6.96% was introduced as of 1 October 2011.
The surcharge was imposed in order to cover the extensive damage that completely
interrupted Vassilikos power station’s operation as a result of an explosion at a nearby naval
base on 11 July 2011. The surcharge was reduced to 5.75% as of 1 August 2012. This surcharge
is reported in the energy component and was re- allocated into the taxes and levies component
in the scope of the EURELECTRIC study.
Denmark
DK1: The Danish industrial excise tax rate was lowered to the EU minimum level of €0.5/MWh
as of 2013. The Danish excise tax includes a CO2 element.
Estonia
EE1: The Estonian EURELECTRIC member expressed concerns regarding the levels of industrial
and household network components, noting that according to their calculations the industrial
network component should be consistently lower than the household network component.
Industrial €/ Domestic
€ / MWh
Consumption MWh Consumption
≤20 MWh 50.36 ≤ 1.0 MWh 51.60
20-500 MWh 39.30 1.0-2.5 MWh 49.98
500-2000
33.96 2.5-5.0 MWh 48.24
MWh
2000-20 000 5.0-15.0
27.73 45.60
MWh MWh
20 000-70
21.17 15,0 < MWh 3.,43
000 MWh
70 000-150
11.28
000 MWh
29Source: The Union of Electricity Industry of Estonia.
Finland
FI1: In Finland policy support costs are financed directly from the state budget and are not
levied on the electricity bill.
Germany
DE1: As of 2013 Germany introduced an offshore-wind farm levy to handle the risks related to
incoherent completion of the park itself and its connection to the grid (Offshore-
Haftungsumlage). As of 2014 Germany introduced a levy to co-finance payments for suppliers
of demand side management measures (Umlage für abschaltbare Lasten).
Hungary
HU1: Hungary includes CHP support in the taxes & levies component since July 2011 in its
national accounting.
Italy
IT1: The Italian EURELECTRIC member ASSOELETTRICA has expressed concerns regarding the
value of the 2012 industrial energy component.
Luxembourg
LU1: In Luxembourg policy support costs are partially covered by the state budget.
Malta
MT1: Main drivers for the high energy component on island Member States are high
dependency on liquid hydrocarbons and the isolation faced by these countries, which have to
manage the island’s cyclic demand by relying solely on their own power systems. This results in
their less efficient operation.
30Netherlands
NL1: In the Netherlands policy support costs are financed directly from the state budget and are
not levied on the electricity bill. The Netherlands has introduced a sustainable energy levy as of
2013. The levy is a part of the SDE+ mechanism.
NL2: In the Netherlands in 2012 the excise tax rate was €114/MWh. An automatic, fixed
amount refund, granted per connection and irrespective of consumption, eliminates tax
burdens for consumers below a threshold of consumption. The refund remained constant at
€318.62/year from 2010 to 2014. This refund accounts for the fact that the EURELECTRIC/EC
taxes & levies figures are smaller than the excise tax itself. For more information, please visit
Belastingdienst.nl.
Norway
NO1: As the annual consumption of the average Norwegian household is around 20,000 MWh
the consumption band DC is not representative. Nevertheless, the Norwegian EURELECTRIC
member considers the findings of the study valid.
Sweden
SE1: As the annual consumption of the average Swedish household is 8,000 MWh the
consumption band DC is not representative. Nevertheless, the Swedish EURELECTRIC member
considers the findings of the study valid.
Switzerland
CH1: The Swiss total policy support amount was constant from 2009 to 2012 and was increased
by 33% in 2013. A maximum of 5% of the total policy support amount can be utilised for energy
efficiency measures, a maximum of 0.1 Rp./KWh can be used for river re-naturalisation. The
total policy support must therefore consist of minimum 73% RES support. The study is based on
the maximum possible levels for energy efficiency and river re-naturalisation and the minimum
level for RES support.
31EURELECTRIC pursues in all its activities the application of
the following sustainable development values:
Economic Development
Growth, added-value, efficiency
Environmental Leadership
Commitment, innovation, pro-activeness
Social Responsibility
Transparency, ethics, accountabilityUnion of the Electricity Industry - EURELECTRIC aisbl Boulevard de l’Impératrice, 66 - bte 2 B - 1000 Brussels • Belgium Tel: + 32 2 515 10 00 • Fax: + 32 2 515 10 10 VAT: BE 0462 679 112 • www.eurelectric.org
You can also read