Three-dimensional fatigue crack propagation analysis of welded steel beam based on global-local numerical model
←
→
Page content transcription
If your browser does not render page correctly, please read the page content below

Zong and Shi Advances in Bridge Engineering               (2021) 2:4
https://doi.org/10.1186/s43251-020-00029-0
                                                                                                                                      Advances in
                                                                                                                                      Bridge Engineering

 ORIGINAL INNOVATION                                                                                                                              Open Access

Three-dimensional fatigue crack
propagation analysis of welded steel beam
based on global-local numerical model
Liang Zong1 and Gang Shi2*

* Correspondence: shigang@
tsinghua.edu.cn                           Abstract
2
 Key Laboratory of Civil Engineering
Safety and Durability of China            The existing fatigue assessment approaches were mainly conducted on the
Education Ministry, Department of         component level. The interaction of local component damage and the global
Civil Engineering, Tsinghua               response cannot be well addressed. In this study, three-dimensional (3D) fatigue
University, Beijing 100084, China
Full list of author information is        crack propagation analysis approach based on global-local numerical model was
available at the end of the article       implemented, and examined to be accurate and effective through a series of
                                          systematic experimental data obtained by Fisher. Afterwards, the approach was
                                          introduced into a typical steel truss bridge for realizing more refined fatigue
                                          assessment from the global structural level. The fatigue performance of the
                                          longitudinal steel welded beam in the steel truss bridge was investigated based on
                                          global-local model and local model respectively. It was found that there is no
                                          difference in terms of the fatigue crack growth mechanism between the simulation
                                          between global-local model and local model due to that the stress level of the
                                          whole structure is relatively low. At last, the effect of heavy haul train operation on
                                          the fatigue performance of the steel truss bridge was analyzed. It was observed that
                                          the residual life of the longitudinal steel welded beam would have an obvious
                                          reduction when the axle load was increasing. The research work in this study
                                          presents a technical solution for the fatigue assessment of the global structure and
                                          can provide beneficial reference for relevant practical engineering projects.
                                          Keywords: 3D fatigue crack propagation, Fatigue assessment, Welded steel beam,
                                          Global-local model, Heavy haul train, Fracture mechanics

                                        1 Introduction
                                        The fatigue strength of welded steel beam is the significant design criterion for many steel
                                        bridges. Extensive studies (e.g. Wilson 1948; Comeau and Kulak 1979) have been conducted
                                        to investigate the fatigue performance of welded steel beams, among which, Fisher et al.
                                        (1970, 1974) had carried out a comprehensive experimental examination on steel beam in
                                        the early 1970s. The relevant research results have led to the formation of the design S-N
                                        curve in many design codes such as AASHTO (1995) and Eurocode (BSI 2005a), which
                                        makes the fatigue design of welded steel beams much easier to operate. However, two issues
                                        will be triggered when dealing with an existing steel bridge. The first one is that it is difficult
                                        to estimate the residual fatigue life of the existing bridge, especially when the loading history
                                       © The Author(s). 2021 Open Access This article is licensed under a Creative Commons Attribution 4.0 International License, which
                                       permits use, sharing, adaptation, distribution and reproduction in any medium or format, as long as you give appropriate credit to the
                                       original author(s) and the source, provide a link to the Creative Commons licence, and indicate if changes were made. The images or
                                       other third party material in this article are included in the article's Creative Commons licence, unless indicated otherwise in a credit
                                       line to the material. If material is not included in the article's Creative Commons licence and your intended use is not permitted by
                                       statutory regulation or exceeds the permitted use, you will need to obtain permission directly from the copyright holder. To view a
                                       copy of this licence, visit http://creativecommons.org/licenses/by/4.0/.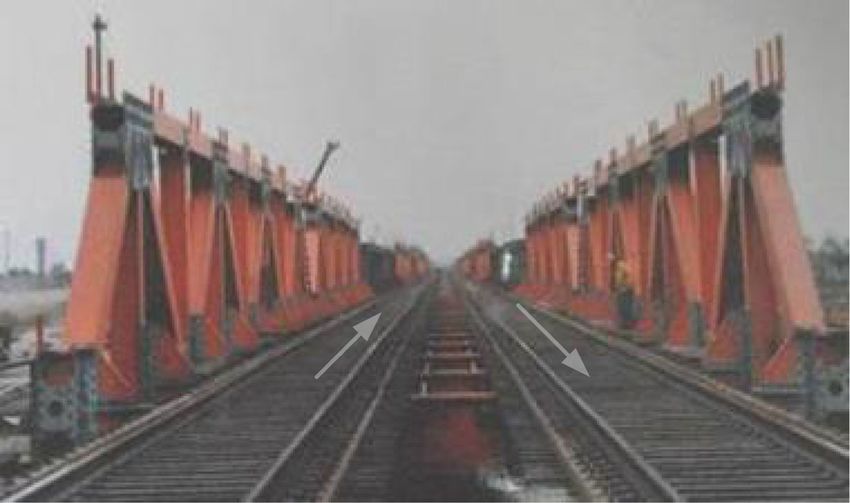
Zong and Shi Advances in Bridge Engineering   (2021) 2:4                                                          Page 2 of 17

                 of the bridge is unclear. This is a common disadvantage for the kind of S-N based fatigue
                 assessment approaches. The second one is that the interaction of local component damage
                 and the global response cannot be considered as almost all the investigations so far can only
                 focus on the component level with unchanged boundary conditions. Nevertheless, the global-
                 local interaction should be well addressed for an integrated structure system.
                   As early as in 1970, Fisher et al. (1970) pointed that Fracture Mechanics is a promis-
                 ing tool for improving fatigue evaluation. During the past five decades, a huge amount
                 of research (e.g Ibsø and Agerskov 1996; Barsoum 2008; Hobbacher 2009) have been
                 implemented to enhance the application of Fracture Mechanics based fatigue assess-
                 ment approach. It has been proved that Fracture Mechanics based approach combining
                 suitable site inspection data will work properly for structures which has already been
                 under service. It is worth mentioning that the loading history of the structure is un-
                 necessary and therefore the first issue above mentioned can be addressed. For the sec-
                 ond issue, it is a natural thought to consider the interaction of local damage and global
                 response through global-local numerical modelling (Zhou et al. 2016), which could pro-
                 duce satisfied accuracy and computation efficiency. Upon all the inspiring achievements
                 in the relevant field, the motivation of this work is activated. In the following study,
                 three-dimensional (3D) fatigue crack propagation analysis approach based on global-
                 local numerical model will be examined carefully. Then this approach will be employed
                 to estimate the residual life of welded steel beams in a practical steel truss railway
                 bridge on the basis of the global-local modelling.

                 2 Verification of 3D fatigue crack propagation analysis based on global-local
                 numerical model
                 From the view of Fracture Mechanics, the total fatigue life of steel structural details
                 generally consists of two parts, fatigue crack initiation life and fatigue crack propa-
                 gation life. For large scale engineering structures, especially for weldments, the
                 micro-defects are inevitable. Therefore, it is a common practice to take the fatigue
                 crack propagation life as the total fatigue life to produce a conservative prediction
                 (Zong et al. 2017a, b, c). The fatigue crack propagation analysis approach has been
                 through an enormous development until now, from only working properly on
                 Mode I crack with prescribed linear locus, to working perfectly on 3D mixed mode
                 crack along actual growth route. Nevertheless, all these analyses were usually
                 implemented based on refined finite element (FE) model with solid elements,
                 instead of global-local model with mixed element types, such as employing both
                 solid elements and beam elements. In this section, 3D fatigue crack propagation
                 analysis based on global-local numerical model is implemented and verified.
                   The analytic target herein is the plain welded steel beam tested by Fisher, as recorded in
                 NHCRP report 102 (Fisher et al. 1970). The loading scheme was four-point bending. In
                 terms of the global-local modelling, the pure bending segment was simulated by refined
                 solid elements and other segments are simulated by shell elements. The adjacent
                 segments were connected by ‘Shell-to-Solid Coupling’ interaction in ABAQUS (Hibbit
                 et al. 2004), as shown in Fig. 1. The geometric profile of the beam was set exactly accord-
                 ing to the original experimental report. The procedure of the 3D mixed mode fatigue
                 crack propagation analysis approach can be referred to Zong et al. (2017b) and would not
                 be illustrated in detail herein. The key issues that need to be clarified were the settings of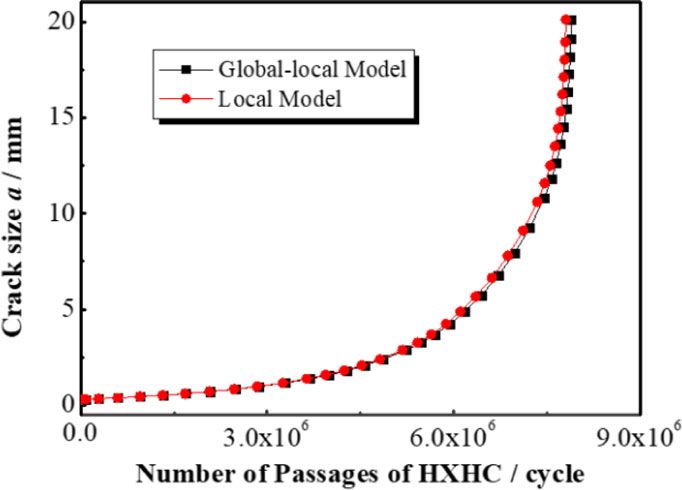
Zong and Shi Advances in Bridge Engineering         (2021) 2:4                                                       Page 3 of 17

                   Fig. 1 The global-local prototype for steel welded beam

                 initial crack and critical crack. In terms of the initial crack, it was found by Fisher that the
                 crack causing failure initiated in most cases at a flaw in the fillet weld at the flange-to-web
                 junction. This kind of flaw was usually an inescapable gas pocket. Therefore, an initial cir-
                 cular crack was chosen, of which the circle center was settled at the flange-to-web junc-
                 tion of the mid-span section of the beam in the global-local model. The initial size of the
                 circle crack was taken as 0.3 mm according to Ibsø and Agerskov (1996) and Zong et al.
                 (2017b) (Fig. 2c). In terms of the critical crack, it was found that most cracks would pene-
                 trate the flange plate and develop along the web. The average penetration size in the web
                 based on statistical analysis was about 40 mm, and this criterion was employed for the
                 determination of critical size (Fig. 2d).
                    Upon the settings of initial and critical fatigue crack, along with the fatigue crack growth
                 rate parameters in accordance with Paris Law calibrated by Fisher et al. (1970) (C=1.23×
                 10− 13, m=3 in terms of ‘N mm’ unit system), the fatigue crack propagation analysis can be car-
                 ried out utilizing Franc3D (2011) and ABAQUS. It should be noted that the analysis may
                 encounter a technical problem, that was the adaptive meshing by Franc3D will fail when the
                 intersection of the crack and the surface of the components occurred. Fortunately, the crack
                 front at every analysis step can be recorded and then inserted into the FE model manually.
                 For the fatigue assessment of the fillet welds at the flange-to-web junction, the intersection of
                 the crack front and the surface of the components usually occurred two times, leading to
                 three separate crack fronts finally, as shown in Fig. 3.
                    Considering the complete fatigue crack propagation process, the predicted fatigue
                 lives based on the global-local FE model is shown in Fig. 4. Thanks to Fisher’s

                   Fig. 2 The settings of initial and critical crack for the steel welded beam
Zong and Shi Advances in Bridge Engineering (2021) 2:4 Page 4 of 17
Fig. 3 The fatigue crack propagation analysis process for the steel welded beam
distinguished contribution, we have 55 effective fatigue life data for plain steel welded
beams, which are adequate for the verification of the simulated results. It can be
observed that a satisfying agreement is achieved between FE and experimental data,
which proves the effectiveness and accuracy of the 3D fatigue crack propagation
analysis based on the global-local model.
3 Background case
Owing to the verified 3D fatigue crack propagation analysis based on global-local
model, it is promising to introduce this approach into the fatigue evaluation of practical
engineering projects from the global structure level instead of component level. In this
section, a typical steel truss bridge, Beijing LuGou Railway Bridge, was taken as a case
project. The bridge was a two-way railway bridge, built in 1898. After 90 years, all the
steel trusses were replaced by totally new prefabricated steel truss beams. Therefore, it
can be regarded as a ‘new’ steel bridge and its life starts exactly from 1988, as shown in
Fig. 5. The new bridge is composed of 15 span simply supported beams with 31.68 m
span length. The steel grade is 16Mnq of which the yield strength is no less than 345
MPa. The design scheme of one representative span is shown in Fig. 6.
After the ‘New’ LuGou bridge was assembled in 1988, a systematic static load
test on site for the bridge was conducted to examine the design rationality and
construction quality (Beijing Railway Bureau 1988). The load was implemented by
steam locomotives of Qianjin model, whose axle load distribution is shown in
Fig. 7. There were two loading schemes in total, one was single-side loading with
Fig. 4 Comparison between the test data and the predicted fatigue lifeZong and Shi Advances in Bridge Engineering (2021) 2:4 Page 5 of 17
Fig. 5 ‘New’ LuGou Railway Bridge in 1988
one locomotive, and the other one was double-sides loading with two locomo-
tives. Each scheme was composed of six loading conditions according to the loca-
tion of the axle, as illustrated in Table 1. The deflection and stress of typical
members were carefully measured and recorded, which provided sufficient data
for verifying the numerical model.
Fig. 6 Design scheme of one span of LuGou BridgeZong and Shi Advances in Bridge Engineering (2021) 2:4 Page 6 of 17
Fig. 7 Axle load distribution of Qianjin model steam locomotive
Based on the geometric profile illustrated in the construction drawings of the steel
truss bridge, the FE model was established by ABAQUS, as shown in Fig. 8a. The verti-
cal web members locating in the midspan of top chord segment were almost not sub-
jected to stress and were simulated by beam element B31. Other parts of steel truss
bridge were modelled by shell element S4. The preloaded high strength bolt connec-
tions of the bracings and the gusset plates were assumed rigid and realized by the TIE
option, which was a surface-based constraint to make all Degree of freedoms (DOFs)
equal for a pair of surfaces (Zhou et al. 2013). The wood sleeper was modelled by solid
elements C3D8R and the rails were modelled by beam element B31. The rail pads that
fasten the rails to the sleepers were simulated by springs & dashpots between the
beams and the mass points, with stiffness Krp=500 MN/m and damping coefficient
Crp=200 kN·s/m (Zhou et al. 2013). The vertical bending stiffness of the rail is 6.4× 10⁶
N·m2 and the linear density is 60 kg/m (Zhou et al. 2013). Simply supported boundary
conditions were applied, where the longitudinal movement of one end was fixed and
the other end was released. Thanks to the detailed site inspection data, the feasibility of
the established FE model was verified through the comparison between the simulated
and measured data, as presented in Fig. 9.
Meanwhile, a comprehensive survey on the loading history of LuGou Bridge was carried
out by the authors. Generally, the loading history of the bridge can be divided into four
stages. A typical type of passenger train and freight train were chosen for each
stage (see Table 2). The distribution of the axle load of each train is shown in
Appendix. Then the structural response of the bridge under the passage of the
Table 1 The loading scheme of static test for LuGou Bridge
Location No. Loading Scheme 1 Loading Scheme 2 Location of the axle
1 Single side Double sides Wheel ⑥ located at E4 axis
2 Single side Double sides Wheel ⑤ located at E3 axis
3 Single side Double sides Wheel ④ located at E3 axis
4 Single side Double sides Wheel ② located at E4 axis
5 Single side Double sides Wheel ② located at E1 axis
6 Single side Double sides Wheel ⑪ located at E3 axisZong and Shi Advances in Bridge Engineering (2021) 2:4 Page 7 of 17
Fig. 8 Global-local model and local model of the bridge
typical trains can be calculated and analyzed accordingly with the employment of
the subroutine DLOAD (Hibbit et al. 2004).
For a steel truss bridge using friction type high strength bolted connections, its
fatigue resistance is relatively good, while, the fatigue performance of some structural
details should be paid attention, among which the longitudinal steel welded beam is a
noteworthy fatigue prone component. The fatigue failure mode of the beam under
bending moment was mainly located in the fillet welds of at the flange-to-web junction,
as examined by Fisher et al. (1970). According to Eurocode 3, the design S-N curve spe-
cified for the fillet welds of steel welded beam is FAT112, which means the fatigue
strength in terms of 2× 10⁶ cycles’ life is 112 MPa. Then the fatigue damage under a
typical train passage can be obtained based on Palmgren-Miner linear damage rule
Fig. 9 Comparison between the measured and simulated results in terms of the static inspectionZong and Shi Advances in Bridge Engineering (2021) 2:4 Page 8 of 17
Table 2 Loading history survey of LuGou Bridge
Stage Typical Passenger Train Typical Freight Train
Stage 1: 1988~1997
Transportation volume 20 pairs / day 30 pairs / day
Locomotive Beijing Model (Diesel) Jianshe Model (Steam)
Carriage marshalling 14 uniform carriages 50 open wagons (C50) and 10 box wagons (P65)
Train speed 50~60 km/h 20~30 km/h
Abbreviation label BJKC JSHC
Stage 2: 1997~2007
Transportation volume 5 pairs / day 50 pairs / day
Locomotive Dongfeng Four model Dongfeng Four model
Carriage marshalling 14 uniform carriages 50 open wagons (C60) and 10 box wagons (P65)
Train speed 60~70 km/h 50~60 km/h
Abbreviation label DFKC DFHC
Stage 3: 2007~2012
Transportation volume 3 pairs / day 50 pairs / day
Locomotive Shaoshan Four model Shaoshan Four model
Carriage marshalling 14 uniform carriages 50 open wagons (C62) and 10 box wagons (P65)
Train speed 60~70 km/h 50~60 km/h
Abbreviation label SSKC SSHC
Stage 4: 2012 till now
Transportation volume 11 pairs / day 20 pairs / day
Locomotive Harmony model Harmony model
Carriage marshalling 16 uniform carriages 50 open wagons (C64) and 10 box wagons (P65)
Train speed Less than 100 km/h Less than 60 km/h
Abbreviation label HXKC HXHC
(Fig. 10a and b) (Palmgren 1924; Miner 1945). Accordingly, the cumulative fatigue
damage until year 2015 can be calculated (Fig. 10c). It was observed that the maximum
fatigue damage occurs at the west of the axis line E1’EE1’ and the damage was up to
the order of 10− 2. What’s more, LuGou Bridge would be mainly used for freight trains
in the future and its residual life under possible heavy axle loads should be carefully
examined. In this study, we would refine the modelling of the longitudinal beam
between the axis line E1’EE1’ and E2’EE2’ with solid elements (Fig. 8a) and conduct its
fatigue life prediction in the whole structural model. Meanwhile, a refined local model
of the longitudinal beam (Fig. 8b) with fixed end boundary conditions was established
for contrastive study, to investigate the effect of global-local interaction on the fatigue
life of structural details.
4 Fatigue crack propagation analysis
4.1 Equivalent constant stress range
The 3D fatigue crack propagation analysis was difficult to be implemented under mov-
ing load input due to the caused variable stress range. Therefore, the first step of the
analysis was to transfer the variable stress range under moving load into an equivalentZong and Shi Advances in Bridge Engineering (2021) 2:4 Page 9 of 17
Fig. 10 Fatigue damage analysis of the longitudinal steel welded beam of LuGou Bridge. (Note: E means
east, W means west)
constant stress range. In this study, the equivalent crack extension principle was uti-
lized. Following this principle, the variable amplitude stress history generated by a sin-
gle train passage was treated as a typical stress block and the equivalent stress range
Δσeq was calculated based on the assumption of that, an equivalent crack extension was
produced by a single stress cycle of Δσeq and by several stress cycles due to one train
passage. The detailed description of the calculation procedure was given by Zhou et al.
(2016). The formulation of Δσeq can be written asZong and Shi Advances in Bridge Engineering (2021) 2:4 Page 10 of 17
" #1=m
Δa
Δσ eq ¼ pffiffiffiffiffiffim ð1Þ
C Y πa
where, Δa is the total crack extension size during one train passage; ā is the average
crack size estimated as ā=a0+Δa/2; C and m are the constant parameters in Paris Law;
Y is the geometric correction factor. Upon the assumption of the initial circular crack
for the fillet welds at the flange-to-web junction, the crack at the tensile flange side can
be regarded as an embedded circular flaw in a finite width plate subjected to tension, as
shown in Fig. 11. The solution of Y can be referred to BS7910 (BSI 2005b).
Then the equivalent stress range Δσeq in terms of a passage of each typical train can
be calculated, as shown in Table 3. For the refined local model, it is very easy to realize
the computed Δσeq input by applying a concentrated force at the mid-span of the beam.
For the global-local model, the axle load of the typical train needs to be magnified for
the input of Δσeq. However, the amplifying load will enlarge the stress of the other parts
of the global structure, which may lead to incorrect boundary conditions for the longi-
tudinal beam. Therefore, another equivalent principle is employed, that is the fatigue
damage under a passage of a typical train equals to the damage under neq times of
loading-unloading of the train at the most unfavorable axle distribution location for the
concerned details.
Accordingly, neq is given by
βs
Δσ eq
neq ¼ ð2Þ
Δσ max;s
where, Δσmax,s is the stress range caused by the loading-unloading of the train at the
most unfavorable axle distribution location for the concerned details; βs is the power
exponent of the relevant S-N curve and is taken as 3.0 herein. Take the typical train
HXHC as an example, the corresponding Δσeq is 46.69 MPa and Δσmax,s is 25.75 MPa,
then we can conclude that a passage of HXHC is equivalent to 5.96 times of loading-
unloading of HXHC at the most unfavorable axle distribution location.
Fig. 11 Geometric model for the assumption of embedded flaw under tensionZong and Shi Advances in Bridge Engineering (2021) 2:4 Page 11 of 17
Table 3 Equivalent stress range of one passage of each typical train
Typical train type BJKC QJHC DFKC DFHC SSKC SSHC HXKC HXHC
Δσeq / MPa 27.14 45.12 31.51 47.26 23.41 45.01 27.61 46.69
4.2 Comparison between the results obtained from the local and global-local model
Thanks to the equivalent stress range obtained in last section, the 3D fatigue crack
propagation analysis based on local model and global-local model can be carried out
respectively. The initial crack setting is exactly same with section 2, while, slight change
is made for the determination of the critical crack. Considering the design conserva-
tism, the critical crack is chosen as the size when the crack is about to fully penetrate
the flange plate, as shown in Fig. 12a. The fatigue crack growth parameters in terms of
Paris Law are determined according to Zong et al. (2015), that is, C and m are taken as
7.16e-12 and 2.57, respectively. Afterwards, the relationship between the stress intensity
factor range ΔK and the crack size a can be simulated. The a-ΔK data along the verti-
cal crack growth route as shown in Fig. 12a was employed for calculating the fatigue
crack propagation life. It can be observed that the a-ΔK relationship under HXHC train
based on global-local model and local model is almost same (Fig. 12b), if the ΔK based
on local model multiplies a reduction factor which is exactly the ratio of the stress
range in global-local model over that in local model (e.g. the factor is 25.75/46.69=0.55
for HXHC train). It is illustrated that there is no difference in terms of the fatigue crack
growth mechanism between the simulation between global-local model and local
model. This is mainly because that the stress level of the whole bridge structure is rela-
tively low, and the interaction between the local damage evolution and the global struc-
tural response is not obvious. It is hopefully to conclude with the suggestion that the
refined local model is accurate enough for fatigue assessment of a specific structural
detail, if the detail locates in an overall ‘elastic’ status.
Based on the simulated a-ΔK relationship, the fatigue crack propagation life can be
obtained through Runge-Kutta integration. Figure 13a provided a typical relationship
between crack size and life represented by the number of train passages. The figure
was established under the assumption that there was only one typical train, HXHC on
the target steel bridge. It can be observed, as illustrated before, the life prediction
results based on global-local model and local model completely matched. Afterwards,
Fig. 12 Simulated a-ΔK relationshipZong and Shi Advances in Bridge Engineering (2021) 2:4 Page 12 of 17
Fig. 13 Representative calculation results based on 3D propagation analysis
the fatigue crack propagation process of the longitudinal steel welded beam in the
bridge under the real loading history was reproduced. It should be noted that the pas-
senger trains and freight trains were under service concurrently during each stage of
the bridge’s loading history, while, it was assumed herein, for the sake of simplicity, that
the passenger trains passed the bridge firstly and then the freight trains came. As a
result, it can be found that the size of the embedded crack in the fillet welds of the lon-
gitudinal steel welded beam of the bridge only has a 0.145 mm growth from 1988 to
2015. Assume the bridge will be used for the freight transportation and only HXHC
will pass through the bridge in the future, the residual life is 6.44× 10⁶ cycles of train
passages.
4.3 Residual life prediction under future heavy loading wheels
With the rapid development of high-speed railways and the enhancement of the pas-
senger capacity, more and more existing railways are released for freight transportation,
as mentioned before. It has been presented the residual life of the bridge under the
condition that only HXHC train keep passing the bridge in the future. However, the
fact is probably more challenging due to the operation of more heavy loading wheels,
as the heavy haulage is one of the most effective approaches to improve the transport
efficiency and economic benefit. According to the survey of relevant authorities, two
types of freight train will probably be employed in the future, with the axle load as large
as to 27 tons and 30 tons respectively. The axle load distribution of the two heavy haul
trains are shown in Fig. 14.
Fig. 14 Axle load distribution of heavy haul trainZong and Shi Advances in Bridge Engineering (2021) 2:4 Page 13 of 17
Fig. 15 Stress response history under the passage of heavy haul trains
Thanks to the previous analysis, it could be stated that the LuGou bridge has an ex-
cellent fatigue resistant performance. However, the fatigue performance should be reas-
sessed if the bridge will bear heavy loading wheels. Based on the current arrangement
of HXHC, keep the haulage motor as the Harmony model, and replace all the traction
carriages by the two types of trains. Then a marshalling of freight trains with heavy
loading wheels is completed, which is utilized for the fatigue assessment of the bridge.
Figure 15 presents the stress response history of the target structural detail in the
bridge under one passage of 27 tons and 30 tons heavy haul train respectively. Then
the equivalent stress range is calculated accordingly, as shown in Table 4, and the fa-
tigue crack growth along with the increasing passages of the trains is simulated, as pre-
sented in Fig. 16. It can be clearly found that the residual fatigue life of the target detail
has a significant reduction along with the increasing of the axle load. The residual life
is only 48 years keeping bearing the passage of the 30 tons train. Therefore, it can be
concluded that the increasing of the axle load is totally challenging and it requires a
comprehensive, detailed and cautious technical examination and operation plan.
5 Conclusions
In this study, three-dimensional (3D) fatigue crack propagation analysis approach based
on global-local numerical model was implemented, examined and then introduced into
a typical steel truss bridge for realizing more refined fatigue assessment from the global
structural level. Key conclusions and suggestions according to the research work in this
study can be drawn:
(1) With the help of the abundant experimental data obtained by Fisher et al. (1970),
it was verified that the global-local FE model based fatigue crack propagation
Table 4 Equivalent stress range of each heavy haul train and corresponding residual life
Δσeq/ Fatigue life in terms of the number of train passages Fatigue life in terms of time /
MPa /cycle years
HXHC 46.69 6.85×10⁶ 235
6
27 58.73 3.78×10 129
tons
30 86.23 1.41×10⁶ 48
tonsZong and Shi Advances in Bridge Engineering (2021) 2:4 Page 14 of 17
Fig. 16 The fatigue crack growth process under heavy axle load
analysis can provide an effective and accurate prediction on the fatigue propagation
lives. This makes it feasible to conduct the fatigue evaluation from the structural
level instead of the component level.
(2) The fatigue performance of the longitudinal steel welded beam in a steel truss
bridge was investigated based on global-local model and local model respectively. It
was found that there is no difference in terms of the fatigue crack growth mechan-
ism between the simulation between global-local model and local model. It is hope-
fully to conclude with the suggestion that the refined local model is accurate
enough for fatigue assessment of a specific structural detail, if the detail locates in
an overall ‘elastic’ status.
(3) The effect of heavy haul train operation on the fatigue performance of the steel
truss bridge was analyzed. It was observed that the residual life of the longitudinal
steel welded beam would have an obvious reduction when the axle load was
increasing. It is recommended that a comprehensive, detailed and cautious
technical examination and regular recondition plan should be made when the
heavier axle load is employed.
(4) The global-local interaction in terms of the fatigue assessment of the structure is
still an issue that should be paid enough attention. This study only introduces the
fatigue damage in one specific location and the stress level of the whole structure
is relatively low. However, the global-local interaction effect should be further in-
vestigated when the stress level of the structure increases and multiple fatigue
damage occurs in various structural details of the structure.
6 Appendix
(a) Passenger train in Stage 1: BJKCZong and Shi Advances in Bridge Engineering (2021) 2:4 Page 15 of 17
(b) Freight train in Stage 1: JSHC
(c) Passenger train in Stage 2: DFKC
(d) Freight train in Stage 2: DFHC
(e) Passenger train in Stage 3: SSKC
(f) Freight train in Stage 3: SSHCZong and Shi Advances in Bridge Engineering (2021) 2:4 Page 16 of 17
(g) Passenger train in Stage 4: HXKC
(h) Freight train in Stage 4: HXHC
Abbreviations
FE: Finite element; DOF: Degree of freedom; AASHTO: American Association of State Highway and Transportation
Officials; FAT x: Fatigue strength in terms of 2× 10⁶ cycles’ life is x MPa
Acknowledgements
The kind support on the permission to use Franc3D from Mr. Li Mengguang in MVT GROUP INC. is greatly appreciated.
Authors’ contributions
Liang Zong: Conceptualization, Methodology, Analysis, Writing - Original Draft. Gang Shi: Supervision,
Conceptualization, Methodology. The author(s) read and approved the final manuscript.
Funding
The writers gratefully acknowledge the support for this work, which was sponsored by the National Natural Science
Foundation of China (No.51608359) and the open fund of State Key Laboratory of Subtropical Building Science
(2018ZB24).
Availability of data and materials
The datasets used and analyzed during the current study are available from the corresponding author on reasonable
request.
Competing interests
The authors declare that they have no competing interests.
Author details
1
School of Civil Engineering, Tianjin University/ Key Laboratory of Coast Civil Engineering Structures Safety (Tianjin
University), Ministry of Education, Tianjin 300072, China. 2Key Laboratory of Civil Engineering Safety and Durability of
China Education Ministry, Department of Civil Engineering, Tsinghua University, Beijing 100084, China.
Received: 28 November 2020 Accepted: 21 December 2020
References
American Association of State Highway and Transportation Officials (1995) LRFD bridge design specifications, 3rd edn. AASH
TO, Washington, DC
Barsoum Z (2008) Residual stress analysis and fatigue assessment of welded steel structures. Ph.D. dissertation. Royal Institute
of Technology (KTH), Stockholm
Beijing Railway Bureau (BJRB) (1988) Static test report on LuGou steel bridge, Beijing
British Standards Institution (2005a) Eurocode 3: design of steel structures. British Standards Institution, London
British Standards Institution (2005b) BS 7910. Guide to methods for assessing the acceptability of flaws in metallic structures.
British Standards Institution, London
Comeau MP, Kulak GL (1979) Fatigue strength of welded steel elements. Structural engineering report 79. University of
Alberta, Canada
Fisher JW, Albrecht P, Yen BT, Klingerman DJ, McNamee BM (1974) Fatigue strength of steel beams with welded stiffeners
and attachments. NCHRP report 147. Transportation Research Board, National Research Council, Washington, DC
Fisher JW, Frank KH, Hirt MA, McNamee BM (1970) Effect of weldments on the fatigue strength of steel beams, NCHRP report
102. Transportation Research Board, National Research Council, Washington, DC
Franc3D (2011) Reference manual for version 6. Fracture Analysis Consultants Inc. Retrieved from http://www.franc3d.com/.
Hibbit D, Karlsson B, Sorenson P (2004) ABAQUS analysis user’s manual, version 6.5. Hibbit, Karlsson & Sorenson Inc., USA
Hobbacher AF (2009) The new IIW recommendations for fatigue assessment of welded joints and components - a
comprehensive code recently updated. Int J Fatigue 31(1):50–58
Ibsø JB, Agerskov H (1996) An analytical model for fatigue life prediction based on fracture mechanics and crack closure. J
Constr Steel Res 37(3):229–261
Miner MA (1945) Cumulative fatigue damage. J Appl Mech 12(3):A159–A164
Palmgren A (1924) Die lebensdauer von kugellagern. Zeitschrift des Vereinesdeutscher Ingenierure 68(14):339–341
Wilson WM (1948) Flexural fatigue strength of steel beams; a report of an investigation conducted by the Engineering
Experiment Station, University of IllinoisZong and Shi Advances in Bridge Engineering (2021) 2:4 Page 17 of 17
Zhou H, Liu K, Shi G, Wang YQ, Shi YJ, DeRoeck G (2013) Fatigue assessment of a composite railway bridge for high speed
trains. Part I: modeling and fatigue critical details. J Constr Steel Res 82:234–245
Zhou H, Shi G, Wang Y, Chen H, DeRoeck G (2016) Fatigue evaluation of a composite railway bridge based on fracture
mechanics through global–local dynamic analysis. J Constr Steel Res 122:1–13
Zong L, Shi G, Wang Y (2015) Experimental investigation on fatigue crack behavior of bridge steel Q345qD base metal and
butt weld. Mater Des (1980-2015) 66:196–208
Zong L, Shi G, Wang YQ, Li ZX, Ding Y (2017c) Experimental and numerical investigation on fatigue performance of non-
load-carrying fillet welded joints. J Constr Steel Res 130:193–201
Zong L, Shi G, Wang YQ, Yan JB, Ding Y (2017b) Investigation on fatigue behaviour of load-carrying fillet welded joints based
on mix-mode crack propagation analysis. Arch Civ Mech Eng 17(3):677–686
Zong L, Shi G, Wang YQ, Zhou H (2017a) Fatigue assessment on butt welded splices in plates of different thicknesses. J
Constr Steel Res 129:93–100
Publisher’s Note
Springer Nature remains neutral with regard to jurisdictional claims in published maps and institutional affiliations.You can also read