Weekly statistics for NHS Test and Trace (England): 2 September to 8 September 2021 - Department of Health and Social Care Statistical ...
←
→
Page content transcription
If your browser does not render page correctly, please read the page content below
Department of Health and Social Care Statistical Bulletinv0-00

Weekly statistics for NHS Test and Trace
(England): 2 September to 8 September
2021

                                            1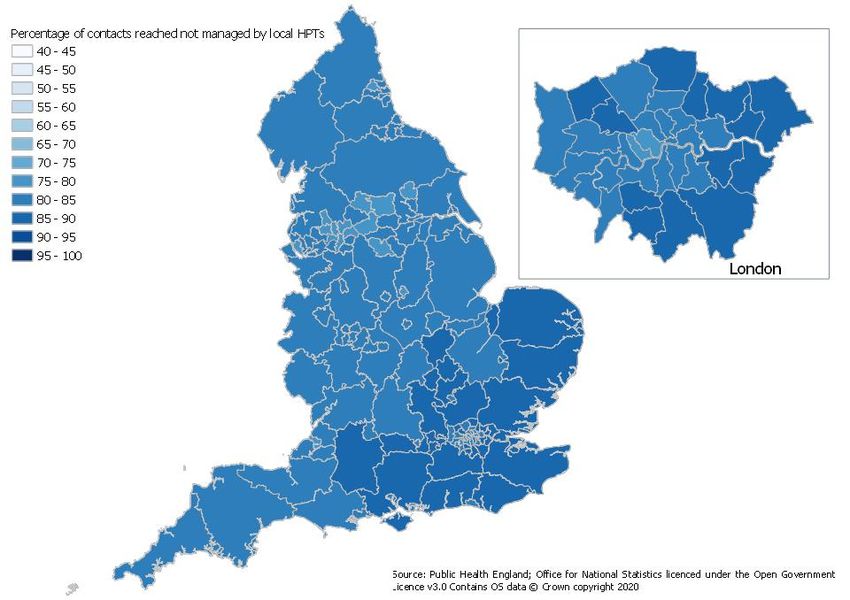
Main points
People tested, England

    •    205,679 people tested positive for coronavirus (COVID-19) at least 1 between 2
         September and 8 September 2021, a 7% increase compared on the previous week.

    •    6,294,969 people were tested at least once between 2 September and 8
         September 2021 for COVID-19, a 29% increase on the previous week.

Pillar 2 testing turnaround times, England

    •    Turnaround times for pillar 2 (virus testing for the wider population) for all in-person
         testing routes have increased overall since the week ending 7 July 2021. In the
         most recent week, 81.0% of in-person tests were received within 24 hours, an
         increase from 80.0% in the previous week.

    •    Since the previous reporting week, the median turnaround time for home tests has
         increased from 41 hours to 43 hours. The turnaround time for satellite tests has
         increased from 34 hours to 38 hours.

Distance to in-person testing sites for booked PCR tests, pillar 2, England

    •    In the latest week, the median distance to in-person testing sites (pillar 2) for
         booked PCR tests has remained the same at 2.3 miles. The median distance has
         been constant since the week ending 4 August 2021.

Positive cases transferred to NHS Test and Trace

    •    199,423 cases were transferred to the contact tracing system between 2 September
         and 8 September 2021, an increase of 19.6% on the previous week.

    •    Of the cases transferred to the contact tracing system between 2 September and 8
         September 2021, 86.3% were reached and asked to provide information about their
         recent close contacts. This is a decrease from the 87.6% observed in the previous
         week.

1 Deduplicated for the reporting week. For information on how the number of people are tested and tested positive in a
reporting week is measured see the NHS Test and Trace statistics methodology.
                                                           2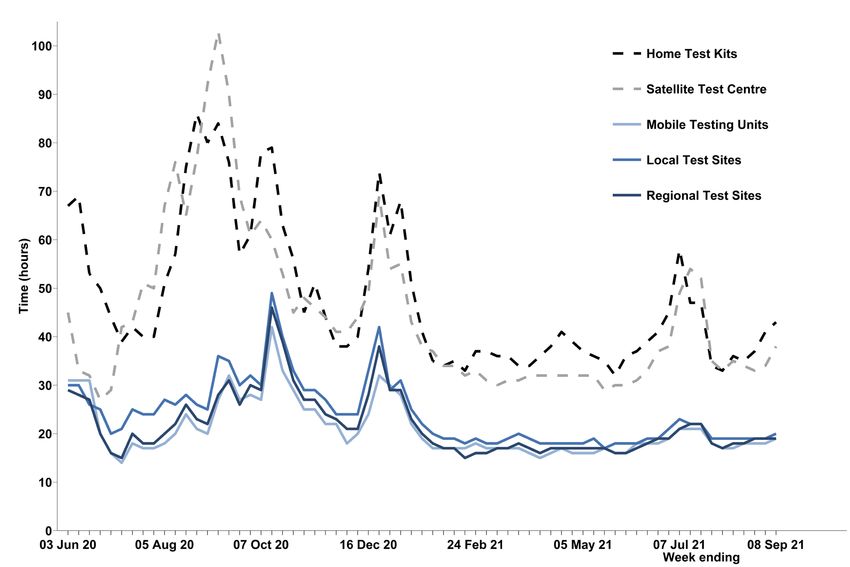
Close contacts identified by NHS Test and Trace

    •   Between 2 September and 8 September, 503,135 people 2 were identified as
        coming into close contact with someone who had tested positive. The number of
        close contacts identified has increased by 21% from the previous week.

    •   For those where communication details were available, 90.1% of close contacts
        were reached and told to self-isolate in the most recent week. Considering all
        contacts identified, 91% were reached in the most recent week.

Managed quarantine service (MQS)

    •   In the latest week, 361,396 people started quarantining at home, a fall of 12.1%
        from the previous week, and 7,967 people started quarantining in a managed
        quarantine hotel, an 18.6% increase on the previous week. 3

    •   Since the MQS launched on 15 February 2021, 4,019,180 people have started
        quarantining at home or in a managed quarantine hotel.

Test and Trace Support Payment scheme (TTSP)

    •   As of 8 September 2021, records indicate that local authorities have paid £143.6
        million to 287,102 applicants.

    •   Over the previous week, local authorities reported payments of £5.1 million to
        10,295 applicants.

    •   In the last week, discretionary payments made up 54.3% of all TTSP.

2
  The number of people identified includes duplicates as an individual may be named as a close contact for
more than one case. See the methodology for more information.
3
  Figures for non-red listed arrivals do not include international arrivals who book their PCR tests via a
private provider. See the methodology for more information.

                                                     3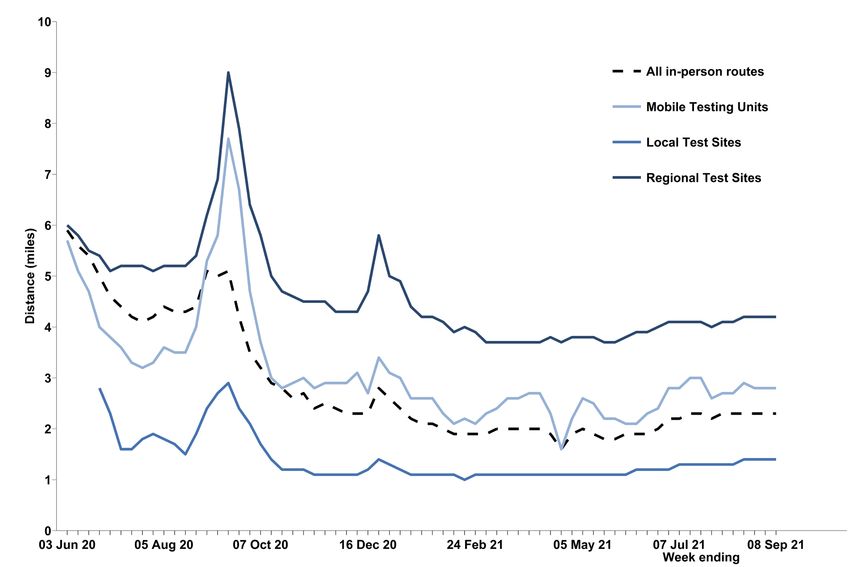
Introduction
The Department for Health and Social Care publishes weekly statistics on NHS Test and
Trace (England) across all 4 testing pillars. The purpose of this publication is to provide a
weekly update on the implementation and performance of NHS Test and Trace in
England.
For NHS Test and Trace (England), this includes:
Testing
   • people tested for COVID-19
   • people testing positive for COVID-19
   • time taken for test results to become available
   • distance to in-person test sites for booked PCR tests

Contact tracing
  • people transferred to the contact tracing system, and the time taken for them to be
      reached
  • close contacts identified, and the time taken for them to be reached

Managed quarantine service
  • people quarantining at home or in a managed quarantine hotel
  • number of PCR tests processed and how many of these were positive, by
     international arrivals quarantining at home or in a managed quarantine hotel

Test and Trace Support Payments
   • Number of payments and amount paid for successful TTSP claims, by week and
      local authority.

Publication updates

Total LFD tests conducted may be under reported in the most recent week as a minor data
quality issue has been discovered affecting around 1% of tests. Work is underway to
ensure this is resolved when new figures are released next week.

Data collected for NHS Test and Trace is primarily for operational purposes and was not
designed to track the spread of the virus. Studies into the spread of the virus in the UK are
carried out by the Office for National Statistics (ONS). Further guidance can be found in
comparing methods used in the COVID-19 Infection Survey and NHS Test and Trace,
England.

                                              4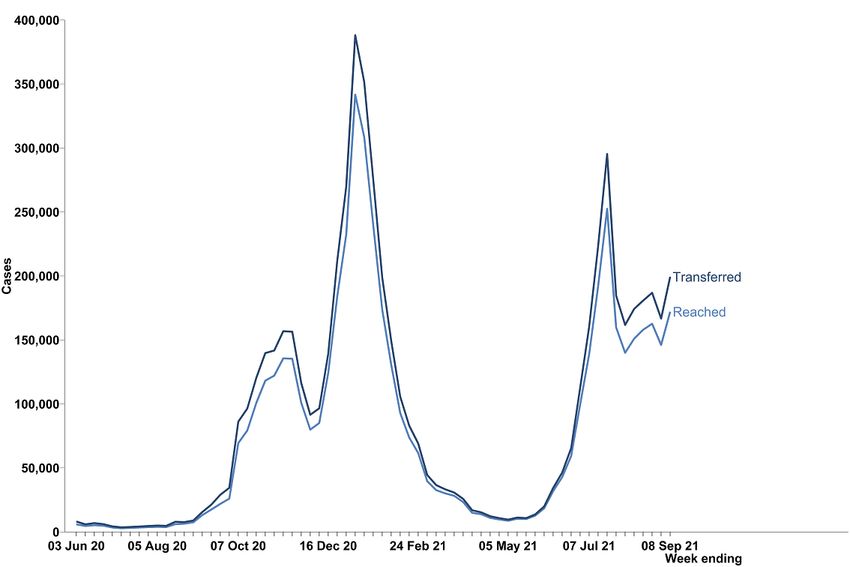
A list of data sources relating to the coronavirus pandemic in the UK can be found at
coronavirus (COVID-19) statistics and analysis. A breakdown of all available testing and
contact tracing data in the UK can be found at Testing and contact tracing in the UK:
summary of data.

All data used in the report can be found in the NHS Test and data tables on the weekly
collection page. A full explanation of the data sources and methods used to produce these
statistics can be found in the additional methodology document for NHS Test and Trace
statistics.

Data and methodology for the NHS COVID-19 app is available on the NHS COVID-19 app
support website.

This release includes new statistics on TTSP: the reported amount paid to eligible
applicants and the reported number of successful claims (Table 22) and the breakdown by
lower-tier local authorities in England (Table 23).

Revisions to figures previously published
Figures given in previous releases are routinely revised each week going back to the start
of Test and Trace for people tested for COVID-19, people testing positive for COVID-19,
pillar 2 testing turnaround times, distance to in-person PCR test sites and contact tracing,
to the start of the managed quarantine service for people quarantining at home or in a
managed quarantine hotel, and to 15 February 2021 for number of PCR tests taken by
international arrivals quarantining at home or in a managed quarantine hotel. The figures
presented are based on a data cut several days after the end of the reporting period. This
is to give time for data relating to the end of the 7-day period to be collected. Some data
may continue to be collected after this period, and therefore may need to be revised over
time.

Figures for pillar 1 testing turnaround times are not routinely revised as only minor
changes occur to past weeks post-publication. Figures are only revised when substantial
changes occur. More detail on routine revisions is given in the quality section.

Note that these routine revisions to data includes the local authority level contact tracing
data that is made available on the weekly collection page. As past data is revised,
subtracting figures given in the previous week from figures given in the current week will
not give the total number of cases for that week.
                                              5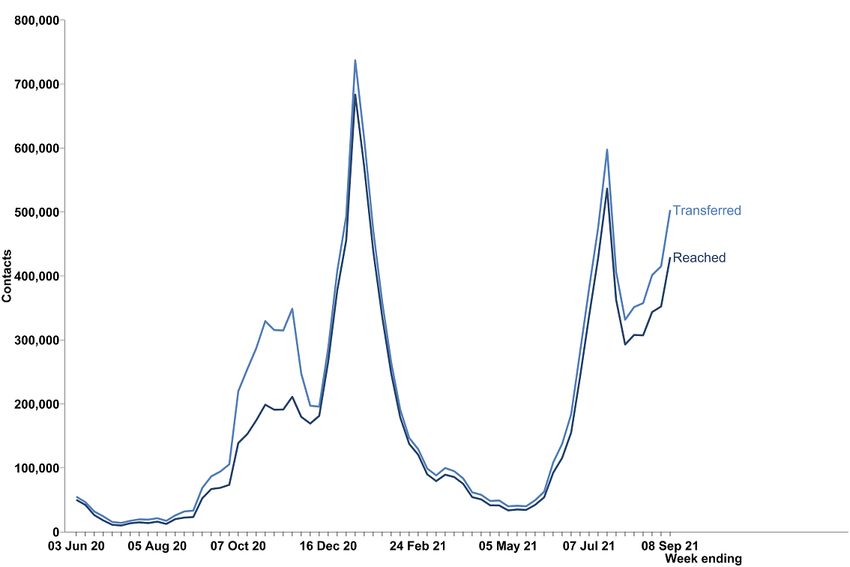
For the release on 19 August 2021, the number of people starting their quarantine at home
has been revised. This is due to the introduction of private provider provision of amber fully
vaccinated services on 19 July 2021. This data can be found in Table 19 of the
accompanying data tables.

                                              6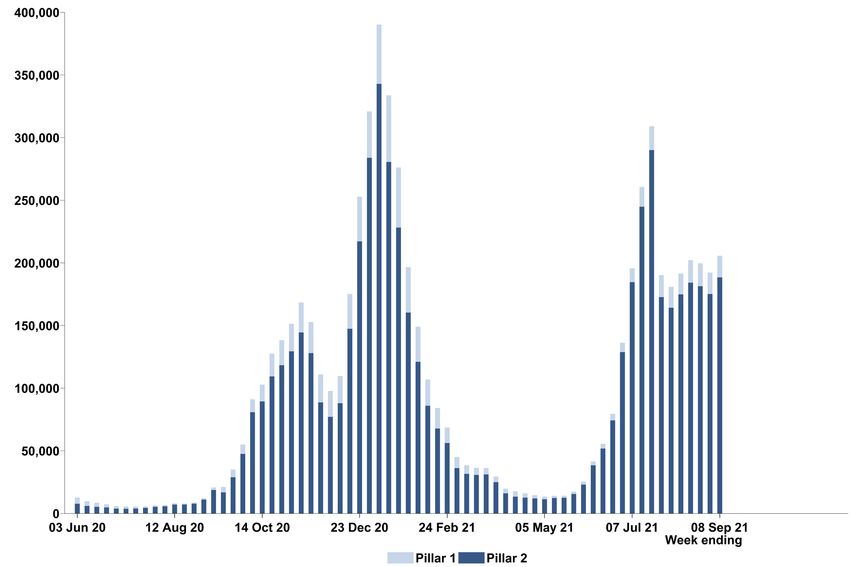
1. NHS Test and Trace
NHS Test and Trace was launched in England on 28 May 2020 and ensures that anyone
who develops symptoms of coronavirus (COVID-19) can quickly be tested to find out if
they have the virus. It then helps trace recent close contacts of anyone who tests positive
for COVID-19 and, if necessary, notifies them that they must self-isolate at home to help
stop the spread of the virus. The flow of how people move through the NHS Test and
Trace service is shown in Figure 1. More information about NHS Test and Trace can be
found at NHS Test and Trace: how it works.

1.1 Testing in England
NHS Test and Trace starts with an individual taking a swab test for the virus, either in pillar
1 (testing in hospitals and outbreak locations), pillar 2 (national swab testing) or pillar 4
(prevalence studies). Those who go on to test positive will have their case transferred to
NHS Test and Trace for contact tracing.

From 30 March, individuals who test positive from an LFD test are asked to take a
confirmatory PCR test. A positive LFD result will continue to trigger contact tracing;
however, NHS Test and Trace has introduced improvements to automatically inform
anyone self-isolating from a positive LFD to stop isolating if the confirmatory PCR is taken
promptly and is negative. These individuals will then be removed from the contact tracing
process.

NHS Test and Trace is for England only, therefore the figures in this section are given for
England. Weekly figures for UK testing are available to download from the weekly
collection page and are also available daily on the coronavirus in the UK dashboard.
Information on contact tracing in Scotland, Wales and Northern Ireland can be found
directly from Public Health Scotland, the Welsh government and the Northern Ireland
Public Health Agency.

                                              7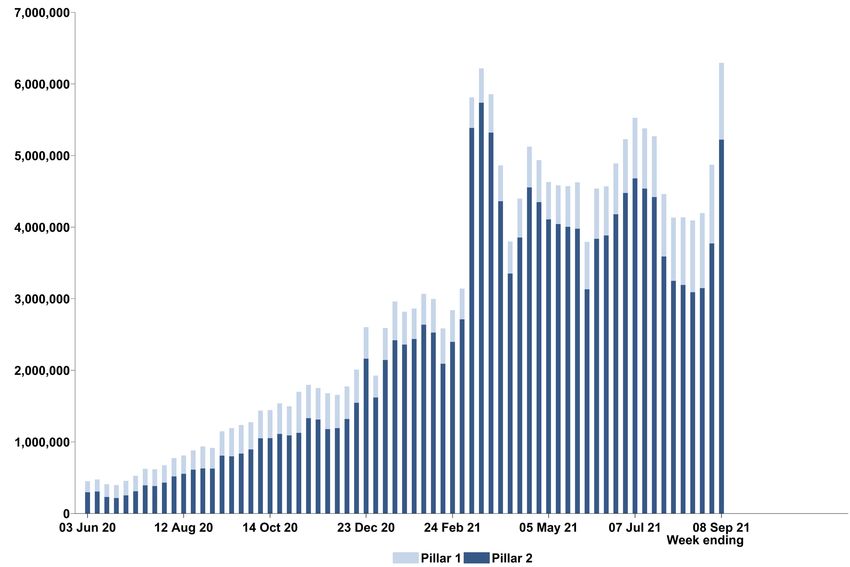
Department of Health and Social Care Statistical Bulletinv0-00

Figure 1: flowchart showing how people move through NHS Test and Trace

                                                                 8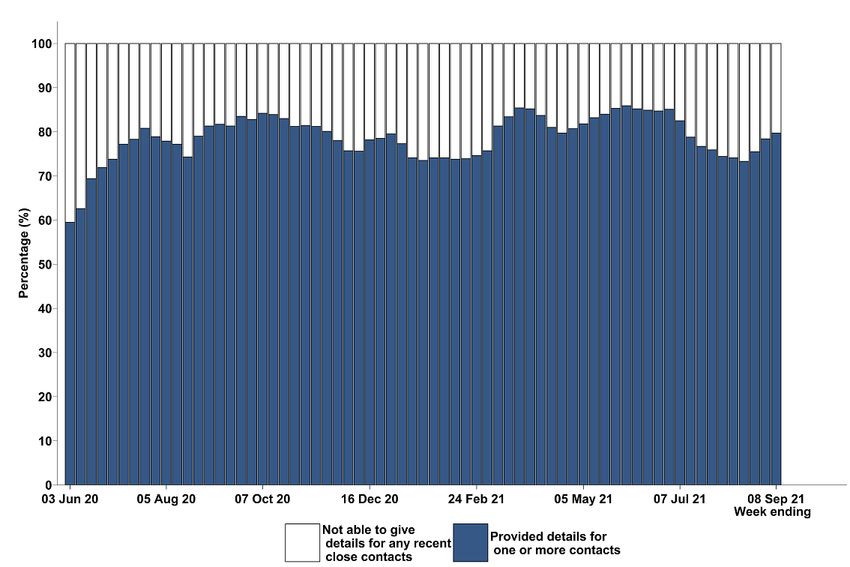
Department of Health and Social Care Statistical Bulletin

Figure 1 shows the journey a person can take through NHS Test and Trace. This can start
with either an LFD COVID-19 test or a PCR COVID-19 test.

For those taking LFD tests, they can collect their test from their workplace, place of
education, pharmacy or local/mobile test site. They can also order an LFD test to be
delivered to their home. All people who test positive from an LFD are transferred to
contact tracing, however if their confirmatory PCR test result is negative, they and their
contacts are removed from contact tracing.

All those testing positive from an LFD test are instructed to take a confirmatory PCR test.
In addition, symptomatic individuals and some other use cases can directly book a PCR
test without taking an LFD test first. PCR tests may also be taken in hospital or outbreak
locations or as part of a prevalence study. Booked PCR tests can either be conducted at a
regional test site, local test site or mobile test unit; or a satellite or home test can be
conducted. After tests have been taken, they are sent to a laboratory for processing. Once
processed, a person will be emailed or texted their result.

If a person has a positive COVID-19 test result, then their case is transferred to NHS Test
and Trace and can be managed in one of 2 ways. First, cases that are not managed by
local health protection teams (HPTs) are reached either online or by a call centre. They
are then asked to provide details of recent close contacts. These recent close contacts are
then reached by NHS Test and Trace and advised to self-isolate. Second, cases that are
linked to certain exposure settings are escalated to local HPTs who work to identify and
reach recent close contacts and advise them to self-isolate.

Additionally, if the person has the app and used the app to book their test, their positive
result is updated automatically. If they have the app but booked their test via a different
route, then they can use a link to add their positive result to the app. Once their positive
result is entered into the app, the person is asked if they are willing to share their data and
if they say yes, the app identifies other app users who have been in close contact with the
person who has tested positive. Close contacts then receive an app notification to self-
isolate.

                                               9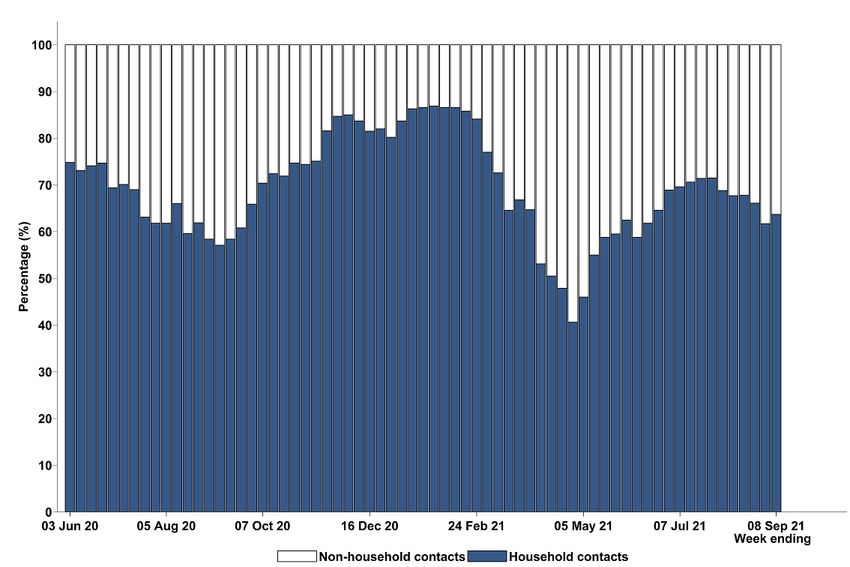
Department of Health and Social Care Statistical Bulletin

People tested and people testing positive, England
The headline figures reported in this publication for people tested and people testing
positive include both lateral flow device (LFD) tests and polymerase chain reaction (PCR)
tests, deduplicated for each reporting week. 4 Information on the differences between these
types of tests can be found in the methodology document for NHS Test and Trace
statistics.

From 7 January 2021, positivity rate is not calculated as part of this publication but can
instead be found on the coronavirus in the UK dashboard for PCR only positive cases in
England. This is because the figures in this publication include both PCR and LFD tests
and it is likely that LFD tests have a different positivity rate to PCR tests due to the use of
LFDs in rapid testing. As the number of LFD tests conducted is increasing over time, a
consistent positivity rate cannot be calculated using these figures.

A statistical commentary on rapid testing in England along with data tables for the number
of tests conducted, broken down for LFD and PCR tests, is available on the weekly
collection page.

The number of people tested and number of people testing positive via PCR tests in each
reporting week, by age, gender and local authority is also available on the weekly
collection page.

Between 2 September and 8 September 2021, 6,294,969 people were
tested for coronavirus (COVID-19) at least once, 5 a 29% increase on the
previous week.

The large increases and decreases in people tested since 8 March 2021 are due to the
regular testing of students at schools using rapid tests. These increases and decreases
align with the school calendar, with drops during holiday periods and subsequent
increases when students return to school.
For more information on rapid testing in schools, see the rapid testing commentary
available on the weekly collection page.

4
  Figures also include a small number of people tested using LAMP tests. See NHS Test and Trace statistics
methodology for more information.
5 Deduplicated for the reporting week, methodology was revised from 15 October 2020. See NHS Test and Trace

statistics methodology for more information.

                                                       10
Department of Health and Social Care Statistical Bulletin
Since Test and Trace launched at the end of May 2020, 40,149,978 people have been
tested at least once 6.
Figure 2: number of people tested for COVID-19 in each reporting week by pillar, England
This data can be found in the ‘table_1’ tab of the ‘NHS Test and Trace Statistics 28 May 2020 to 8
September 2021: data tables’ on the weekly collection page.
Between 2 September and 8 September 2021, 205,679 people tested
positive 7, 7% higher than the previous week.
The number of positive cases has risen week-on-week for the first time since the week
ending 18 August.
6
Deduplicated since testing began and the end of the most recent reporting week. People tested multiple times in this
time period will only be counted once. See NHS Test and Trace statistics methodology for more information.
7 Deduplicated for the reporting week. See NHS Test and Trace statistics methodology for more information.
11Department of Health and Social Care Statistical Bulletin
Figure 3: number of people testing positive for COVID-19 in each reporting week by pillar,
England
This data can be found in the ‘table_1’ tab of the ‘NHS Test and Trace statistics 28 May 2020 to 8
September 2021: data tables’ on weekly collection page.
12Department of Health and Social Care Statistical Bulletin
Pillar 1 testing turnaround times, England
Pillar 1 testing refers to swab testing for the virus in Public Health England (PHE) labs,
NHS hospitals for those with a clinical need, and health and care workers.
Since some pillar 1 tests are conducted in a hospital setting, it is not practical for those
administering the tests to record the exact time that a test was taken. Therefore, the time
taken to receive a coronavirus (COVID-19) test result is measured from the time that a test
is received by a laboratory for processing to the time when the results are published to the
Laboratory Information Management System (LIMS).
This data is only available from 9 July 2020 due to differences in the reporting
methodologies for NHS and PHE labs. More details can be found in the NHS Test and
Trace statistics methodology.
Over 19 out of 20 pillar 1 test results were made available within 24
hours of the laboratory receiving the test.
Between 2 September and 8 September 2021, 96% of pillar 1 test results were made
available within 24 hours. Turnaround times for pillar 1 have been above 95% since the
week ending 27 January. Since reporting began, 94% of test results have been made
available within 24 hours.
Pillar 2 testing turnaround times, England
There are various routes for getting tested within pillar 2 (national swab testing) which has
an impact on turnaround times 8. Data on the time taken to receive a COVID-19 test result
for pillar 2 is split up to reflect this. These routes include:
o in-person tests, which involve a person being tested in-person at a
coronavirus test site. These include:
regional test sites, which includes drive-through testing centres.
local test sites 9, which are similar to regional test sites but specifically
for walk ups.
mobile testing units, which travel around the UK to increase access to
COVID-19 testing. They respond to need, travelling to test people at
specific sites including care homes, police stations and prisons.
8
For all measures of time taken to receive a COVID-19 test result, there are a number of tests that were not completed.
This covers any test where the results were not communicated, which may be because communication details (for
example, phone number or email address) were not provided or were incorrect, or because the test was cancelled or
abandoned, or no result was available. It also includes some tests which are still being processed.
9
Previously local test sites were included together with regional test sites but from 17 September 2020 have been split
out as a separate group.
13Department of Health and Social Care Statistical Bulletin
o satellite test centres, which includes test kits provided directly to ‘satellite’
centres at places like care homes that have a particularly urgent or significant
need.
o home test kits, which are delivered to someone’s door so they can test
themselves and their family without leaving the house.
A lower proportion of home and satellite test results will be available within 24 hours of the
test being taken compared to in-person tests due to differences in testing schedules and
delivery of tests. Therefore, the percentage of test results received within 24 hours for in-
person tests and the percentage of test results received within 48 hours for home and
satellite tests are presented in this bulletin. The accompanying data tables contain all
turnaround time windows for all testing routes.
There are normal fluctuations in this operational process which can sometimes cause the
time taken to receive a test result to go over 24 hours, but still be turned around the next
day. Therefore, we also provide the percentage of tests turned around the day after a test
was taken where appropriate. The median turnaround times are also given as an
indication of the average time taken.
Turnaround times are measured and reported in 2 ways:
• time from booking a test to receive a test result
• time from taking a test to receive a test result.
All figures presented in this bulletin relate to time from taking a test. Both measures are
available in full in the accompanying data tables. More information on these definitions is
in the terminology section and the NHS Test and Trace statistics methodology.
Lateral flow device (LFD) tests are not included in this section on turnaround times as they
do not require processing in a lab.
The median time to receive a test result after taking a test in-person has
slightly decreased from 27 hours in the previous week to 26 hours.
Since the week ending 23 December 2020, the median time taken to receive a test result
for in-person tests decreased overall and remained relatively stable since the week ending
27 January 2021. Recently between the week ending 2 June 2021 and the week ending
21 July 2021 times increased. However, they have fallen since then.
14Department of Health and Social Care Statistical Bulletin
Table 1: median time taken (hours) to receive test result, by route, England
Since Test and
Previous Current Trace launched:
reporting week reporting week 28 May 2020 to 8
September 2021
Regional test sites 19 19 22
Local test sites 19 20 23
Mobile testing units 18 19 21
Satellite test centres 34 38 40
Home testing kits 41 43 45
Figure 4: median time (hours) from taking a test to receiving test results by route, England
This data can be found in the ‘table_8’ tab of the ‘NHS Test and Trace statistics 28 May 2020 to 8
September 2021: data tables’ on the weekly collection page.
In the latest week, the percentage of test results received within 24
hours for in-person tests has decreased, while the percentage within 48
hours for home testing kits and satellite test centres has also fallen.
In the most recent week, 82.1% of in-person test results were received within 24 hours,
increasing slightly from 81.1% in the previous week.
The percentage of results received within 24 hours has increased overall since the week
ending 23 December 2020 and was above 80% between the week ending 27 January
15Department of Health and Social Care Statistical Bulletin
2021 and the week ending 23 June 2021. The percentage of test results received within
24 hours had decreased sharply in recent weeks, however since the week ending 28 July
it has returned to the levels seen at the start of June.
If we consider the day the test was taken, 97.5% of in-person tests results were received
the next day after the test was taken in the most recent week.
60.7%of test results were received within 48 hours for home test kits and satellite test
centres, compared to 70.5 in the previous week. For satellite test centres, 87.3%were
received within 72 hours, a decrease from the previous week. 92.3%of satellite tests were
received within 3 days after the day they were taken, which is a decrease from the 94.5%
reported in the previous week.
For all routes combined, 43% of tests from all test sites were received within 24 hours of a
test being taken compared to 42.5% in the previous week. If we consider the day the test
was taken, 65.4%of all test results were received the next day.
Table 2: percentage of results received within 24 hours (in-person tests) or within 48 hours
(home and satellite tests), by route, England
Since Test and
Previous Current reporting Trace launched: 28
reporting week week May 2020 to 8
September 2021
Regional test sites within 24 hours 81.1 82.1 58.4
Local test sites within 24 hours 78.2 80.4 56.2
Mobile testing units within 24 hours 81.8 81.0 63.9
Satellite test centres within 48 hours 73.8 62.6 63.3
Home testing kits within 48 hours 59.7 55.1 53.6
16Department of Health and Social Care Statistical Bulletin
Distance to in-person testing sites for booked PCR tests, pillar
2, England
The distance to testing sites for booked PCR tests is calculated as the direct distance
between the approximate centre of a person’s postal district and their chosen test location
in straight line. This is reported as the median and associated percentiles for those who
successfully booked a test at regional test sites, local test sites and mobile testing units in
the latest week. More information is available in the NHS Test and Trace statistics
methodology.
The median distance to in-person PCR testing sites for booked tests
has remained the same as the previous week.
Between 2 September and 8 September 2021, the median distance to an in-person PCR
test site has remained unchanged at 2.3 miles. 90% of people who booked a test at a test
centre lived 10.1 miles or less away.
From mid-August to mid-September 2020, the distance to PCR testing sites for booked
tests increased across in-person routes. However, since mid-September 2020, the
distance to PCR testing sites for booked tests has decreased overall and has been at
approximately 2.3 miles since the week ending 13 January 2021.
17Department of Health and Social Care Statistical Bulletin
Figure 5: median distance (miles) to testing sites for tests booked at an in-person PCR test
site by route, England
This data can be found in the ‘table_9’ tab of the ‘NHS Test and Trace statistics 28 May 2020 to 8
September 2021: data tables’ On the weekly collection page.
18Department of Health and Social Care Statistical Bulletin
1.2 Contact tracing in England
Once a person has a positive test result for coronavirus (COVID-19) 10, this person is
transferred to NHS Test and Trace and a case is opened for them. The number of positive
cases transferred to the contact tracing system may not always align with the number of
people testing positive for COVID-19. There are several reasons for this which are outlined
in the information for users document.
Positive cases and their contacts which are linked to potential outbreaks in specific
settings are handled by PHE local health protection teams (HPTs). These cases and
contacts, previously known as complex, have been referred to as ‘cases and contacts
managed by local HPTs’ since 29 October 2020. Furthermore, cases and contacts
managed nationally either online or by call centres, previously known as non-complex, are
referred to as ‘cases and contacts not managed by local HPTs’.
From 18 March 2021, only outbreaks in care homes are handled by HPTs. Further
information is available in the NHS Test and Trace statistics methodology.
Positive cases transferred to NHS Test and Trace
The number of positive cases transferred to NHS Test and Trace has
decreased in the latest week.
Between 2 September and 8 September 2021, 199,423 cases were transferred to the
contact tracing system, a 20% increase on the previous week. The number of cases
transferred had been increasing since the week ending 4 August 2021.
Between 2 September August and 8 September 2021, over 8 in every 10
cases transferred to the contact tracing system were reached and asked
to provide information about their contacts.
Out of the cases transferred to the contact tracing system in the latest week, 172,106
(86.3%) were reached, 26,716 (13.4%) were not reached and 601 (0.3%) had no
communication details provided. Since Test and Trace launched, 86.8% of all cases have
been reached.
10
All confirmed positive test results under pillar 1 and pillar 2 should be transferred. In addition, all positive virus test
results as part of prevalence studies (pillar 4) are also transferred to Test and Trace. People tested under pillar 3
(serology testing to show if people have antibodies from having had COVID-19) do not have their cases transferred to
NHS Test and Trace.
19Department of Health and Social Care Statistical Bulletin
In the latest week, 996 cases who were reached and asked to provide details of close
contacts were managed by local health protection teams (HPTs), whereas 171,110 cases
were community-wide cases and, therefore, not managed by local HPTs.
For cases managed by local HPTs, their contacts are often managed at a situation rather
than individual level, with advice being issued to the contact institution. Therefore, cases
who were managed by local HPTs may not have been individually reached and asked to
provide details of their recent close contacts. However, the cases and contacts will have
been successfully dealt with as a whole.
For more information on the different ways of managing cases and the outcomes of
contact tracing see the terminology section.
Figure 6: number of cases transferred to the contact tracing system and number of cases
transferred who were reached and asked to provide details of recent close contacts
(includes cases managed and not managed by local HPTs), England
This data can be found in the ‘table_10’ tab of the ‘NHS Test and Trace statistics 28 May 2020 to 8
September 2021: data tables’ on the weekly collection page.
20Department of Health and Social Care Statistical Bulletin
Table 3: cases transferred to the contact tracing system (includes cases managed and not
managed by local HPTs) by whether they were reached and asked to provide contact
details, England 11
Since Test and
Previous Current Trace launched: 28
reporting week reporting week May 2020 to 8
September 2021
People who were reached and
asked to provide details of recent 146,153 (87.6%) 172,106 (86.3%) 5,304,142 (86.8%)
close contacts
People not managed by local HPTs 145,244 171,110 5,154,811
People managed by local HPTs 909 996 149,331
People who were not reached 20,151 (12.1%) 26,716 (13.4%) 744,223 (12.2%)
People whose communication
487 (0.3%) 601 (0.3%) 61,469 (1.0%)
details were not provided
Total 166,791 199,423 6,109,834
11 If NHS test and trace is not able to reach an individual testing positive or if no communication details are available,
then it is not always possible to know if the case should be managed by a local HPT or not. Therefore, these breakdowns
are not available.
21Department of Health and Social Care Statistical Bulletin
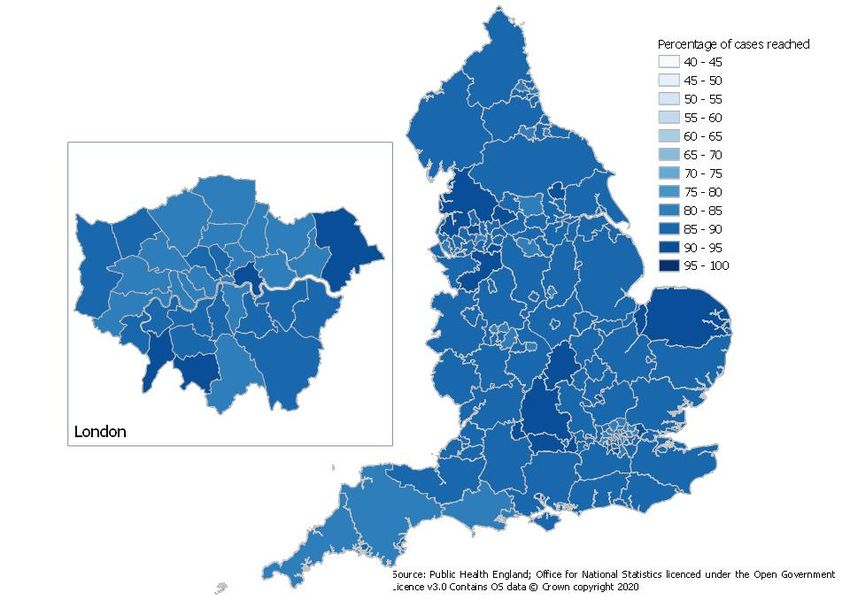
Proportion of people transferred to the contact tracing system who were reached by upper-tier local
authority (UTLA)
Figure 7: percentage of cases reached and asked to provide details of recent close contacts by UTLA since Test and Trace began.
This data is available as an interactive map and to download as a csv on the weekly collection page. 12
12 The regional data uses a different data cut to the main publication therefore cumulative totals will not exactly match. The data is available for the cumulative figures since
Test and Trace launched up to the most recent week of reporting. Due to revisions that occur each week one week’s cumulative figures cannot be subtracted from a previous
week’s to obtain weekly data by UTLA.
22Department of Health and Social Care Statistical Bulletin
In the latest week, over 7 in every 10 people who were reached and
asked to provide information about their contacts, provided one or more
close contacts.
Out of the 172,106 people reached between 2 September and 8 September 2021,
137,150 (79.7%) provided details of one or more close contacts. This is an increase from
the previous week, where 78.4% of people reached provided details of one or more
contacts.
The number who were not able to give any recent close contacts refers to people who
were successfully reached by NHS Test and Trace, but either had no recent close
contacts or could not provide details of close recent contacts to pass on for further contact
tracing (for example, recent close contact with strangers on the bus).
Figure 8: proportion of people transferred to the contact tracing system (includes cases
managed and not managed by local HPTs) who were reached and asked to provide details
of recent close contacts by whether they provided details for contacts or not, England
This data can be found in the ‘table_11’ tab of the ‘NHS Test and Trace statistics 28 May 2020 to 8
September 2021: data tables’ on the weekly collection page.
The breakdown for method used to reach cases is not currently available. Further
information is given in the NHS Test and Trace methodology.
23Department of Health and Social Care Statistical Bulletin
Close contacts identified by NHS Test and Trace
The number of close contacts identified has increased by 21% in the
latest week.
Between 2 September and 8 September 2021, 503,135 people 13 were identified as recent
close contacts, of which 501,212 (99.6%) were not managed by local HPTs and 1,923
(0.4%) were managed by local HPTs.
The number of contacts not managed by local HPTs increased between the weeks ending
2 December 2020 and 6 January 2021 but decreased afterwards. However, since the
week ending 19 May 2021, the number of closed contacts identified has substantially
increased overall.
From 18 November 2020, there has been a change in how household contacts under 18
are reached. These changes mean that under-18s in a household are no longer contact
traced individually, providing the parent or guardian in the household confirms they have
completed their legal duty to inform their child to self-isolate. From 27 November 2020, this
change was also extended to cover adults in the same household, so they have the option
to be traced via a single phone call.
Considering only the contacts where communication details were provided, 90.1% were
reached and told to self-isolate in the most recent week. This is a slight increase from the
89.6 observed in the previous week.
13
The number of people identified includes duplicates as an individual may be named as a close contact for
more than one case. See the methodology for more information.
24Department of Health and Social Care Statistical Bulletin
Figure 9: number of recent close contacts identified, England
This data can be found in the ‘table_13’ tab in ‘NHS Test and Trace statistics 28 May 2020 to 8
September 2021: data tables’ on the weekly collection page.
85.3% of contacts not managed by local HPTs were reached and told to
self-isolate in the latest week.
Between 2 September and 8 September 2021, 501,212 recent close contacts not
managed by local HPTs were identified of which 427,440 (85.3%) were reached and told
to self-isolate. Despite the numbers of contacts increasing rapidly over the last few months
the percentage of contacts reached has remained steady since the week ending 12 May
2021. In the latest week, 47,414 (9.5%) contacts not managed by local HPTs were not
reached and 26,358 (5.3%) people had no communication details. For more information
on the different outcomes of contact tracing, see the terminology section.
100% of contacts managed by local HPTs were reached and told to self-
isolate.
Between 2 September and 8 September 2021,1,923 close contacts were identified who
were managed by local HPTs, of which all were reached and told to self-isolate. Since
Test and Trace launched, 98.0% of all contacts managed by local HPTs have been
successfully reached.
25Department of Health and Social Care Statistical Bulletin
For contacts managed by local HPTs, contacts are managed as a whole setting and are
often managed at a situation rather than individual level, with advice being issued to the
contact institution. Therefore, these contacts may not have been individually reached and
told to self-isolate but should have received this advice from their institution. For this
reason, contacts managed by local HPTs have a higher success rate compared with
community wide contacts not managed by local HPTs.
Figure 10: proportion of contacts reached and told to self-isolate, England 14
This data can be found in the ‘table_13’ tab of the ‘NHS Test and Trace statistics 28 May 2020 to 8
September 2021: data tables’ on the weekly collection page.
14 Contacts managed by local HPTs are reached when the situation has been dealt with and advice has been issued to
the institution, whereas contacts not managed by local HPTs must be individually contact traced (unless they are a
household contact) to be classified as reached.
26Department of Health and Social Care Statistical Bulletin
Proportion of close contacts identified not managed by local HPTs who were reached and told to self-
isolate by upper-tier local authority (UTLA)
Figure 11: percentage of contacts not managed by local HPTs who were reached and told to self-isolate by UTLA since Test and
Trace began
This data is available as an interactive map or to download as a csv on the weekly collection page. 15
15
The regional data uses a different data cut to the main publication therefore cumulative totals will not exactly match. The data is available for the cumulative figures since
Test and Trace launched up to the most recent week of reporting. Due to revisions that occur each week one week’s cumulative figures cannot be subtracted from a
previous weeks to obtain weekly data by UTLA.
27Department of Health and Social Care Statistical Bulletin
In the most recent week, over 6 in every 10 contacts not managed by
local HPTs were from the same household as the case they were
identified from, consistent with the previous week.
Between the weeks ending 10 February and 28 April, the proportion of household contacts
decreased to 40.6%. Since this dip, there has been an overall increase to the current
proportion of 61.7%.
Between 2 September and 8 September 2021, 96.5% of household contacts were
successfully reached and told to self-isolate. This is a slight increase from the previous
week.
In the latest reporting week, 65.5% of contacts who were from a different household to the
case from which they were identified were successfully reached and told to self-isolate.
This is a slight decrease on the 66.4% reported in the previous week.
Figure 12: proportion of recent close contacts not managed by local HPTs by whether they
were from the same household as the case that they were identified from, England
This data can be found in the ‘table_14’ tab of the ‘NHS Test and Trace statistics 28 May 2020 to 8
September: data tables’ on the weekly collection page.
28Department of Health and Social Care Statistical Bulletin
NHS Test and Trace end to end timing metrics
For contacts not managed by local HPTs who were told to self-isolate,
over 8 out of 10 were reached within 3 days of the case that reported
them taking their test.
Between 2 September and 8 September 2021, 366,893 (86.5%) contacts that were
reached and told to self-isolate were reached within 3 days of the case that reported them
taking a test which subsequently returned a positive result. This is a decrease from 88.2%
in the previous week.
The percentage reached within 3 days decreased from week ending 9 December 2020
over the Christmas period and returned to those levels afterwards, before decreasing
again in March and April 2021. Since then, the percentage has increased overall to its
current value.
Figure 13: proportion of recent close contacts who were told to self-isolate within 3 days of
the case taking a test (excludes cases managed by local HPTs), England
This data can be found in the ‘table_17’ tab in the ‘NHS Test and Trace statistics 28 May 2020 to 8
September 2021: data tables’ on the weekly collection page.
29Department of Health and Social Care Statistical Bulletin
This is an end-to-end measure, and therefore is comprised of several subsidiary
measures. Table 4 provides the timing metrics from when a case is transferred into the
contact tracing system.
Table 4: contact tracing timing metrics, England
Previous Current Since Test and Trace
reporting reporting launched: 28 May 2020
week week to 8 September 2021
Percentage of cases not managed by local 82.6% 81.6% 75.4%
HPTs reached and asked to provide details
about close contacts within 24 hours of their
case being transferred to contact tracing
Percentage of contacts not managed by local 97.4% 97.5% 94.3%
HPTs who were told to self-isolate who were
reached within 24 hours of being identified
Percentage of contacts not managed by local 69.7% 71.2% 68.2%
HPTs who were told to self-isolate who were
reached within 24 hours of the case that reported
them being transferred to the contact tracing
system
Note that because the timing statistics given in table 4 are from when a case was
transferred to the contact tracing system, delays in transferring cases to contact tracing will
not be captured. However, they will be captured in the full end to end measure from when
the test was taken.
For contacts not managed by local HPTs who were told to self-isolate,
the median time taken for contacts to be reached from the case that
identified them reporting to first observe symptoms 16 was 79 hours.
Since October 2020 there has been an overall decrease in the median time taken for
contacts to be reached from the case that identified them first reporting symptoms. The
median time increased in April 2021, but since the week ending 21 April 2021, it has
decreased overall to its current value. In the most recent week, the median time has
increased slightly from 78 hours to 79 hours.
Please note this data only includes contacts reported by cases who reported to experience
at least one symptom. This data is collected by asking symptomatic people who tested
positive and were subsequently reached by NHS Test and Trace to recall which day they
first observed coronavirus symptoms. More information is available in the NHS Test and
Trace statistics methodology.
16 The date a case first observed symptoms is the date they reported to NHS Test and Trace after a positive test. This
only includes contacts where the case that reports them reporting experiencing at least one symptom to NHS Test and
Trace.
30Department of Health and Social Care Statistical Bulletin
Figure 14: median time from case first reporting symptoms to contact reached (excludes
cases managed by local HPTs), England
This data can be found in the ‘table_18 tab in the ‘NHS Test and Trace statistics 28 May 2020 to 8
September 2021: data tables’ on the weekly collection page.
31Department of Health and Social Care Statistical Bulletin
1.3 Managed quarantine service (MQS)
Background on the Service
From 15 February 2021, individuals 17 allowed to enter England from an amber or red listed
country or territory may have to quarantine for 10 days and take a PCR test on or before
day 2 and on or after day 8 of quarantining as part of the Managed Quarantine Service
(MQS).
People arriving in England who have visited or passed through a country and territory
where travel to the UK is banned (red list countries and territories 18) are required to
quarantine in a managed quarantine hotel. Only British or Irish Nationals or people with
residence rights in the UK are allowed to do this. People arriving from amber list countries
and territories are required to quarantine at home 19.
Under the traffic light framework set out on 9 April (to take effect from 17 May), those
returning to England from green list countries and territories are not required to quarantine
and need to present a negative pre-departure test to be taken within the 72 hours before
departure, as well as a PCR test on or before day 2 of their arrival in England.
A country or territory may be designated green, amber or red following a ministerial
decision-making process. Designations of countries and territories are published by the
Department for Transport and are reviewed on a regular basis. Therefore, they are subject
to change and the data released will reflect the lists as they were on the date of release.
For more detail see guidance on entering the UK.
This bulletin only contains data relating to red list and amber list countries and territories.
Table 21 in the accompanying data tables contains data for all countries and territories
(including green list countries and territories) where a traveller has been registered in the
corresponding time period. A full explanation of the data sources and methods used to
produce these statistics can be found in the NHS Test and Trace statistics methodology.
People starting quarantine
Since the MQS launched on 15 February 2021, 4,019,180 people have started
quarantining at home or in a managed quarantine hotel. Between 2 September and 8
17
Full guidance on who is required to quarantine can be found on Quarantine and testing if you've been in
an amber list country
18
See the current countries on the red travel ban list
19
See the countries on the amber travel list
32Department of Health and Social Care Statistical Bulletin
September 2021, 369,363 people started quarantining, compared to 417,781 in the
previous week.
The number of international arrivals from amber list countries and territories has been
steadily rising since the inception of MQS in February 2021, despite a brief drop between
the weeks ending 21 April 2021 and 19 May 2021. In the latest week, the number of
people starting their quarantine period at home fell from 411,062 to 361,396.
The number of people starting their quarantine in a hotel increased by 18.6% to 7,967 in
this latest reporting week.
Since 10 March 2021, international arrivals arriving from amber list countries and territories
have had the option to book their quarantine package through a private provider. As of the
publication on 8 July 2021, these figures are now included in the data. The proportion of
quarantine packages that are purchased through a private provider has been steadily
rising since its introduction and since week ending 26 May, private bookings now account
for the vast majority of home quarantine packages booked. For more information, see the
NHS Test and Trace statistics methodology.
Table 5: number of people starting their quarantine at home or in a managed quarantine
hotel, England
Since MQS launched.
Previous reporting Current reporting
15 February to 8
week: number of week: number of
September 2021:
people starting people starting
number of people
quarantine quarantine
starting quarantine
People starting quarantine at home 411,062 361,396 3,831,760
People starting quarantine in a
managed quarantine hotel 6,719 7,967 187,420
Total 417,781 369,363 4,019,180
People taking tests
Between 2 September and 8 September 2021, 496,641 registered and processed tests
have been taken by people quarantining at home and 16,347 registered and processed
tests have been taken by people quarantining in a managed quarantine hotel. International
arrivals who are quarantining at home have the option to book their PCR tests through a
private provider. From the publication on 8 July onward, these tests are now included in
the totals, and account for almost all of PCR tests taken by people quarantining at home.
The number of tests registered and processed each week will not be the same as the
number of people quarantining in that same week for several reasons:
33Department of Health and Social Care Statistical Bulletin
• The cohort of people starting their quarantine will not be the same cohort of people
who take their day 2 test in a given week. For example, people starting their
quarantine towards the end of the week will have their day 2 tests fall into the
following week.
• There may be differences in the population quarantining and those who are
required to take a test, for example children under 5 do not need to take a test.
• Passengers with a positive test on day 2 are not required to take a day 8 test.
• Correct completion and return of test data is required by the person taking the test
to ensure that tests are correctly registered.
Table 6: number of registered and processed PCR taken by people quarantining at home,
England
Previous reporting Current reporting Total 25 March to 8
week: number of tests week: number of tests September 2021:
processed and processed and number of tests
registered registered processed and
registered
Day 2 – Quarantining at 450,390 424,106 3,311,417
home (amber list
arrivals)
Day 8 – Quarantining at 48,261 50,470 1,413,008
home (amber list
arrivals)
Day 5 – Quarantining at 22,772 22,065 447,411
home (amber list
arrivals)
Test to Release
Total registered tests 521,423 496,641 5,171,836
processed (amber list
arrivals)
34Department of Health and Social Care Statistical Bulletin
Table 7: number of registered and processed PCR taken by people quarantining at a
managed quarantine hotel, England
Previous reporting Current reporting Total 25 March to 8
week: number of tests week: number of tests September 2021:
processed and processed and number of tests
registered registered processed and
registered
Day 2 – Quarantining at 12,584 10,363 201,232
managed quarantine
hotel (red list arrivals)
Day 8 – Quarantining at 5,322 5,984 130,784
managed quarantine
hotel (red list arrivals)
Total registered tests 17,906 16,347 332,016
processed (red list
arrivals)
The total number of PCR tests processed for passengers at home includes tests not
registered to an individual. The full breakdown of tests registered and not registered
across day 2 and day 8 for people quarantining at home can be found in ‘Table 20’ of
the accompanying data tables.
The total number of PCR tests processed for passengers in a hotel only includes the
number of tests that have been correctly registered. Evidence of negative tests or an
extended stay following a positive test must be presented by passengers in hotels before
they are able to leave.
When countries are moved on to the red list, an increase in passenger numbers in hotels
may be seen. This will be reflected in an increase in day 2 tests. These passengers may
not have had a day 8 test in the same reporting period.
People quarantining in England at home can end their quarantine early through the test to
release scheme. This lets people choose to pay for a private COVID-19 test where it
meets the minimum testing standards after they have been in England for 5 full days. If the
results of the test are negative, quarantine can be ended. If positive, quarantine should be
extended for 10 days after taking the test. The private tests booked through this scheme
are in addition to the day 2 and day 8 tests booked as part of the managed quarantine
service. This data is now available in Table 20 of the accompanying data tables.
35Department of Health and Social Care Statistical Bulletin
In the latest week for arrivals from Amber-listed countries, 3,282 (0.8%) Day 2 tests on
Amber arrivals were positive, compared to 479 (0.9%) Day 8 tests and 125 (0.6%) Test to
Release tests.
For arrivals from Red-listed countries, 145 (1.4%) Day 2 tests processed were positive
compared to 165 (1.3%) the previous week, while 38 (0.6%) Day 8 tests were positive
compared to 35 (0.7%) in the previous week.
Across the whole of the MQS, Day 2 tests in managed quarantine hotels has seen the
highest proportion of positive tests in the latest reporting week, with 1.4% of tests
processed returning a positive result.
Risk assessment status, people tested, positivity and variants
by country and territory
Countries and territories are risk assessed based on data from a number of sources to
determine whether they should be added to the list of countries and territories requiring
quarantine at a managed quarantine hotel upon return (red list countries and territories), or
at-home quarantining (amber list countries and territories). For more information on these
decisions, please see the COVID-19 risk assessment methodology document.
Passengers are asked to report their recent travel history when returning to the UK so that
the number of positive test results taken while under managed quarantine, as well as the
number of VOCs and VUIs sequenced from these positive tests, can be considered when
assessing the risk of travel and whether countries and territories should be assigned to the
red list.
Data for risk assessment status, testing, positivity and variants by country or territory can
be found in the ‘table 21’ tab of the accompanying data tables. While the other managed
quarantine service data tables will be updated weekly, Table 21 will be updated every
three weeks following this publication and will consider a three-week reference period.
This will align the data with the Joint Biosecurity Centre’s assessments of the latest data,
which are also conducted every three weeks. All weeks will be covered by the data.
36Department of Health and Social Care Statistical Bulletin
1.4 Test and Trace Support Payments
Background on Test and Trace Support Payments
The Test and Trace Support Payment scheme (TTSP) provides financial support to people
on low incomes who have to self-isolate if they are unable to work from home and will lose
income as a result. It was introduced on 28 September 2020 and is administered by
unitary and lower tier local authorities in England. The purpose of TTSP is to support
people to self-isolate if they are required to do so, and to encourage more people to come
forward to get tested. This helps to reduce the transmission of COVID-19.
Applicants may be eligible for a payment of £500 if they are in receipt of a means tested
benefit and meet the other eligibility criteria. Information on the eligibility criteria is
available online at: Claiming financial support under the Test and Trace Support Payment
scheme.
Local authorities have also been provided with funding to make discretionary payments to
individuals who are not on a means tested benefit but will still face hardship if they have to
self-isolate. Local authorities are responsible for setting the discretionary criteria in their
areas, enabling them to target support at residents most in need.
TTSP is only available in England; however, both the Scottish and Welsh Governments
run similar schemes. In Northern Ireland, people can apply for a non-repayable
Discretionary Support self-isolation grant if they are on a low income and are experiencing
financial difficulties due to self-isolation.
Successful Claims
Local authorities submit reporting information to NHS Test and Trace on the number of
successful claims they have paid out. These statistics use the recorded payment date of
the claim. Please note that some adjustments are made to the payment date for errors and
missing payment dates.
Between 2 September and 8 September 2021, local authorities reported
payments of £5.1 million to 10,295 applicants.
As of 8 September 2021, local authorities have reported 287,102 successful claims since
the start of the scheme, totaling £143.6 million in TTSP payments. 58.8% of these have
been claimed through the main scheme and 41.2% have been claimed through the
discretionary scheme. Over the previous week, local authorities reported payments of £5.1
million to 10,295 applicants.
37Department of Health and Social Care Statistical Bulletin
Successful claims fluctuate over time as the numbers of people testing positive increase or
decrease. There is also variance in the number of successful claims at local authority
level. This is in part due to differences in populations, for example the proportion of the
local population claiming a means-tested benefit, which impact the number of eligible
applicants.
38Department of Health and Social Care Statistical Bulletin
2. Terminology
2.1 Testing
• Pillar 1 testing: swab testing for the virus in Public Health England (PHE) labs,
NHS hospitals for those with a clinical need, and health and care workers.
• Pillar 2 testing: swab testing for the virus for the wider population, through
commercial partnerships 20, either processed in a lab or more rapidly via lateral flow
devices tests. Tests processed in a lab are carried out through several different
routes:
o in-person tests, which involve a person being tested in-person at a
coronavirus test site. These include:
regional test sites, which includes drive-through testing centres
local test sites 21, which are similar to regional test sites but
specifically for walk ups
mobile testing units, which travel around the UK to increase access
to COVID-19 testing. They respond to need, travelling to test people
at specific sites including care homes, police stations and prisons
o satellite test centres, which includes test kits provided directly to ‘satellite’
centres at places such as care homes that have a particularly urgent or
significant need
o home test kits, which are delivered to someone’s door so they can test
themselves and their family without leaving the house
• Pillar 3 testing: serology testing to show if people have antibodies from having had
coronavirus
• Pillar 4 testing: blood and virus testing for national surveillance support by PHE,
ONS and research, academic and scientific partners to learn more about the
prevalence and spread of the virus and for other testing research purposes
• Virus testing: swab testing using polymerase chain reaction (PCR) assay within
pillars 1, 2 and pillar 4 to show if someone currently has COVID-19
• Antibody testing: testing of a blood sample within pillar 3 and pillar 4 to show if
people have antibodies from having had COVID-19
• People tested each week: refers to people who have been tested at least once in
each reporting week, therefore if someone had multiple tests in a given week they
would be counted once
20See more detail in Scaling up our testing programmes.
21
Previously local test sites were included together with regional test sites but from 17 September 2020 have been split
out as a separate group.
39Department of Health and Social Care Statistical Bulletin
• People testing positive each week: refers to the number of people who tested
positive at least once in each reporting week, therefore is someone tested positive
multiple times in a given week they would only be counted once
• Cumulative people tested: refers to the number of people who have been tested
at least once since Test and Trace launched
• Cumulative people testing positive: refers to the number of people who have
tested positive at least once since Test and Trace launched
For pillar 2, there are two measures of the time taken to receive a coronavirus (COVID-19)
test result:
• the time taken to receive a COVID-19 test result from time of booking is
measured from the time that a person books an appointment on the website to the
time when the person receives a notification of their test result via an email or an
SMS. This data is only available for regional test sites, local test sites and mobile
testing units, as test booking and registration processes for home testing and
satellite test centres are currently undertaken on different systems
• the time taken to receive a COVID-19 test result from time of test is measured
from the time a person completes a test registration (or the time a person indicates
their test was taken for home testing kits) until the time that they receive a
notification of the result of their test via an email or an SMS
2.2 Tracing
NHS Test and Trace has two ways of handling cases depending on the way in which they
are managed:
• Cases and contacts managed by local HPTs (previously known as complex) -
PHE Local Health Protection Teams manage cases linked to outbreaks, examples
include someone who works or has recently visited:
− a health or care setting, such as a hospital or care home
− a prison or other secure setting
− a school for people with special needs
− critical national infrastructure or areas vital for national security
• Cases and contacts not managed by local HPTs (previously known as non-
complex) - Wider online and other call centre capacity for individual community-
wide cases and contacts.
When a case is transferred to NHS Test and Trace contact tracers will attempt to contact
the individual which results in one the following 3 outcomes:
40You can also read