Data Visualization Tools (DVTs) for Nutrition in India: A Landscape Review - International Food Policy Research Institute (IFPRI) ...
←
→
Page content transcription
If your browser does not render page correctly, please read the page content below
Data Visualization Tools (DVTs) for
Nutrition in India: A Landscape Review
International Food Policy Research Institute (IFPRI)
Co-investigators: NITI Aayog and Results for Development (R4D)
Glossary of Acronyms
AHS      Annual Health Survey
AMB      Anemia Mukt Bharat
AMPR     Anganwadi Centre Monthly Progress Report
ANM      Auxiliary Nurse Midwife
ASHA     Accredited Social Health Activist
AWW      Anganwadi Worker
CAS      Common Application Software
CNNS     Comprehensive National Nutrition Survey
DLHS     District level Household Survey
DVT      Data Visualization Tools
HMIS     Health Management and Information System
ICDS     Integrated Child Development Services
ICAR     Indian Council of Agricultural Research
IFA      Iron Folic Acid
IFPRI    International Food Policy Research Institute
JSY      Janani Suraksha Yojana
LHV      Lady Health Visitor
MCP      Mother and Child Protection card
MIYCN    Maternal, Infant and Young Child Nutrition
MOHFW    Ministry of Health and Family Welfare
MPR      Monthly Progress Report
MWCD     Ministry of Women and Child Development
NACO     National AIDS Control Organization
NIN      National Institute of Nutrition
NFHS     National Family and Health Survey
NHM      National Health Mission
NSSO     National Sample Survey Office
ORS      Oral Rehydration Salts
POSHAN   Partnerships and Opportunities to Strengthen and Harmonize Actions for Nutrition in India
RSOC     Rapid Survey on Children
SRS      Sample Registration System (Census of India)
VHSND    Village Health Sanitation and Nutrition Day
Overview and approach
What are Data Visualization Tools?
Data visualizations tools (DVTs) are defined as outputs that help people understand the significance of data by
placing it in a visual context (e.g., bar graphs, maps, etc.), making them useful in decision making, advocacy and
communication.
DVTs are an integral part of the Nutrition Data Value Chain
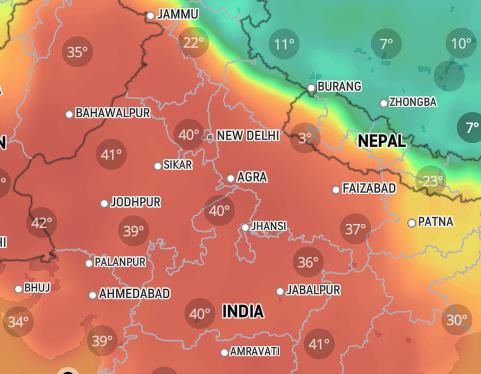
Weather map, a common DVT example in everyday
life curates the most important actionable indicators
on temperature across regions and shows on a map
with color coding.
Sources: Evergreen, Stephanie DH. Effective Data Visualization: The Right Chart for the Right Data. SAGE Publications, 2016.
https://www.r4d.org/resources/a-landscaping-of-global-data-visualization-tools-for-nutrition/
https://www.accuweather.com/en/in/national/current-weather-maps
Different types of DVTs support different types of goals and
 decisions

      Dashboards present key           Scorecards compare performance        Indices aggregate several indicators    Profiles provide a snapshot of how a
 performance indicators to achieve     across indicators to display status   into a single indicator (or composite      geographic region is doing in a
   goals on a single screen – at-a -   and monitor progress, often used       score) to rank units, often used for      particular sector, often used to
glance, often used for operations or    for advocacy and accountability          advocacy and accountability           spread awareness across broad
            management                             purposes                                                                        audiences

                DVTs rarely fall into just one of these types- they often mix goals and features across the different types
There has been an increase in the number of nutrition DVTs in
India in recent years
Government and development partners are stepping up efforts to create a culture of accessible data for
decision-making using DVTs. Two key government initiatives include:

                                                                  Digital India is a flagship program that promotes governance through
                                                                  digital platforms, aiming to to transform India into a digitally empowered
                                                                  society and knowledge economy.

                                                                  The Prime Minister’s Overarching Scheme for Holistic Nutrition (POSHAN)
                                                                  Abhiyaan is India’s flagship programme to improve nutritional outcomes for
                                                                  children, pregnant women and lactating women. It was launched in March
                                                                  2018 and is being implemented by the Ministry of Women and Child
                                                                  Development and Ministry of Health and Family Welfare.

Sources: https://www.india.gov.in/spotlight/poshan-abhiyaan-pms-overarching-scheme-holistic-nourishment
https://digitalindia.gov.in/content/vision-and-vision-areas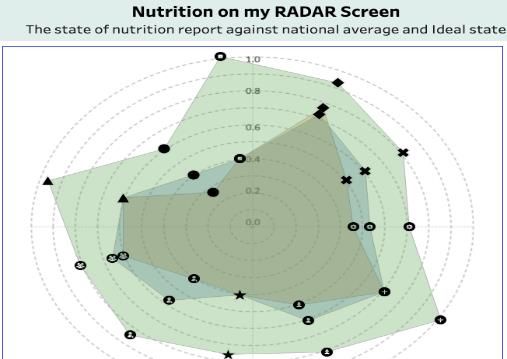
How do DVTs contribute to the nutrition landscape in India?

Key research questions
1.1 What nutrition DVTs are available in India?

2.2   What is the ultimate goal of the DVT, and what is the producer’s theory of change for how that
      goal will be achieved through their DVT?

1.3   How do nutrition stakeholders' access DVTs in India to meet their data needs?

1.4   What are the strengths and challenges of existing Indian DVTs?

2.5   What can be recommended to strengthen the design and use of nutrition DVTs in India?

In 2018-19, an analysis of global Data Visualization Tools (DVTs) was conducted by R4D as part of the DataDENT
initiative. To complement the global DVT work, we studied India’s case to examine how well DVTs respond to data
needs and challenges among nutrition decision-makers in India.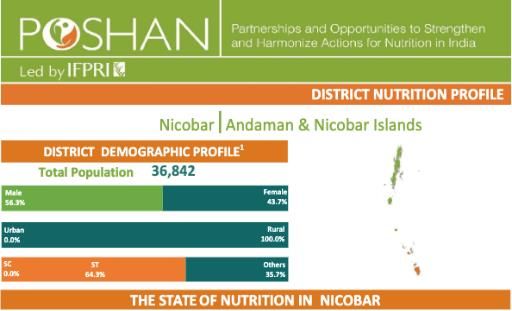
We conducted a landscaping of nutrition DVTs in India using a 3-
step methodology

                   I. Desk review                                                II. Producer interviews                                               III. Online user surveys
   1    DVTs that include nutrition                                      4      Producers* were interviewed for                                5     35 nutrition stakeholders took
        data or content were reviewed                                           7 of the DVTs regarding:                                             part in online user survey:

                                                                                ▪ Their DVT’s theory of change,                                      ▪ To understand how users are
   2    We focused on publicly                                                    intended users, outputs,                                             exposed to DVTs, their nutrition
        accessible DVTs that were                                                 dissemination processes, user                                        data needs, preferences in
        produced or refreshed within                                              engagement strategies, and                                           visualization, and challenges
        the past 5 years.                                                         production/ maintenance                                              faced in accessing and using
                                                                                                                                                       data.
                                                                                ▪ Who uses their DVT, how
                                                                                  people are using their DVT,
  3     We found 10 nutrition relevant                                            and any feedback they have
        DVTs through internet                                                     received from users
        searches (Google), and partner
        referrals.

*Note: DVT producers were responsible for conceptualizing, deciding DVT content, commissioning designers, and overall management. Out of 10 DVTs included in our review, we could not interview DVT
Producers of Jan Andolan Dashboard, Brookings Health Monitor and NITI Aayog State Nutrition Dashboard.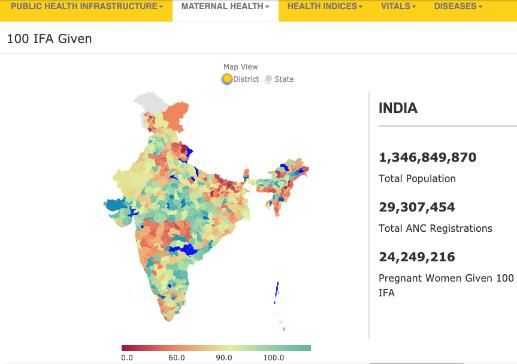
In specific, nutrition DVTs were reviewed against four parameters

                        Goals & Audience: DVTs goals grouped into two categories: (1) accountability; and (2) planning,
                        implementation, and monitoring. Goals and audience were assessed based on description on their
                        website and validated by producer interviews.
Goal & Audience

                        Domains & Indicators: Indicators included in the DVTs were reviewed by domains (e.g., coverage,
                        nutritional status) and mapped against the India Nutrition Indicator Framework.*
    Domains &
    Indicators

                        Design: Design features such as “naming, faming, and acting” techniques (includes traffic lights,
                        etc.), profiles, and interactive dashboards with bar graphs, maps, etc.
      Design

                        Data sources: Identified the specific data sources (administrative or population-based surveys) used
                        by DVTs to populate data.
   Data Sources

*Note: A list of interventions, determinants, and outcomes aligning with the POSHAN Abhiyaan framework was generated along with potential indicators, creating the India Nutrition Indicator Framework.
This framework is developed jointly by IFPRI, NITI Aayog and IDinsight to highlight issues to improve data availability and data use in context of POSHAN Abhiyaan, India’s National Nutrition Mission.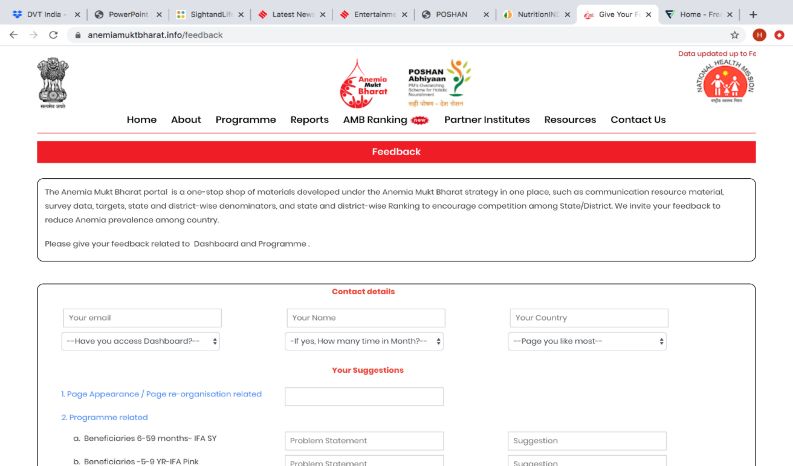
Summary: Key findings from the landscape review
     1. There is a growing number of nutrition DVTs in India tailored to national policies that can facilitate in-
        country decision-making.

     2. Most DVTs reviewed have a clear purpose and audience but few specified how their DVT will
        contribute to users taking action (e.g. a Theory of Change).

     3. Information in DVTs may be difficult to interpret when they include visualizations without adequate
        explanation or use different data sources and definitions for the same indicator when compared to
        other DVTs.

     4. Most DVTs reviewed lack input and intervention coverage indicators on adolescence, lactation and
        newborn care.

     5. Half of the DVTs reviewed provide user support, such as user guides, and/or trainings on nutrition
        data, interpretation and its use.

         Few DVTs deployed systems for soliciting user feedback before or after DVT development.
Key finding #1
1. There is a growing number of nutrition DVTs in
India tailored to national policies that can
facilitate in-country decision-makingWe found 10 publicly-available nutrition DVTs in India, 9 of which
were launched in a 24-month timeframe
Dec 2017: Launch at IFPRI event
Apr 2018: E-launch
2017: Launched by Ministry of
Health 2018: Launched
State Nutrition
Dashboard State of Food &
2017: Launched Sept 2018: E-launch Nutrition in India
Feb 2020: Formal launch for
2018: Launched at Harvard
district at POSHAN Pakhwada
University by Ratan Tata.
2017: Launch with media
coverage
2017: Launched
Note: We only reviewed DVTs that were produced or refreshed within the past 5 years.Of the 10 DVTs, 5 were produced by the government, 3 used government-
owned administrative data (in public domain)
Anemia Mukt Bharat Champions of Change Jan Andolan NITI State Nutrition Nutrition India
Produced by: Produced by: NITI Aayog Produced by: MWCD Produced by: NITI Aayog Produced by:
MOHFW/UNICEF Data source: Data source: Data source: Population- MOHFW/UNICEF
Data source: Administrative (HMIS, ICDS- Administrative (HMIS, based survey (NFHS-4) Data source: Population-
Administrative (HMIS) AMPR and other departments) ICDS-AMPR and other based surveys (NFHS-4 & 3,
departments) CNNS 2017-18, and RSOC 2013-
14)
… and 5 were produced by development partners, often using data from
population-based surveys
POSHAN District Brookings India Health Nutrition on my
Nutrition Atlas Tata NIN
Nutrition Profiles Monitor RADAR Screen
Produced by: ICMR-NIN Produced by: IFPRI Produced by: NIN Produced by: Brookings Produced by: IIT Bombay
Data source: Population Data source: Population Data source: Population Data source: Population Data source: Population
based survey (NFHS-4, based survey (Census 2011, based survey (NFHS-4, based survey (NFHS-4) based survey (NFHS-4)
DLHS, AHS, SRS, NACO NFHS-4, NSSO) NSSO, and others)
estimates)
Note: Produced by considers DVT producers to be those responsible for conceptualizing, deciding DVT content, commissioning designers, and overall management.Nutrition DVTs in India include different features to facilitate in-
country decision-making
Indicators by sector* Sub-national data
10 3
Health Agriculture
State
5 4
Education WASH National State District
Multiple sectors contribute to the immediate, underlying and basic determinants of Sub-national data helps to identify variation within a region and specific issues of
nutrition and data can help users to understand multisectoral pathways. that region to support policymakers /stakeholders in defining their priorities.
DVTs that include indicators by relevant sector sub-categories
3 4 1 5
Range of nutrition National programs Service delivery Disaggregated
outcomes such as Janani platforms such as, variables (e.g. caste/
(high/medium/low) Suraksha Yojana visited by ASHA rural vs urban, sex,
District
(JSY) etc.)
Additional indicators will help users to provide in-depth analysis and to facilitate dialogue.
* Indicators by sector: During our review, we also found that DVTs have indicators related to health, agriculture, education and WASH sectors, along with nutrition relevant indicators.Government-owned DVTs include sub-national data, indicators from
multiple sectors, and often disaggregated variables
Anemia Mukt Bharat Champions of Change Jan Andolan NITI State Nutrition Nutrition India
Dashboard Dashboard, Index Dashboard Dashboard Dashboard, Profile
Indicators by sector: Health Indicators by sector: Health Indicators by sector: Health Indicators by sector: Health & Indicators by sector: Health &
& nutrition & nutrition, education, & nutrition, education, WASH nutrition nutrition, education, WASH
Sub-national data: 29 states, agriculture, WASH and others Sub-national data: 29 states, Sub-national data: 29 states, 6
6 union territories and 725 Sub-national data: 117 Sub-national data: 29 states, 6 union territories and 725 union territories and 725
districts Aspirational districts 6 union territories districts districts
Indicator sub-categories: Indicator sub-categories: Indicator sub-categories: Indicator sub-categories: Indicator sub-categories:
Input indicators on IFA tablet; Institutional deliveries, and Data from 7 ministries at Disaggregated variables (e.g. Disaggregated variables (e.g.
severity of indicators is deliveries by Skilled Birth central level, and 14 residence, total population) ; caste/ rural vs urban, sex,
shown in color-coded maps Attendant (SBA). departments at state, district, severity of nutrition outcomes socio-economic status.); data
using data range (no data, 0- and block Levels provide data (high and medium). on pregnant women visited by
25, 25-50, 50-75 and 75-100). are updated in real-time ANM/ASHA/AWW.
basis.DVTs produced by development partners include sub-national
data, indicators from multiple sectors, and national program data
POSHAN District Nutrition on my
Nutrition Atlas Tata NIN Brookings India Health
Nutrition Profiles RADAR Screen
Dashboard Dashboard Monitor Dashboard
Index, Dashboard Dashboard
Indicators by sector: Health Indicators by sector: Health Indicators by sector: Health Indicators by sector: Health & Indicators by sector: Health &
& nutrition, & nutrition, education, & nutrition, agriculture nutrition nutrition, education
Sub-national data: 29 states, agriculture, WASH Sub-national data: 36 states, Sub-national data: 29 states, Sub-national data: 29 states, 6
6 union territories and 725 Sub-national data: 640 6 union territories and 638 6 union territories union territories and 640
districts districts districts Indicator sub-categories: districts
Indicator sub-categories: Indicator sub-categories: Indicator sub-categories: Disaggregated variables; Indicator sub-categories: 44
Disaggregated variables (e.g. Disaggregated variables (e.g. National average, high equity; JSY availed. key indicators from NFHS-4
sex.); severity of nutrition caste/ rural vs urban, sex, prevalence and low India & State factsheets; JSY
outcomes (low, medium and etc.), JSY availed, visited by prevalence districts are availed.
high). Primary Health Worker. presented for indicators; JSY
availed.Key finding #2
1. Most DVTs reviewed have a clear purpose and
audience but few specified how their DVT will
contribute to users taking action (e.g. a Theory of
Change)Most DVTs reviewed fall under two broad categories, a) planning,
implementation, and monitoring, and b) accountability.
▪ Planning, implementation and monitoring DVTs aims to provide data to support a range of stakeholders in planning,
implementation, and monitoring progress. These DVTs focus more on enabling environment, enacted legislation, and
coverage indicators. For example, Anemia Mukt Bharat and Jan Andolan Dashboard.
▪ Accountability DVTs aims to hold governments or other stakeholders accountable for delivering on a specific
commitment or achieving global targets/goals (e.g., WHA targets). These DVTs tend to focus more on outcome indicators,
and use color-coding/rankings. For example, Champions of Change and NITI Aayog State Nutrition Dashboard
▪ Some DVTs fell under both categories, such as Nutrition India and POSHAN DNPs.
DVTs generally select indicators based on data availability and their goal. Reasons DVT producers select indicators were identified
from interviews:
Align with the UNICEF Highlight a Support short-term
Monitor progress Generate comparisons
framework problem/success results
“At output level, “We provided a “Both nutrition-specific and “The primary indicator was “We decided to include the
indicators were included comparative picture of nutrition-sensitive the risk of deficiency.... In majority of input and output
to monitor the progress district indicators against indicators were selected, order to advise FSSAI, we indicators… because there is
of the program.” state figures.” primarily based on UNICEF wanted to inform the risk of more movement…whereas
Conceptual Framework.” deficiency…” outcome indicators take a
long time to change.”
Note: We inferred DVTs’ goals based on their self-description on their website and output typology, then confirmed via DVT producer interviewsMost DVTs target multiple audiences, most commonly
government stakeholders
Most DVT producers noted broad or multiple target audiences and were not clear about what specific actions they
are trying to encourage among their users
“[Our target audience includes] Policy makers,
“Entire data is in the public domain, everyone
program implementors (program managers) at
could access and use.”
national, state and district levels”
Note: The findings in this slide are based on 7 DVT Producer interviews conducted out of 10 DVTs included in our desk review. The column on ‘Target Audience Geography’ highlights the level
(sub-national, national or unspecified) at which a DVT producer specified their target audience.POSHAN DNPs and the Champions of Change Dashboard have
clear pathways to change with targeted audiences
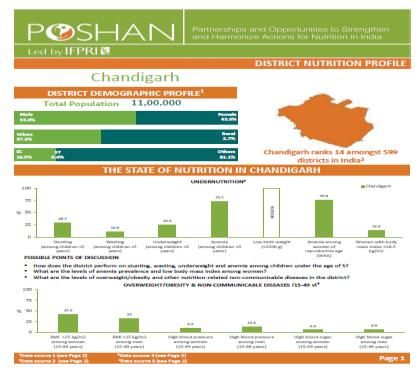
The POSHAN District Nutrition Profiles (DNPs) target specific district-level stakeholders and are regularly used during decision-making
meetings
▪ A focused theory of change with targeted set of decision makers at district level (District Panchayati Raj Officers,
District Program Officers, Medical Officers, etc.)
▪ The goal of DNPs is to create awareness, facilitate evidence-based discussions, and mobilize action for nutrition at the
district level.
▪ Actionable indicators includes coverage indicators, immediate and underlying determinants and impact indicators.
▪ Active engagement strategy: POSHAN team held regular trainings with district officials and nutrition stakeholders on
DVT use in planning and decision making.
20
The Champions of Change Dashboard target district officials to monitor progress of critical indicators in Aspirational District Programme
▪ Target audience are government stakeholders (national, state and district), researchers, and
development partners.
▪ The goal is to track performance of 115 Aspirational Districts Programme* across 5 domains, health
and nutrition being one.
▪ 13 actionable indicators and 31 data points includes input, coverage, and few impact indicators.
▪ Reference user guides are available that lists methodology and indicator selection criteria and data
sources.
▪ Engagement strategy: NITI Aayog coordinates with state and district officials through WhatsApp groups
and regular meetings are held to seek suggestions and dashboard is updated.
*Note: Aspirational Districts Programme has identified 115 districts from 28 states, that are affected by poor socio-economic indicators. Improvement in these districts are aimed towards overall
improvement in human development in India.Key finding #3
1. Information in DVTs may be difficult to interpret
when they include visualizations without
adequate explanation or use different data
sources and definitions for the same indicator
when compared to other DVTs.Multiple DVTs report on the same indicators but use different
definitions and data sources
Indicators have different numerators and/or denominator definitions. Data sources vary in sample
methodology (e.g. whether data was collected at household or facility level) and time and frequency of data
collection, and therefore can yield different value for indicators.
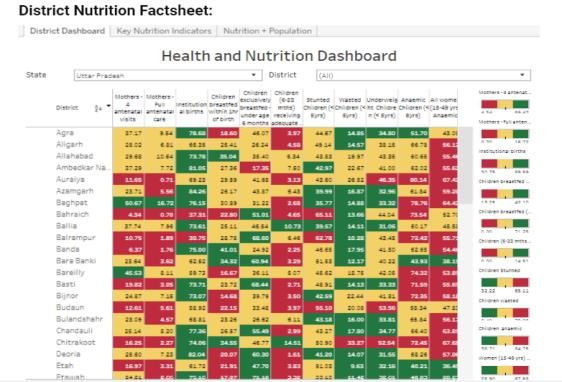
Example of differences in indicator definition and data source: Early initiation of breastfeeding in Araria District, Bihar
DVT INDICATOR DEFINITION DATA SOURCE YEAR POINT ESTIMATES
Champions of Change Percentage of newborns breastfed HMIS, MoHFW 2018 97.91%
within one hour of birth Monthly
NITI State Nutrition Children breastfed within 1 hr at NFHS4 2015 29.6%
Dashboard birth
Nutrition India Early initiation of breastfeeding (0-24 NFHS4 2015 29.7%
months)
POSHAN Number of children aged 0-3 years NFHS4 2015 29.6%
who were breastfed within 1 hour of
birth
Tata NIN Children under age 3 years breastfed Not specified Not specified 30%
within one hour of birth (%)In a few cases, confusion may rise when DVTs use incomplete
definitions or change definitions
1 2 3 4
Time frame Age group Delivery platforms Provider Type
I.e. recall period I.e. the age of the population I.e. location (e.g. community) or I.e. the definition of
of interest service (I.e. ANC) for intervention professionals for an intervention
Example: For children with Example: For Vitamin A Example: For lactating women Example: For births attended
diarrhea who received ORS (%) supplementation in Chitrakoot receiving supplementary food, by skilled birth attendant in
in Chitrakoot of UP, TATA NIN district of UP, POSHAN DNPs POSHAN DNPs specify the Kanpur Nadar district,
specify diarrhea within the specifies children 9-59 months delivery platform as Anganwadi POSHAN DNPs specify types of
past two weeks (68%), who received a Vitamin A dose centers (no data), whereas health providers (doctor,
whereas Champions of Change in the last 6 months (46%), Nutrition India does not specify ANM/nurse/midwife/LHV,
does not specify a time frame whereas Nutrition India does a delivery platform (no data). other health personnel) (79%)
(100%). not specify an age group whereas Nutrition India notes
(46%). only skilled attendant at birth
(79%)
Note: Differences in indicator definition mean that few DVTs did not communicate effectively the indicator definition. In some cases the data source appeared to be the same as they quote the same estimate
but the documentation of the indicator definition was incomplete making, it difficult to confirm.Users may also be confused when visualizations lack information
and values needed for interpretation
Complex diagrams Graphs without labels Point estimates without
reference value*
Nutrition on my RADAR Screen Dashboard used Jan Andolan Dashboard used donut graphs Anemia Mukt Bharat Dashboard showed
radar diagrams, believing them to be helpful for without clear labels, leaving the reader unsure of percentages for different indicators,
policy stakeholders because they consolidate what data was being presented. As depicted without providing any information on
data onto 1 page, show linkages/priorities/gaps, above, it showed different government ministry whether the point estimates were good or
relative ranking, and are user-friendly. However labels, but did not have a graph title or bad, or a reference value for comparison.
there was no user research to confirm if they can indicators.
be interpreted.
*Note: A reference value provides the reader a point of reference whether the presented statistic is good or bad. For example, a reference value could be a national target, or international cut offs for mild, moderate,
or severe anemia.Key finding #4
1. Most DVTs reviewed lack input and intervention
coverage indicators on adolescence, lactation and
newborn careWhen compared to the INIF, Input and intervention coverage
indicators on adolescence, lactation and newborn care are
missing in most DVTs, outcome indicators were common
# = Number of indicators aligning with the India Nutrition
Indicator Framework
= No indicators in this domain
BROOKINGS NUTRITION
ANEMIA
CHAMPIONS JAN NITI STATE NUTRITION NUTRITION POSHAN INDIA ON MY
INDICATORS MUKT TATA NIN
OF CHANGE ANDOLAN NUTRITION ATLAS INDIA DNP HEALTH RADAR
BHARAT
MONITOR SCREEN
Intervention coverage 11 12 4 3 14 18 17 7 17
Adolescence 2
Preconception 2 1 2 4
Pregnancy 4 3 1 1 4 5 5 3 4
Delivery and Postnatal care 2 1 2 3 3 3 3
Newborn care 1 2 1 1
Lactation 1 1 1
Early childhood 5 3 2 1 5 7 5 5
Inputs 3 1
Immediate determinants 3 3 8 5 5 4
Underlying determinants 2 6 5 5 2
Nutrition outcomes 4 3 5 8 7 9 9 4 5
Note: The table indicates availability of various types of indicators across DVTs against the India Nutrition Indicator Framework . Due to different theory of change of each DVT and India Nutrition
Indicator Framework (2020) wasn’t available when most DVTs were designed, this information aims to only inform the type and number of indicators available across domains.To achieve nutrition outcomes, data on input and coverage
interventions are important to monitor progress and improve
performance
Domains Findings Indicator examples
▪ 2 out of 10 DVTs have included a few input indicators ▪ Percentage of stocks available for IFA tablets- Red (Adult)
(AMB Dashboard)
Input
indicators
▪ 9 out of 10 DVTs have at least one coverage indicator ▪ Percentage of girls (6-12 class) provided 4 IFA tablets in
▪ Only 1 DVT has coverage indicators in schools (AMB Dashboard)
adolescence ▪ Supplementary food during lactation (POSHAN DNPs)
Intervention ▪ 3 DVTs include lactation coverage indicators, and ▪ Children who received a health check-up after birth from
coverage ▪ 4 DVTs have newborn care coverage indicators. a doctor /nurse/LHV/ANM/midwife/other health
personnel within 2 days of birth (%) (Tata NIN)
▪ 6 out of 10 DVTs have any MIYCN behavior indicators ▪ Early initiation of breastfeeding (0-24 months) (Nutrition
India)
MIYCN
▪ 5 out of 10 DVTs have any underlying determinants ▪ Percentage of households with individual household
indicators. latrines (Champions of Change)
Underlying
determinants
*Notes: Input indicators refer to the resources needed to support the implementation of an intervention or program, such as, financial and human resources, training, and infrastructure; Coverage indicators reflect
the extent to which people in need actually receive important health and nutrition interventions; MIYCN indicators are immediate determinants, interventions in the first two years of life. Underlying determinants
include interventions such as social safety nets, sanitation programs, women’s empowerment and agriculture programs have the potential to improve nutrition. Outcome indicators included low birth weight,
stunting, underweight, wasting, childhood overweight, and anemia among children, adolescents, and WRA, high blood pressure and high blood glucose among adults.Key finding #5
1. Half of the DVTs reviewed provide user support,
such as user guides, and/or trainings on nutrition
data, interpretation and its use.DVT producers are currently providing support to users in three ways
Approximately half of DVTs provided some sort of support to users on nutrition data, interpretation
and its use. The three main types of support to users included:
1 2 3
…
User Guides Training WhatsApp Group
Example: Tata NIN has Example: Champions of Example: Champions of
documentation on their Change held a two-day training Change said they use
webpage explaining what during their launch for District WhatsApp groups to follow up
content is available on each tab Magistrates and District and address problems of their
of their DVT, how they Information Officers (NIC team at state and district level
aggregated data, indicator officers)
definitions, and sourcesKey finding #6
Few DVTs deployed systems for soliciting user
feedback in DVT development process.User input is lacking in the DVT development and update process
DVT producers have not adequately engaged users before development to understand user needs and data
literacy
Only 2 DVTs did some form of user research before Many producers aimed to keep their DVTs “simple”*,
developing their DVT however few mentioned considering their audience’s data
literacy in the design
Example: POSHAN DNPs did a pilot study with development Example: “We wanted to keep our design simple
partners (part of their target audience at the district level) to and colorful easy for users from different backgrounds to
better understand their engagement with data and identified interpret.”
different mechanisms of data engagement depending on the
context. Results of this pilot study informed DNP revisions,
including translations into Hindi.
No DVT specified clear plans to update DVT website or visualization features based on user needs and feedback
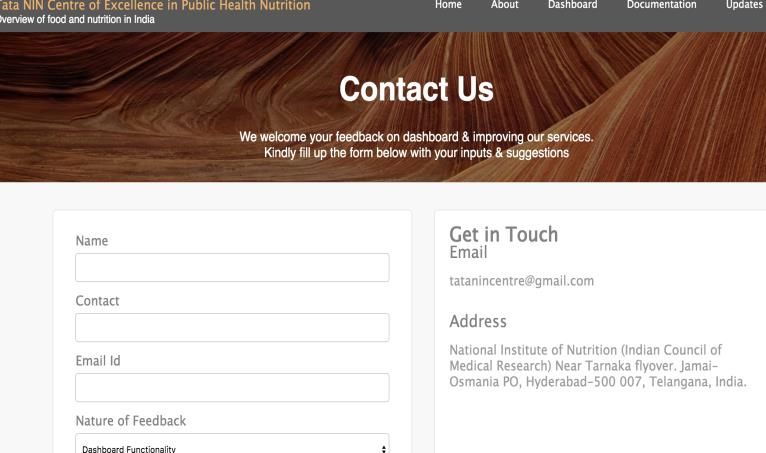
*Note: DVT Producers did not describe/ define what they considered ‘simple’ and may have varied opinions on what’s considered simpleExamples of user feedback form related to dashboard and program
TATA NIN Dashboard and Anemia Mukt Bharat Dashboard have a feedback form with questions on their portal. POSHAN DNPs and
Nutrition India Dashboard have provided contact information for suggestions.
Tata NIN Dashboard Feedback Form Anemia Mukt Bharat (AMB) Dashboard Feedback Form:
Positive policy impact of DVT study in India
Feedback form asks for user contact details, feedback In response to this landscaping review, AMB Dashboard added
on dashboard (nature of query, specific request and a page for user feedback on dashboard and program.
other queries) to improve services Monthly web analytics data on:
▪ Number of visitors/hits are collated
▪ Top Download/ viewed
▪ Users by country
Sources: https://anemiamuktbharat.info/feedback, https://www.dashboard.nintata.res.in/#/contact
Notes: There may be differences in terms of the approach, information collected, and usefulness of information gathered via active and passive feedback. Active = DVT seeking out feedback in
person or over email vs passive = something that just sits on the DVT website for anyone who has thoughts.How are users using nutrition DVTs in India: Early findings
We received 35 responses to our online survey from nutrition
data users in India
   Survey aimed to answer three questions                      About survey
   ▪ What type of data and DVTs are the nutrition community    ▪ Created using Google Forms
     using?                                                    ▪ Disseminated through email to targeted nutrition
   ▪ What type of indicators users want to use, but are not      stakeholders (development partners, govt. officials)
     accessible?                                               ▪ Data collected: October - December 2019
   ▪ What are challenges users face in accessing and using     ▪ 35 responses received
     nutrition data?                                           ▪ Allowed multiple responses to questions

                                                     User background
 Who do you work for?                                           Geographic scope of work*
                                                                          Block

                                                                        District

                                                                          State

                                                                       National

*Multiple responses were allowed
India nutrition DVTs accessed by respondents
% Respondents who accessed/used nutrition DVTs in last 12 months*
n=35
POSHAN District NITI Aayog State Anemia Mukt Jan Andolan Nutrition Atlas Nutrition India TATA NIN Center The Brookings
Nutrition Profiles Nutrition Bharat (POSHAN Dashboard for Excellence in India Health
Dashboard Abhiyaan) (POSHAN Public Health Monitor
Abhiyaan) Nutrition
Most DVTs were used to access nutrition data for reference and tracking progress
*Multiple responses were allowedRespondents use DVTs to access a wide range of nutrition data,
yet critical gaps exist
% Respondents who were not able to access this data from DVTs *
n=35
Input data Intervention coverage Determinants/drivers of Nutritional outcomes Nutrition sensitive Others
malnutrition
Most users were unable to access data on – input, determinants of malnutrition and nutrition-sensitive in DVTs. These findings
corroborate with desk review indicator mapping, where we found similar data availability challenges.
Multiple responses were allowedMost common challenges faced among respondents in using
nutrition data online, not only in DVTs
1 Multiple data sources for some interventions, determinants and outcomes, makes
user unsure which one to reference
2 Data quality cannot be trusted / is unreliable
3 Measurement and reporting issues in administrative data sources
4 Different analytic approaches at national/state/district level
*Multiple responses were allowedRecommendations
Key Recommendations

     Build DVTs around a theory of change, including identifying (a) which decisions by which
     stakeholders they aim to support, and (b) what actions are needed to deliver change.

     Collaborate with other Indian DVT producers to improve synergies across DVTs, in terms of
     goal, design and uniformity to indicator definitions.

     Include additional input and coverage indicators that align with the DVT’s theory of change.

     Continue to support users to better use and interpret the data from DVTs.

     Further strengthen the design and use of the DVT, by conducting user research to
     understand data literacy and user needs.
You can also read