Nowcasting Unemployment Rates with Smartphone GPS data - MASTER
←
→
Page content transcription
If your browser does not render page correctly, please read the page content below
Nowcasting Unemployment Rates with
               Smartphone GPS data

                                Daisuke Moriwaki1

          CyberAgent, inc., 1-12-1 Dogenzaka Shibuya-Ku, Tokyo, Japan
                     moriwaki daisuke@cyberagent.co.jp

      Abstract. Unemployment rate is one of the most important macroeco-
      nomic indicators. Central governments and market participants heavily
      rely on the index to assess the economies. However, official statistics
      of unemployment rate are released infrequently with substantial delay.
      Prediction of official statistics of labor market will be helpful for these
      authorities as well as private companies and even workers. In this paper,
      we combine massive location data coming from smartphones and mixed
      data sampling (MIDAS) techniques to predict current unemployment
      rate in Japan. We found GPS data is very useful to predict the status of
      labor markets.

      Keywords: GPS data · MIDAS · mixed data sampling · location data ·
      unemployment rate · time series analysis · macroeconomic policy · now-
      casting · forecasting.

1   Introduction
Unemployment rate is widely considered as one of the most important macroe-
conomic indices among the central governments. The U.S. administration prior-
itizes job security. The Federal Reserve Bank (FRB), one of the most important
players in the global economy, almost always refers to unemployment rates in its
statement. The index also gathers attention among the market participants.
    Although its importance is widely recognized, the index has a serious prob-
lem. Official statistics authorities like the U.S. Bureau of Labor Statistics (BLS)
and Eurostat report unemployment rates on monthly basis but the numbers are
for a month ago. The delay is caused by the time spent on the distribution and
collection of survey questionnaires, and data processing. For prompt macroe-
conomic policy intervention and efficient market functioning, important indices
like unemployment rates should be reported as quick as possible. Catastrophic
economic event like financial crisis during 2007-2009 must be noticed by the
government and important decision makers in the private sector before it gets
seriously worse.
    The need for the correct knowledge of current economic status leads to a
large literature of nowcasting [1, 2] and introduced to the real world. The FRB
of Atlanta has been continuously updating real-time estimates of GDP using
monthly economic statistics in their “GDPNow” website[3, 4].
2 D. Moriwaki
While the economic statistics rarely uses highly frequent data (e.g. hourly,
daily, or weekly), a massive volume of high frequency data have become available.
GPS log data is one instance. Many location-based apps such as maps, entertain-
ment, game, and fitness collect users’ geo-location information if the users give
permissions. These data are primarily utilized for improvement of user experi-
ence as well as advertising, recommendation and business intelligence. However,
we see fast-growing literature on statistical analysis using collected GPS logs in
a variety of areas including prediction of demographics and preference, detection
of home, mode detection, and population analysis to name a few. [5–9].
Recently, “alternative data”, or non-traditional has been embraced in the
non-academic area. In the financial industry, more and more market participants
start using alternative data including geo-location data to make investment deci-
sions.[10] Investors like hedge funds predict sales by location data.[11] Rigorous
consideration is needed in the field.
In this paper, we introduce GPS data to nowcasting literature and develop a
unique model predicting current unemployment rates with GPS log. Our evalu-
ation proves that GPS data has substantial predictive power for number of the
unemployed persons. In the following sections, we first briefly review literature
in Section 2, then explain our data in Section 3. Section 4 gives the detail of our
model and Section 5 evaluates it. Finally Section 6 concludes.
2 Related Works
To the best of our knowledge, this is the first attempt to forecast unemployment
rates with GPS data. Nowcasting of labor market statistics with alternative data
has been actively studied since Varian and Choi [12] suggested the potential pre-
dictive power of search query data. The earliest attempts to forecast unemploy-
ment rate with search query reveal the predictive power of query data for labor
market[13–15] and many studies follow (e.g. [16–18]). While most of the paper
utilize ARIMA-type models, Onorante and Koop [19] apply Dynamic Model Se-
lection/Averaging and Scott and Varian [20] develop the Bayesian structural
time series model.
The present work considers mixed data sampling (MIDAS) scenario pioneered
by Ghysels et al. [21] in which the high frequency data is used to forecast in-
frequent data.The idea of MIDAS is to represent frequent data in a parsimo-
nious way. A natural extension is a situation where high dimensional (large p),
small data points (smaller n) and high frequency predictive variables are present.
Various models combine feature selection techniques and MIDAS are proposed
[22–24]. Recently Uematsu and Tanaka [25] showed a simple penalized regression
without MIDAS technique performs well for GDP forecasting with high frequent
data. While these research focus on monthly official statistics as high frequent
data and quarterly data (usually GDP) as target. The present paper extends
MIDAS to much more high frequent alternative data.
Moreover, unlike existing models, our model is unique in its purely static
form, which reveals the predictive power of GPS itself.Nowcasting Unemployment Rates with Smartphone GPS data 3
3 Data
In this section, we explain the data for the target (unemployment rates) and the
predictor (GPS logs) in detail.
3.1 The Unemployment Rate
The unemployment rate is defined as “the number of unemployed persons as a
percentage of the total number of persons in the labour force”[27]. In mathe-
matical form,
u = y/l, (1)
where y and l denote the number of unemployed persons and labor force.
The number of unemployed persons and persons in the labor force are usually
surveyed by the government on monthly basis. In Japan, monthly Labor Force
Survey takes the role. The survey collects information about labor status of ap-
proximately 40,000 households during the last week of each month. To estimate
the number of unemployed persons, we take advantage of the fact that they have
strong incentives to go to public employment service offices. It is mandatory for
Japanese unemployed workers to visit one of public employment services offices
to be eligible for unemployment insurance benefits. Furthermore, they have to
visit the office at least once a month to maintain their eligibility[28]. We can
easily presume more visitors implies more unemployed persons.
The number of the visitors of public employment service offices could be
counted by the offices and collected by the central government to produce official
statistics of the number of visitors. In Japan, such a dataset is unavailable.
Possible reason for that is the cost. The number of visitors should be counted
and reported to the central authority in all 544 offices and the information should
be processed and reported by the central authority on daily basis, which requires
a substantial overhaul of the current system. On the other hand, GPS data can
be easily gathered through any app with permission from users.
Once we get the number of unemployed persons, we need the number of labor
force to divide it. Unfortunately finding clues for the number of labor force from
the GPS data is not very easy. However, labor force is far less volatile and
thus the prediction error is relatively small. A simple ARIMA model produces
accurate predictions with the RMSE of 220 thousand and MAE of 180 thousand
when the mean of labor force is 66 million.
In short, we estimate seasonally-adjusted unemployment rate uSA t as,
ûSA = ŷ SA /ˆlSA , (2)
SA GPS U
ŷ = ŷ /s (3)
where sU is seasonality index for unemployed persons. In the following sections,
we first focus on the estimation of y rather than u. Resulting estimates of un-
employment rate is shown in Section 5.4 D. Moriwaki
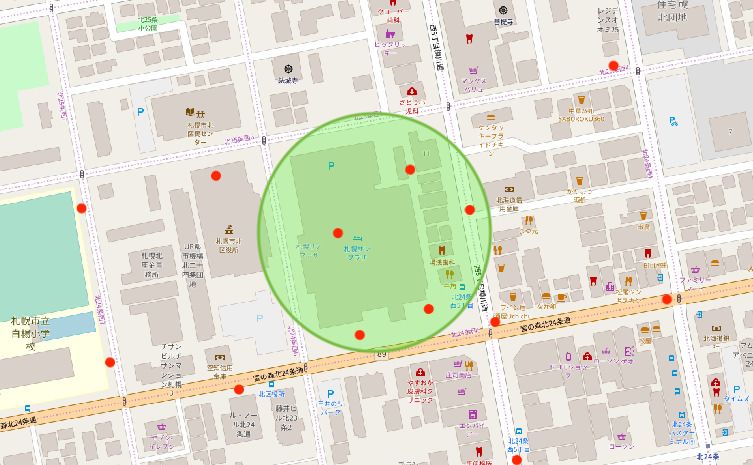
Fig. 1. Image of GPS data and an employment service office. Logs (red points) found
in the green-colored area are counted.
3.2 The GPS Data
Throughout this paper, we heavily rely on GPS logs from smartphones. Many
mobile phone apps collect users’ geographical location information to improve
their services when the users give permission. We use completely annonymized
version of GPS data taken from Jan 2016 to April 2019 (40 months). The data
consists of four columns: hashed id, latitude, longitude and timestamp. We count
the number of the persons who possibly visit each employment service office
daily basis. The resulting data consists of N (the number of offices) × D (the
number of days) data points. We decide a person visits an employment service
office when one or more logs are found within specific areas covering each office
(Figure 1). Since mobile phone determines its location based on the signals from
GPS satellites, the accuracy deteriorates during a user is inside buildings or
surrounded tall buildings due to the reflections of signals. Furthermore, the logs
are recorded infrequently to reduce battery consumption. To circumvent risk that
we fail to count the person inside building due to the inaccuracy and infrequency
of the nature of GPS data, the areas have some buffer outside the building.
The areas are set based on the size of the offices. To get size of the buildings we
applied OpenCV[30] to map. The number of logs represent the number of visitors
who has installed and given permission to specific app(s). The numbers are
affected by whether the smartphone is turned on/off, whether the apps are turned
on or not, and whether GPS logs are accurate. Moreover, note that visitors are
not always unemployed persons. Visitors include consultants of the office, HR
staffs from companies and other related people. Nevertheless, the numbers are
expected to include some information about the number of unemployed. The
counts are normalized by dividing by the total number of the daily unique users
to mitigate the effect from the change in data volume.
4 Nowcasting Model
In this section, we set up a nowcasting model and explain the estimation. Algo-
rithm 1 summarizes the whole procedure.Nowcasting Unemployment Rates with Smartphone GPS data 5
Algorithm 1 Nowcasting of The Number of Unemployed Persons
Require: Daily GPS data {xH
n,1− 29
, xH
n,1− 28
, · · · , xH
n,t̄− d̄ }n∈{1,N }
30 30 30
Monthly data for the number of unemployed persons from official statistics {yt }t̄−lag
t=1
, lag = {1,2}
Set {φi }30
i=0 according to normalized beta distribution (k, α, β) = (1, 1.3, 1), where k
is normalization factor
for n = 1, · · · , N do
Impute {xH d̄−1 , xH d̄−2 , · · · , xH
n,t̄ } with univariate ARIMA model
n,t̄− 30 n,t̄− 30
for t = 1, · · · , t̄ do
d−1
calculate xL φ i xH
P
n,t = n,t−i/30 .
i=0
end for
t̄−lag t̄−lag t̄−lag
Discard {xL n,t }t=1 if corr({xL n,t }t=1 , {yt }t=1 ) ≤ 0.3
end for
Learn f from (yt , {xL n,t }n , zt )t≤t̄−lag
Forecast ŷt̄ = f (xL n,t̄ zt̄ )
,
4.1 The MIDAS Model
Since unemployment rates are monthly statistics, it is not straightforward to
develop a predictive model using daily data. As discussed in Section 2, such a
situation is called “mixed data sampling” or MIDAS in short. We employ a most
simple variant of MIDAS models, “bridge equation”. Ghysels and Marcellino
(2018)[31] provides detailed explanation on MIDAS models. Notations used in
this paper are based on the book. Suppose yt is a monthly (low frequency)
outcome variable to be predicted and xHn,t−i/d is N daily (high frequency) feature
variables. The two variables themselves are not compatible with each other. We
need to “bridge” high frequency data xH L
n,t s to low frequency xt . That is,
30
X
xL
n,t = φi x H
n,t−i/30 (4)
i=0
30
P
where φi s are positive scalars holds φi = 1. Hereafter we assume every month
i=0
has 31 days regardless of the month. We pad zeros to the first d∗ days for months
with fewer than 31 days. For example, non-Olympic year February (28 days) goes
like (0, 0, 0, 1st day, · · · , 28th day). Then with a suitable machine learning model
f , one can forecast yt .
ŷt = f (xL L
1,t , · · · , xN,t , zt ), (5)
where zt includes month and year.
4.2 Estimation of Parameters
We have two sets of parameters to be estimated. One is a vector of φ which
transform daily data to monthly data. The other is parameters in the model6 D. Moriwaki
0.06
parameter
0.04 alpha:1.3, beta:1
alpha:1.1, beta:1
phi
alpha:1.5, beta:1
0.02 alpha:1.3, beta:1.02
alpha:1.3, beta:0.98
0.00
0 10 20 30
i
Fig. 2. Values of φ by paramters.
f , which gives prediction of y from x. In MIDAS literature, weight vector φ
is chosen from several options.[21] Here we tried linear scheme φi = 1/d and
α−1 β−1
beta(i/30,α,β)
normalized beta φi = P 30 where beta(x, α, β) = x (1−x)
Γ (α)Γ β
Γ (α+β)
.
beta(i/30,α,β)
i=0
We go with normalized beta as it outperforms linear scheme. β governs the
peak of the weights and α governs the slope of the weights (see Figure 2). Since
official monthly labor survey collects data during the last week of the month, it
is reasonable to set β = 1. Finally α is chosen according to the resulting RMSE
and MAE by grid searching.1
For forecasting model f we need to consider that the number of employment
service offices (more than 500) is much larger than the number of data points
(40 months). This means standard MIDAS regression is not applicable2 . We pick
up standard Random Forest and L1-regularized least squares (LASSO). More
flexible regression models such as SVM and neural netsare not suitable for our
short time series data. Furthermore, when evaluating the model, training data
gets much more shorter. Our model should not learn data from the future. We
evaluate the model for data from May 2018 to Apr 2019. It leaves only 28 months
to learn when evaluated at May 2018. Random forest out-perform LASSO for
the most of the cases, we go with random forest3 .
4.3 Imputation of Missing Data
Since our goal is to nowcast unemployment rate as quick as possible, we want to
estimate unemployment rate any day in month. Suppose one day, let’s say March
29 2019, one wants to forecast unemployment rate for March 2019. he has official
unemployment rates through February 2019 (released March 29 2019) and GPS
1
The weights are generated by R package midasr.
2
R package midasr does not have implementation for regularization.
3
We used R package ranger[29]Nowcasting Unemployment Rates with Smartphone GPS data 7
data through 28 March 2019. Then we need impute missing GPS data for three
days (29-31) to conduct forecast. We use standard ARIMA models to impute
missing GPS data. The models are run separately for each office. Parameters are
automatically selected by auto.arima of R pakcage forecast.
Alternatively, we can estimate model without imputation by using only avail-
able data. However, the number of available days of data changes day by day
and we need a lot of predictive models to be estimated (p.462 in [31]). Here we
resort to one predictive model with imputation for simplicity.
4.4 Feature Selection
As already discussed in Section 2, feature selection is another important task
here. Although random forest automatically selects informative feature vari-
ables, heuristic feature selection will benefit. Since the number of visitors to
each offices are expected to positively correlate with the number of unemployed
persons, offices with negative correlation is dominated by noise. We first calcu-
late correlation of the data from each offices and official statistics for the number
of unemployed persons in training period. Then we discard data from the offices
with correlation smaller than 0.3. This procedure, however, leaves more than a
hundred of offices.
5 Evaluation
In this section, we evaluate our predictive model by comparing baseline models.
We first examine model for the number of unemployed persons and then one
for unemployment rates. Throughout the section we utilize root of mean square
error (RMSE) and mean absolute error (MAE) of the model for 12 months of
rolling forecast. RMSE is defined as
1/2
Apr2019
X
RMSE = (yt − Ê[yt |x̂L
t ])
2
for GPS (6)
t=May2018
1/2
Apr2019
X
RMSE = (yt − Ê[yt |yt−lag , . . . , y1 ])2 for ARIMA (7)
t=May2018
where yt denotes the ground truth taken from official statistics and lag indicate
the number of steps of the forecasts. Note that x̂L is estimated using information
available at t − lag. MAE is absolute error version of RMSE.
5.1 Nowcast for the Number of Unemployed Persons
Figure 3 shows one-month-ahead (ŷt|t−1 ) forecasts by our model (GPS) and
ARIMA model with ground truth. The specification of ARIMA model is chosen
by auto.arima. It takes account into seasonality. As we’ve already seen in Section8 D. Moriwaki
3 Days Missing No Missing
1.8
Unemployed Person in Million
1.7 source
ARIMA
GPS
1.6 True
1.5
Jul 2018 Oct 2018 Jan 2019 Apr 2019 Jul 2018 Oct 2018 Jan 2019 Apr 2019
month
Fig. 3. One month ahead forecast (yt|t−1 ) by proposed model (GPS), ARIMA model,
and ground truth (true)
3.2, forecasting before the end of the month needs some imputation. The right
panel shows forecast without missing data while the left shows forecast with three
days missing. Since there is a substantial delay in official statistics, imputation
is not necessary in the most of the cases.
In general, the GPS model (green solid line) well predicts true values (blue
dot-dashed) with several exceptions (May 2018, Jan 2019, and Mar 2019). Com-
pared to ARIMA (red dashed line), the predictions of the GPS model are less
volatile. In particular, ARIMA tends to mimic the level of the last month while
the GPS model does not. This is reasonable because GPS model is a simple static
model and does NOT have an autoregressive characteristic. Figure 4 shows the
two months ahead forecasts (yt|t−2 ). The right hand panel shows the forecasts
based on data with five days missing while the left miss fifteen days of GPS log.
Compared with one month ahead forecasts, two months ahead forecasts shows
larger errors for several months (Feb 2019 and Oct 2018). However, the results
are much better than ARIMA model.
Table 1 summarizes the performance of the models. GPS models out-perform
ARIMA model both one month ahead and two months ahead forecasts. The
accuracy is almost same for one or two month ahead forecasts. The only difference
between one month ahead and two month ahead GPS models is that two month
ahead models do not learn data of just before the target month (i.e. yt−1 ).
Learning the last month of the target month might not be so important.
5.2 Forecasts for Unemployment Rates
Finally, we evaluate the predictive performance of our GPS model for unem-
ployment rates. Unfortunately, we do not have a good predictive model for labor
force. We resort to an ARIMA model for prediction of seasonaly-adjusted laborNowcasting Unemployment Rates with Smartphone GPS data 9
15 days missing 5 days missing
Unemployd Persons in Million
1.8
source
1.7 ARIMA
GPS
True
1.6
1.5
Jul 2018 Oct 2018 Jan 2019 Apr 2019 Jul 2018 Oct 2018 Jan 2019 Apr 2019
month
Fig. 4. Two month ahead forecast (yt|t−2 ) by proposed model (GPS), ARIMA model,
and ground truth (true)
One Month Ahead Forecast RMSE MAE Forecast.Available
GPS, No missing 8.27 6.69 26-31days before
GPS, 3d missing 8.37 6.66 28-34days before
ARIMA 10.23 8.55 28-34days before
Two Month Ahead Forecast RMSE MAE Forecast Available
GPS, 5d missing 8.75 7.03 31-37days before
GPS 10d missing 8.49 6.81 36-42days before
GPS 15d missing 8.51 6.91 41-47days before
ARIMA 10.05 8.25 56-64days before
Table 1. Performance of forecast models of the number of unemployed persons. The
parameters of ARIMA model are automatically chosen according to bic.10 D. Moriwaki
One month Two month
0.027
0.026
source
0.025
ARIMA
urate
GPS+ARIMA
0.024
True
0.023
0.022
Jul 2018 Oct 2018 Jan 2019 Apr 2019 Jul 2018 Oct 2018 Jan 2019 Apr 2019
month
Fig. 5. Forecasting of unemployment rates
force and estimate unemployment rate. That is,
ŷ GPS /sU
ûSA,GPS−ARIMA = , (8)
ˆlSA,ARIMA
where sU is seasonality index. In Section 5.1, the GPS model has already beaten
ARIMA model. This time we deployed another baseline model: an ARIMA model
directly predicts seasonally adjusted unemployment rates. The results (Table 2)
show our GPS-ARIMA model is inferior to the ARIMA model for one month
prediction horizon (ût|t−1 ) but is competitive for two month prediction horizon
(ût|t−2 ). As shown in Figure 5, the up-and-down of the ground truth is better
predicted by ARIMA while the absolute values are better predicted by GPS-
ARIMA (e.g. Jul 2018, Nov 2018, Jan 2019).
The disappointing result is actually no surprise. The existing literature shows
that the predictive power of alternative data is sometimes weak.[16, 19] Also, the
better predictive model for labor force could improve the results.
One Month Ahead RMSE ×1000 MAE×1000
GPS, No missing 1.22 1.00
ARIMA 1.16 0.99
Two Month Ahead RMSE ×1000 MAE×1000
GPS 10days missing 1.25 1.02
GPS 15days missing 1.22 0.97
ARIMA 1.19 1.05
Table 2. Performance of predictive model for unemployment rates. RMSE/MAEs are
inflated by 1,000. For example, 1.0 of MAE implies 0.1% mean absolute error.Nowcasting Unemployment Rates with Smartphone GPS data 11 6 Conclusion In this paper, we examined the usefullness of GPS log data for nowcasting for unemployment rates. First we prove that model using GPS data without the lagged dependent variable out-performs a standard ARIMA model for prediction of the number of unemployed persons. Then we found that the a combination of GPS and ARIMA model is only competitive for longer prediction horizon when applied to unemployment rates. The predictive performance could be improved by several ways. First, as described in Section 2, various modern techniques for MIDAS and high dimentional data are available. Second, using GPS data as an independent variable in autoregressive model is another good candidate. Third, more sophisticated treatment for GPS log is expected to improve the quality of the data. Counting log is simple but the literature on GPS trajectories suggests many other technique to improve accuracy. Nevertheless, we hope the paper presents new idea for both nowcasting of economic statistics and utilization of GPS data. References 1. Giannone, D., Reichlin, L., Small, D.: Nowcasting: The real-time informational con- tent of macroeconomic data. Journal of Monetary Economics. 55, 665676 (2008). https://doi.org/10.1016/j.jmoneco.2008.05.010. 2. Babura, M., Giannone, D., Modugno, M., Reichlin, L.: Now-Casting and the Real- Time Data Flow. In: Handbook of Economic Forecasting. pp. 195237. Elsevier (2013). https://doi.org/10.1016/B978-0-444-53683-9.00004-9. 3. Federal Reserve Bank of Atlanta: GDPNow, https://www.frbatlanta.org/cqer/research/gdpnow.aspx. Last accessed 11 June 2019 4. Higgins, P.C.: GDPNow: A Model for GDP Nowcasting. SSRN Electronic Journal. (2014). https://doi.org/10.2139/ssrn.2580350. 5. Sangaralingam, K., Verma, N., Ravi, A., Datta, A., Chugh, V.: Predicting Age & Gender of Mobile Users at Scale - A Distributed Machine Learning Approach. In: 2018 IEEE International Conference on Big Data (Big Data). pp. 18171826. IEEE, Seattle, WA, USA (2018). https://doi.org/10.1109/BigData.2018.8621942. 6. Ravi, A., Sangaralingam, K., Datta, A.: Predicting Consumer Level Brand Pref- erences Using Persistent Mobility Patterns. In: 2018 IEEE International Confer- ence on Big Data (Big Data). pp. 19861991. IEEE, Seattle, WA, USA (2018). https://doi.org/10.1109/BigData.2018.8622225. 7. Vanhoof, M., Reis, F., Ploetz, T., Smoreda, Z.: Assessing the Quality of Home De- tection from Mobile Phone Data for Official Statistics. Journal of Official Statistics. 34, 935960 (2018). https://doi.org/10.2478/jos-2018-0046. 8. Sia-Nowicka, K., Vandrol, J., Oshan, T., Long, J.A., Demar, U., Fotheringham, A.S.: Analysis of human mobility patterns from GPS trajectories and contextual information. International Journal of Geographical Information Science. 30, 881906 (2016). https://doi.org/10.1080/13658816.2015.1100731. 9. Shimosaka, M., Hayakawa, Y., Tsubouch, K.:Spatiality preservable factored Poisson regression for large-scale fine-grained GPS-based population analysis. AAAI2019, The Thirty-Third AAAI Conference on Artificial Intelligence (AAAI-19), 2019/1
12      D. Moriwaki

10. Opimas: Alternative Data - The New Flontier in Asset Management,
   http://www.opimas.com/research/217/detail/.
11. Advan           Research:         Advan          Location        White        Paper,
   https://www.advan.us/research.html.
12. Varian, H.R., Choi, H.: Predicting the Present with Google Trends. Social Science
   Research Network, Rochester, NY (2009).
13. Askitas, N., Zimmermann, K.F.: Google Econometrics and Unemployment Fore-
   casting. Applied Economics Quarterly (formerly: Konjunkturpolitik). 55, 107120
   (2009).
14. DAmuri, F., Marcucci, J.: Google It! Forecasting the US Unemployment
   Rate with A Google Job Search Index. SSRN Electronic Journal. (2010).
   https://doi.org/10.2139/ssrn.1594132.
15. Suhoy, T.: Query Indices and a 2008 Downturn: Israeli Data. 34.(2009)
16. Pavlicek, J., Kristoufek, L.: Nowcasting Unemployment Rates with Google
   Searches: Evidence from the Visegrad Group Countries. PLOS ONE. 10, e0127084
   (2015). https://doi.org/10.1371/journal.pone.0127084.
17. Anvik, C., Gjelstad, K. (2010).: Just Google it. Forecasting Norwegian unemploy-
   ment figures with web queries.
18. Naccarato, A., Falorsi, S., Loriga, S., Pierini, A.: Combining official and Google
   Trends data to forecast the Italian youth unemployment rate. Technological Fore-
   casting and Social Change, 130, 114-122.(2018)
19. Onorante, L., Koop, G.: Macroeconomic Nowcasting Using Google Prob-
   abilities. In: Proceedings of the 1st International Conference on Advanced
   Research Methods and Analytics. Universitat Politcnica Valncia (2016).
   https://doi.org/10.4995/CARMA2016.2016.4213.
20. Scott, S.L., Varian, H.R.: Predicting the present with Bayesian structural time se-
   ries. International Journal of Mathematical Modelling and Numerical Optimisation.
   5, 423 (2014).
21. Ghysels, E., Sinko, A., Valkanov, R.: MIDAS Regressions: Further Results and
   New Directions. 49. Econometric Reviews 26.1 (2007): 53-90.
22. Marsilli, C.: Variable Selection in Predictive MIDAS Models (2014). Banque de
   France Working Paper No. 520. https://doi.org/10.2139/ssrn.2531339
23. Siliverstovs, B.: Siliverstovs, Boriss. ”Short-term forecasting with mixed-frequency
   data: a MIDASSO approach.” Applied Economics 49.13 (2017): 1326-1343.
24. Mogliani, M.: Bayesian MIDAS Penalized Regressions: Estimation, Selection, and
   Prediction. arXiv:1903.08025 [econ]. (2019).
25. Uematsu, Y., Tanaka, S.: Highdimensional macroeconomic forecasting and vari-
   able selection via penalized regression. The Econometrics Journal. 22, 3456 (2019).
   https://doi.org/10.1111/ectj.12117.
26. Dumičić, K., Časni A Č., Žmuk, B.: Forecasting Unemployment Rate in Selected
   European Countries Using Smoothing Methods. International Journal of Social,
   Education, Economics and Management Engineering. 9, 932 (2015).
27. International         Labour         Organization:        Unemployment         Rate,
   https://www.ilo.org/ilostat-files/Documents/description UR EN.pdf. Last ac-
   cessed June 11, 2019
28. Employment         Security      Bureau,      Ministry     of    Health,     Labour,
   and     Welfare:     Procedures     of    Employemnt      Insurance    in Japanese,
   https://www.hellowork.go.jp/insurance/insurance procedure.html Last accessed
   June 11 2019
Nowcasting Unemployment Rates with Smartphone GPS data            13

29. Wright, M.N., Ziegler, A.: ranger: A Fast Implementation of Random Forests for
   High Dimensional Data in C++ and R. Journal of Statistical Software. 77, (2017).
   https://doi.org/10.18637/jss.v077.i01.
30. Bradski, G.: The OpenCV Library, Dr. Dobb’s Journal of Software Tools, (2000)
31. Ghysels, E., Marcellino, M.: Applied Economic Forecasting Using Time Series
   Methods. Oxford University Press. (2018).
You can also read