2020: What the data showed - UBS Evidence Lab
←
→
Page content transcription
If your browser does not render page correctly, please read the page content below
UBS Evidence Lab

2020: What the data showed
A look back at the top 20 charts from this year

November 19, 2020
UBS Evidence Lab
                                                                       2020 Highlights

         The beginning                                          Pg 2                     Streaming                                        Pg 12
         Unemployment                                           Pg 3                     US summer surge                                  Pg 13
         Retailers                                              Pg 4                     Restaurants                                      Pg 14
         Hospitals                                              Pg 5                     Housing                                          Pg 15
         Stockpiling                                            Pg 6                     Return to work                                   Pg 16
         Popular products                                       Pg 7                     Fast fashion                                     Pg 17
         Air quality                                            Pg 8                     Social media                                     Pg 18
         Spending habits                                        Pg 9                     Shipping                                         Pg 19
         Robinhood                                             Pg 10                     Air travel                                       Pg 20
         China recovery                                        Pg 11                     Education apps                                   Pg 21
                                                                                                        … and the latest insights (November 2020)

Interested in learning more about UBS Evidence Lab? Email us                                                                                        1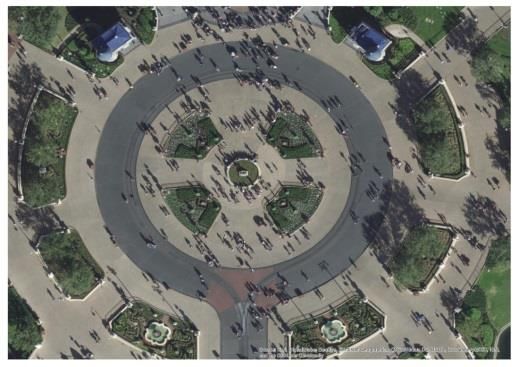
UBS Evidence Lab

The beginning                                                                         Regional Exposure: Percent of China QSR Locations in Hubei Province
                                                            Regional Exposure: Percent of China Locations in Hubei Province
                                                                                       Xiaohuya                                                             79%
                                                                                     Zhouheiya                     25%
                                                                                      Jiumaojiu               7%
Which businesses were most exposed                                                       Yiddtea             6%
                                                                                Xiao Long Kan               5%
during the COVID-19 pandemic in                             Luckin Coffee Coming Soon Stores                5%
China?                                                                            Dairy Queen               5%
                                                                                             KFC           4%
                                                                    Luckin Coffee Open Stores              4%
                                                                              Haidilao Hot Pot            4%
In February, UBS Evidence Lab looked at what                                       McDonald's             4%
percentage of companies' China locations were                                    Happy Lemon              4%
                                                                                       Pizza Hut          4%
in Hubei Province, where the outbreak began.                                             Kungfu          4%
Among quick-service restaurants:                                                      Starbucks          3%
                                                                                          Juewei         3%
•         79% of Xiaohuya's locations were in the                                           Xibei       3%
          province.                                                                Burger King          3%
                                                                            Grandma's Home             3%
•         Only 4% of KFC and McDonald's stores                                          Subway         2%
                                                                                 Ajisen Remen          2%
          were there.
                                                                                     Yoshinoya         2%
                                                                                            Taier      2%
                                                                                  Xiabu Xiabu         2%
                                                                                   Little sheep       2%
                                                                                            Dicos    1%
                                                                                       Dominos      0%
                                                                                 Cafe de Coral      0%

    Feb           Apr         Jun         Aug         Oct
                                                                  Source: UBS Evidence Lab
            Mar         May         Jul         Sep

Interested in learning more about UBS Evidence Lab? Email us                                                                                                      2
UBS Evidence Lab

Unemployment                                                                                     US Google Search Interest in Unemployment

                                                                180

                                                                160
What did Google search interest in
unemployment show?                                              140

                                                                120
COVID-19 led to widespread business closures and
layoffs starting in mid-March.
                                                                100
•         In the week of March 21, US Google search
          interest in unemployment increased by ~8x vs.          80
          the previous week.
                                                                 60
•         Initial jobless claims reached a record 3.3 million
          that week.                                             40

                                                                 20

                                                                 0
                                                                Mar-2008         Mar-2010            Mar-2012   Mar-2014     Mar-2016        Mar-2018   Mar-2020
                                                                                                                      US

    Feb           Apr         Jun         Aug         Oct
                                                                  Source: UBS Evidence Lab, Google
            Mar         May         Jul         Sep

Interested in learning more about UBS Evidence Lab? Email us                                                                                                       3
UBS Evidence Lab
Retailers Retailers' Geographic Exposure by COVID-19 Case Share
Zara (ITX) 54% 33% 13%
Nordstrom (JWN) 44% 33% 23%
dd's Discounts (ROST) 40% 46% 14%
Urban Outfitters (URBN) 38% 36% 26%
Nordstrom Rack (JWN) 37% 35% 28%
Which retailers were most/least exposed Free People (URBN) 36% 40% 24%
at the beginning of the pandemic? Lululemon Athletica Fullprice (LULU)
Abercrombie And Fitch (ANF)
35%
34%
33%
43%
32%
23%
Macys (M) 33% 39% 28%
Gap (GPS) 33% 41% 26%
COVID-19 affected some parts of the US much Banana Republic (GPS) 33% 39% 28%
Michael Kors (TPR) 33% 37% 30%
more than others during the initial outbreak. UBS Kate Spade (TPR) 31% 35% 34%
Evidence Lab looked at retailers' number of H&M (HM B) 31% 38% 32%
Hollister (ANF) 30% 42% 27%
locations in areas with the highest percentage of Marshalls (TJX) 30% 43% 27%
cases. Express (EXPR) 30% 40% 30%
Nike Full Price (NKE) 30% 37% 34%
• JCPenney and Kohl's had less exposure than Athleta (GPS) 29% 38% 33%
Nordstrom and Macy's. Burlington Coat Factory (BURL)
The Home Depot (HD)
27% 44% 29%
26% 42% 32%
• Fewer than 25% of TJ Maxx and Ross Stores Old Navy (GPS)
Best Buy (BBY) 25%
26% 41%
40% 36%
34%
were in states with high case levels. Tj Maxx (TJX) 24% 40% 36%
Ross Stores (ROST) 24% 42% 34%
• Only 17% of Lowe's stores were in high- Kohls (KSS) 23% 38% 39%
exposure states vs. 26% for Home Depot. Aerie (AEO) 22% 43% 36%
Jcpenney (JCP) 20% 37% 42%
American Eagle Outfitters (AEO) 20% 41% 38%
Lowes (LOW) 17% 40% 42%
0% 10% 20% 30% 40% 50% 60% 70% 80% 90% 100%
HIGH MEDIUM LOW
Feb Apr Jun Aug Oct
Source: UBS Evidence Lab
Note: COVID-19 case data as of March 25; high-case states are those that account for >3% of total US cases; medium account for
Mar May Jul Sep
1-3%; low account forUBS Evidence Lab
Hospitals US Hospital Volumes (Y/Y Change)
Inpatient Discharges ED Visits Outpatient Visits Total Surgeries
How did COVID-19 impact US hospital 20%
volumes in April?
10%
UBS Evidence Lab data showed how different types 0%
of hospital visits declined.
-10%
Average total surgeries fell 59% year-over-year
in April vs. 26% in March. -20%
Emergency Department visits were down 38%
y/y in April vs. 18% in March. -30%
Average inpatient discharges and outpatient -40%
visits in April fell 28% and 31%, respectively (vs.
22% and 16% in March). -50%
-60%
Sep-19 Oct-19 Nov-19 Dec-19 Jan-20 Feb-20 Mar-20 Apr-20
Feb Apr Jun Aug Oct
Source: UBS Evidence Lab, Colorado Hospital Association's Databank Program
Mar May Jul Sep
Interested in learning more about UBS Evidence Lab? Email us 5UBS Evidence Lab
Stockpiling Share of Products Unavailable for Purchase in the US
100%
Which products were unavailable on
Amazon in the early days of COVID-19?
80%
As US consumers began to stockpile essential items, 60%
UBS Evidence Lab tracked which categories on
Amazon had the highest share of products
unavailable for purchase. 40%
• Toilet paper, disinfecting wipes, and peanut
butter were among the categories with the most 20%
products unavailable for purchase on Amazon in
the US.
0%
• Women's razors had among the fewest products
5-Jan 19-Jan 2-Feb 16-Feb 1-Mar 15-Mar 29-Mar 11-Apr
unavailable for purchase.
Toilet Paper Disinfecting Wipes
Peanut Butter Women's Razors & Blades
Feb Apr Jun Aug Oct
Source: UBS Evidence Lab, Amazon.com, Inc.
Note: Share is for target category products that appear in the US top 100 of the ranking category. Products that show up as
Mar May Jul Sep
available to purchase may not ship immediately; data for the week ending April 11, 2020.
Interested in learning more about UBS Evidence Lab? Email us 6UBS Evidence Lab
Popular products Products that Saw Increase in Buying (% of Respondents)
37%
Which products did UK consumers buy Hand sanitizers
33%
more in April and May?
34%
Fresh produce
29%
UBS Evidence Lab surveyed 1,000 UK consumers
about how COVID-19 had affected their shopping 22%
habits. Paper towels
19%
Hand sanitizers and fresh produce saw the
greatest increase in buying in May relative to
17%
Trash bags
April. 15%
Paper towels, trash bags, medication, and 12%
Medication
batteries also saw an increase. 9%
11%
Batteries
8%
May-20 Apr-20
Feb Apr Jun Aug Oct
Source: UBS Evidence Lab
Mar May Jul Sep
Interested in learning more about UBS Evidence Lab? Email us 7UBS Evidence Lab
Air quality Hubei
Hubei AQI
Province
residual % y/y Smoothed Residual Air Quality Index (Y/Y Change)
0
-2
Did COVID-19 result in cleaner air in -4
China? -6
-8
-10
In addition to having public health consequences,
-12
air quality can be an indicator of industrial
production. -14
Jan-19 Mar-19 May-19 Jul-19 Sep-19 Nov-19 Jan-20 Mar-20 May-20
In Hubei Province and Shanghai, quality Shanghai AQI
improved throughout 2019 (a lower AQI is Shanghai
residual Smoothed
% y/y Residual Air Quality Index (Y/Y Change)
better).
However, it began to deteriorate in March, as -1
COVID-19 began to ease in China.
-2
-3
-4
-5
Feb Apr Jun Aug Oct Jan-19 Mar-19 May-19 Jul-19 Sep-19 Nov-19 Jan-20 Mar-20 May-20
Source: UBS Evidence Lab
Mar May Jul Sep
Interested in learning more about UBS Evidence Lab? Email us 8UBS Evidence Lab
Spending habits Change in Share of US Retail Transactions (Z-Score, Trailing 3 Months)
Where did US consumers start to spend
more during the pandemic?
UBS Evidence Lab looked at data from CoinOut,
which includes 140,000 active users who scan 4
million receipts per month.
Home improvement showed the biggest increase
in spending, followed by grocery stores.
The share of discretionary retailers (restaurants,
department stores, and specialty retailers) fell
before recovering in May.
Restaurants lagged in share of transactions vs.
January.
Feb Apr Jun Aug Oct
Source: UBS Evidence Lab, CoinOut
Mar May Jul Sep
Interested in learning more about UBS Evidence Lab? Email us 9UBS Evidence Lab
Robinhood Leading Mobile Brokerage Services in US (Share Of Downloads)
70% Robinhood Ameritrade Fidelity E-Trade
Which brokerage apps became more 60%
popular?
50%
UBS Evidence Lab monitored brokerage app
downloads to identify whether online trading was
becoming more popular. 40%
Robinhood accounted for the lion's share of
brokerage app downloads, having exceeded
50% in 2017 and 60% in 2019. 30%
Fidelity and E-Trade have lost share since 2016.
20%
10%
0%
Jun-16 Dec-16 Jun-17 Dec-17 Jun-18 Dec-18 Jun-19 Dec-19 Jun-20
Feb Apr Jun Aug Oct
Source: UBS Evidence Lab, Sensor Tower
Mar May Jul Sep
Interested in learning more about UBS Evidence Lab? Email us 10UBS Evidence Lab
China recovery China Ride-on-Demand Apps' Share of Sessions
(Indexed: Jan 2019=100)
120
How quickly did China ride-on-demand June 28
usage return to pre-pandemic levels?
100
As China reopened, UBS Evidence Lab tracked
usage of ride-on-demand apps. 80
Ride-on-demand app usage recovered to pre-
COVID-19 levels in late June. 60
It was up more than 5x from the lows seen in
late February/early March.
40
20
0
Jan-19 Mar-19 May-19 Jul-19 Sep-19 Nov-19 Jan-20 Mar-20 May-20
Feb Apr Jun Aug Oct
Source: UBS Evidence Lab, QuestMobile
Mar May Jul Sep
Interested in learning more about UBS Evidence Lab? Email us 11UBS Evidence Lab
Streaming Percent of Respondents Who Signed Up During the Pandemic/Are Likely to Cancel
Signed up during pandemic Likely to cancel in coming months
50%
Which services did US consumers sign
up for during the first few months of 44%
COVID-19?
40%
35% 35%
UBS Evidence Lab surveyed 2,000 US 33%
consumers about their use of streaming media
services. 30% 28%
19% of Disney+ subscribers signed up
between the beginning of the pandemic
and the end of June, compared with 28% 19%
20%
for Netflix. 16%
14%
Among these subscribers, intention to
cancel in the coming months was lowest for 10%
Disney+ (33%), with Netflix and Hulu tied
for a close second (35%).
0%
Hulu Amazon Prime Video Disney+ Netflix
Feb Apr Jun Aug Oct
Source: UBS Evidence Lab, Sensor Tower
Note: Data as of June 2020.
Mar May Jul Sep
Interested in learning more about UBS Evidence Lab? Email us 12UBS Evidence Lab
US summer surge Percent of US Consumers Expecting Economy to Get Better/Worse in 6 Months
vs. Daily COVID-19 Cases
Get better
Get worse Daily COVID-19 cases
Get better Get worse
Daily COVID-19 cases
60% 50,000
How did the summer surge in COVID-19 60% 50,000
cases affect US consumers' economic 45,000
outlook? 50% 45,000
50% 40,000
40,000
UBS Evidence Lab leveraged data from a survey of 35,000
40% 35,000
5-10K US consumers per week on COVID-19-related
40% 30,000
issues.
30,000
Consumer sentiment about the US economy 30% 25,000
took a negative turn as COVID-19 cases surged 30% 25,000
in late June and early July. 20,000
20% 20,000
The share who expected the economy to get 15,000
worse in the next 6 months rose to 42% from 20% 15,000
25% 2 weeks earlier. 10,000
10% 10,000
Those expecting an improvement dropped to 10%
33% from 57%. 5,000
5,000
0% 0
0% 14-Mar 28-Mar 11-Apr 25-Apr 9-May 23-May 6-Jun 020-Jun 4-Jul
Feb Apr Jun Aug Oct
14-Mar 28-Mar 11-Apr 25-Apr 9-May 23-May 6-Jun 20-Jun 4-Jul
Source: UBS Evidence Lab, Civic Science, Johns Hopkins University
Note: Daily cases are calculated as a 7-day rolling average.
Mar May Jul Sep
Interested in learning more about UBS Evidence Lab? Email us 13UBS Evidence Lab
Restaurants How soon from now would you be comfortable going out to eat at restaurants?
I’d be / I am comfortable going out to eat at restaurants now
In 6 or more months
Did US consumers become less willing to 40%
go to restaurants? 38%
35%
In early July, 38% of consumers said they would
not be comfortable eating at restaurants for at 30% 30%
least 6 months, while 30% said they were
comfortable now. 25%
This was a sharp change from 2 weeks earlier,
when the respective shares were 29% and 37%. 20%
15%
10%
5%
0%
25-Apr 9-May 23-May 6-Jun 20-Jun 4-Jul
Feb Apr Jun Aug Oct
Source: UBS Evidence Lab, Civic Science
Mar May Jul Sep
Interested in learning more about UBS Evidence Lab? Email us 14UBS Evidence Lab
Housing Inventory and Median Price of US Single Family Homes Relative to Pre-COVID-19
Did the US housing market show signs of
urban flight?
UBS Evidence Lab looked at inventory and prices of
single-family homes in cities, suburbs, and outlying
areas.
Cities saw an increase in inventory in the months
after the pandemic began.
In contrast, inventory declined in suburbs,
towns, and rural areas.
Feb Apr Jun Aug Oct
Source: UBS Evidence Lab
Note: Values presented as the median value of Top 10 CBSA for the percent change from the Pre-COVID lockdown value registered
Mar May Jul Sep
in the week of March 26.
Interested in learning more about UBS Evidence Lab? Email us 1540 40
20 UBS Evidence Lab
20
Return to work 0 0
Foot Traffic to US Workplaces 26-Jan
26-Jan 26-Mar 26-May 26-Jul
Factories Offices Schoo
When did people start to return to 120 120 120 120 120 120 120 120
120
120
120
workplaces?
100 100 100 100 100 100 100 100
100
100
100
Factories and offices saw a drop in foot traffic in
March as COVID-19 cases started to rise in the US.
80 80 80
80 80 80 80 80 80 80 80
By August, foot traffic to factories had recovered
to pre-pandemic levels.
Foot traffic to offices has also been rising, but at 60 60 60
60 60 60 60 60 60 60 60
a slower pace.
40 40 40
40 40 40 40 40 40 40 40
20 20 20
20 20 20 20 20 20 20 20
00 0
0 0 0 0 0 0 0 0
26-Jan 26-Jan26-Jan 26-Mar
26-Mar
26-Jan 26-May
26-Mar 26-May
26-Mar 26-Jul
26-May 26-Jul26-Jul
26-May 26-Jan
26-Jan
26-Jul 26-Jan 26-M
262
26-Jan
26-Mar
26-Jan
26-Jan 26-Mar26-Mar 26-May 26-May
26-Jul 26-Jul
Feb Apr Jun Aug Oct
Lab Factories
Factories
Factories
Factories
Source: UBS EvidenceFactories Offices
Factories
Offices OfficesOffices
Offices
Offices Schools
SchoolsSchools
Sch
Note: Data indexed to January 2020
Mar May Jul Sep
Interested in learning more about UBS Evidence Lab? Email us 16UBS Evidence Lab
Fast fashion Global Fast Fashion Brands – Discount Factor vs. Inventory Age (August 2020)
Which fast fashion retail brands
discounted to clear inventory during the ASOS Europe
back-to-school season? Zara
UBS Evidence Lab tracked price strategy in the
global fashion and sportswear sectors.
Several global fast fashion brands saw their
inventory age rise y/y in August.
During this period, ASOS and Zara raised
promotions in many markets in Europe, while
H&M kept promotions below last year's level in
Europe and China. H&M Europe & China
Feb Apr Jun Aug Oct
Source: UBS Evidence Lab
Note: Discount factor is discount breadth x discount depth
Mar May Jul Sep
Interested in learning more about UBS Evidence Lab? Email us 17UBS Evidence Lab
Social media All-Category iPhone Download Rankings in the US
iPhone All Category Downloads Rankings Over Time
1
Which social media platforms have
become more popular in 2020??
3
As US consumers quarantined during COVID-19
shutdowns, their social media use increased
marginally relative to other app categories.
9
The increase was concentrated in one app:
TikTok became the #2 app across all categories
in the US. 27
Rankings for Facebook, Instagram, and Twitter
dipped and then recovered.
81
Jan-19 Mar-19 May-19 Jul-19 Sep-19 Nov-19 Jan-20 Mar-20 May-20 Jul-20 Sep-20
Facebook US Instagram US TikTok US Twitter US
Source: UBS Evidence Lab, Sensor Tower
Feb Apr Jun Aug Oct
Source: UBS Evidence Lab, Sensor Tower
Note: Data as of September 2020
Mar May Jul Sep
Interested in learning more about UBS Evidence Lab? Email us 18UBS Evidence Lab
Shipping China,
China,
China Container
Container
Container Vessel
Exits,Exits,
Vessel
Vessel Exits,MDWT,
MDWT* MDWT, Y/Y%
Y/Y%
(Y/Y Change)
%30
US-China Trade War COVID-19
%30
How have China exports been trending? %20
%20
%10
UBS Evidence Lab monitors maritime trade across %10
the globe via real-time AIS data on 17,200+
container, dry bulk, and liquid tanker ships. %0
%0
Container shipments from China recovered
during the summer. -%10
-%10
The y/y change in MDWT* (rolling 4-week
average) turned positive in September after -%20
-%20
being as low as -14% in early summer.
-%30
-%30
-%40
-%40
-%50
-%50
Jan-19
Jan-19 Mar-19
Mar-19 May-19
May-19 Jul-19
Jul-19 Sep-19
Sep-19 Nov-19
Nov-19 Jan-20
Jan-20 Mar-20
Mar-20 May-20
May-20 Jul-20
Jul-20 Sep-20
Sep-20
China,
China,Container
ContainerVessel
VesselExits,
Exits,MDWT,
MDWT,Y/Y%
Y/Y% Rolling
Rolling4 Week Avg
4 Week Avg
Feb Apr Jun Aug Oct
Source: UBS Evidence Lab, IHS Markit. Includes content supplied by Markit Group Limited; Copyright © Markit Group Limited, 2020.
All rights reserved.
Mar May Jul Sep
* Modified Dead Weight Ton (MDWT) is a proprietary measurement of the weight of cargo onboard a vessel.
Interested in learning more about UBS Evidence Lab? Email us 19UBS Evidence Lab
Air travel 30%
Volume of International Flights/Passengers Arriving in the US (Y/Y Change)
30%
20%
20%
10%
How has COVID-19 affected international 10%
0%
flight arrivals to the US? 0%
-10%
-10%
-20%
-20%
UBS Evidence Lab tracks flight counts, passenger -30%
counts, and average wait times for international -30%
-40%
flight arrivals to the US. -40%
-50%
The number of international passengers and -50%
-60%
flights arriving in the US were down 98% and -60%
95% y/y in April. -70%
-70%
-80%
They subsequently began to recover but have -80%
ticked down again amid the resurgence in -90%
-90%
COVID-19 cases. -100%
-100%
11-Nov-19
16-Sep-19
09-Dec-19
19-Aug-19
04-Feb-19
14-Oct-19
27-May-19
25-May-20
07-Jan-19
01-Apr-19
29-Apr-19
14-Sep-20
22-Jul-19
04-Mar-19
02-Mar-20
30-Mar-20
24-Jun-19
17-Aug-20
03-Feb-20
12-Oct-20
06-Jan-20
27-Apr-20
20-Jul-20
22-Jun-20
11-Nov-19
16-Sep-19
09-Dec-19
19-Aug-19
04-Feb-19
14-Oct-19
27-May-19
25-May-20
07-Jan-19
01-Apr-19
29-Apr-19
14-Sep-20
22-Jul-19
04-Mar-19
02-Mar-20
30-Mar-20
24-Jun-19
17-Aug-20
03-Feb-20
12-Oct-20
06-Jan-20
27-Apr-20
20-Jul-20
22-Jun-20
Passenger Count Flight Count
Passenger Count Flight Count
Feb Apr Jun Aug Oct
Source: UBS Evidence Lab
Mar May Jul Sep
Interested in learning more about UBS Evidence Lab? Email us 20UBS Evidence Lab
Education apps Share of Time Spent Relative to All Apps in China
Did students in China reengage with
digital education at the start of the new
school year?
Schools in China reopened at the beginning of the
fall term in the first week of September.
Students use education apps more often when a
new term starts. Time spent on these apps has
been rising steadily since early September.
In October, it was similar to where it was at the
same time last year, i.e., before the pandemic.
Feb Apr Jun Aug Oct
Source: UBS Evidence Lab, QuestMobile
Note: Indexed to initial date of Jan 6, 2019; data as of Oct 18, 2020
Mar May Jul Sep
Interested in learning more about UBS Evidence Lab? Email us 21UBS Evidence Lab Latest insights November 2020
UBS Evidence Lab
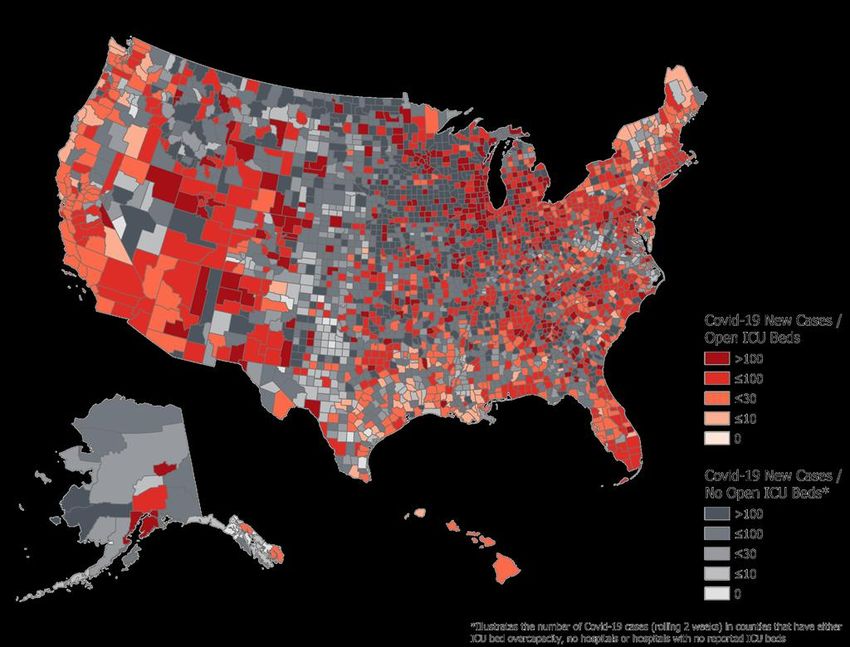
ICU capacity New COVID-19 Cases Per Open ICU Bed (Rolling 2 Weeks)
How are new COVID-19 cases trending
relative to ICU capacity in the US?
States in the Midwest and West have the highest
number of new COVID-19 cases per open ICU
bed.
The Northeast has the lowest number of new
cases per open ICU bed, but there has been an
uptick in Maine and Connecticut.
Source: UBS Evidence Lab, Johns Hopkins University
Note: Data as of November 11, 2020. *Illustrates the number of COVID-19 cases (rolling 2 weeks) in counties that have either ICU
bed overcapacity, no hospitals or hospitals with no reported ICU beds.
Interested in learning more about UBS Evidence Lab? Email us 23UBS Evidence Lab
Airlines Groups of 1, 2, and 3 – Spaced 6 Feet Apart
Breakeven load factor ~70%
Can airlines conform to social-distancing
and still be profitable?
Airbus A320 Boeing 787
Load Factor 16.4% Load Factor 21.2%
With governments reimposing restrictions amid a
surge in COVID-19 cases, UBS Evidence Lab shows
how social-distancing measures could affect aircraft
load factors (the percentage of seats occupied).
In a scenario in which groups of 1, 2, and 3 people
traveling together are spaced 6 feet apart:
The load factor for an Airbus A320 narrow-body
plane would be 16%.
The load factor for a Boeing 787 wide-body
plane would be 21%.
Both are well below the breakeven load factor of
~70%.
Source: UBS Evidence Lab
Interested in learning more about UBS Evidence Lab? Email us 24UBS Evidence Lab
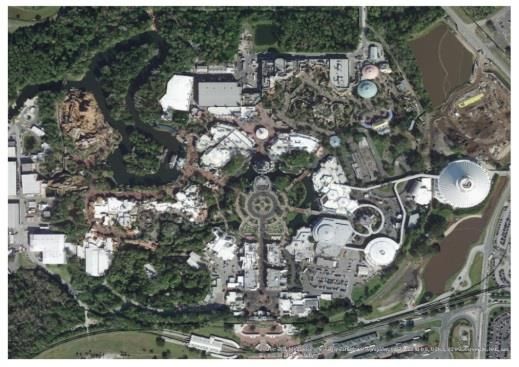
Theme parks Magic Kingdom Digitization
What is it like to visit Disney World during
the pandemic?
After pandemic-driven shutdowns, Disney World
parks reopened with social-distancing restrictions in
place.
Using geospatial techniques, UBS Evidence Lab
modelled how many visitors the Magic Kingdom
can accommodate under different social-
distancing scenarios.
Based on the CDC-recommended social distance
of 6 feet between groups, the park can
accommodate ~28k visitors per day.
Before the pandemic, it averaged about 60k
visitors per day and reached 80-100k during
peak times.
Source: UBS Evidence Lab
Interested in learning more about UBS Evidence Lab? Email us 25UBS Evidence Lab
Europe mobility Dotted line
indicates
base rate or
Germany United Kingdom France Italy Spain
return to
"normal"
How is mobility trending in Europe? Auto
Congestion
Mobility is falling in Europe as cases rise and M A M J J A S O N M A M J J A S O N M A M J J A S O N M A M J J A S O N M A M J J A S O N
countries reimpose lockdowns.
France and Italy have seen the steepest declines in
all three metrics.
Public
Foot traffic to workplaces is relatively resilient in
Transit
Germany, the UK and Spain.
M A M J J A S O N M A M J J A S O N M A M J J A S O N M A M J J A S O N M A M J J A S O N
Foot Traffic
M A M J J A S O N M A M J J A S O N M A M J J A S O N M A M J J A S O N M A M J J A S O N
Notes: All migration figures are measured as relative metrics vs. a base rate. For Auto congestion the base is the base Congestion score for a given day in 2020 to the average congestion for that
Notes: All migration figures are measured as relative metrics vs. a base rate. The auto congestion base is the base congestion score for a given day in 2020 relative to the average congestion for the
comparable day in 2019; public transit data is indexed to the value registered on January 15; foot traffic data is indexed to the baseline median value for the corresponding day of the week during the 5-week
period Jan 3–Feb 6, 2020. For public transit, population-weighted country figures were derived from baseline city figures. The data is further normalized to remove weekends and several key holidays (country
by country), which create abnormal trends in the data. Relative auto congestion is presented as a percent difference from 100%. Please see downloadable asset for the full methodology or underlying data.
Source: UBS Evidence Lab, TomTom, Moovit, Google LLC "Google COVID-19 Community Mobility Reports" Accessed: November 15, 2020. Data as of November 13, 2020.
Interested in learning more about UBS Evidence Lab? Email us 26UBS Evidence Lab
Americas mobility Dotted line
indicates
base rate or
United States Mexico Canada Brazil Argentina
return to
"normal"
How is mobility trending in the Americas? Auto
Congestion
Mobility in the Americas has been more resilient M A M J J A S O N M A M J J A S O N M A M J J A S O N M A M J J A S O N M A M J J A S O N
than in Europe.
US mobility has declined slightly.
Use of public transit has declined in Mexico and
levelled off in Canada. Public
Transit
Brazil has seen the strongest overall recovery, with
foot traffic to workplaces back to pre-pandemic M A M J J A S O N M A M J J A S O N M A M J J A S O N M A M J J A S O N M A M J J A S O N
levels.
Foot Traffic
M A M J J A S O N M A M J J A S O N M A M J J A S O N M A M J J A S O N M A M J J A S O N
Notes: All migration figures are measured as relative metrics vs. a base rate. The auto congestion base is the base congestion score for a given day in 2020 relative to the average congestion for the
comparable day in 2019; public transit data is indexed to the value registered on January 15; foot traffic data is indexed to the baseline median value for the corresponding day of the week during the 5-week
period Jan 3–Feb 6, 2020. For public transit, population-weighted country figures were derived from baseline city figures. The data is further normalized to remove weekends and several key holidays (country
by country), which create abnormal trends in the data. Relative auto congestion is presented as a percent difference from 100%. Please see downloadable asset for the full methodology or underlying data.
Source: UBS Evidence Lab, TomTom, Moovit, Google LLC "Google COVID-19 Community Mobility Reports" Accessed: November 15, 2020. Data as of November 13, 2020.
Interested in learning more about UBS Evidence Lab? Email us 27UBS Evidence Lab
APAC mobility Dotted line
indicates
base rate or
Japan India Australia Indonesia
return to
"normal"
How is mobility trending in APAC? Auto
Congestion
Mobility in Japan has been relatively steady in
M A M J J A S O N M A M J J A S O N M A M J J A S O N
recent weeks. M A M J J A S O N
India and Australia have seen notable increases in
traffic congestion and public transit.
Congestion in Indonesia is down sharply. Public
Transit
Foot traffic to workplaces remains relatively
steady.
M A M J J A S O N M A M J J A S O N 16-Mar
M A M J 16-Jul
J A S O N M A M J J A S O N
Foot Traffic
M A M J J A S O N M A M J J A S O N M MA AMM J J J J A
A S O
O N M A M J J A S O N
Notes: All migration figures are measured as relative metrics vs. a base rate. The auto congestion base is the base congestion score for a given day in 2020 relative to the average congestion for the
comparable day in 2019; public transit data is indexed to the value registered on January 15; foot traffic data is indexed to the baseline median value for the corresponding day of the week during the 5-week
period Jan 3–Feb 6, 2020. For public transit, population-weighted country figures were derived from baseline city figures. The data is further normalized to remove weekends and several key holidays (country
by country), which create abnormal trends in the data. Relative auto congestion is presented as a percent difference from 100%. Please see downloadable asset for the full methodology or underlying data.
Source: UBS Evidence Lab, TomTom, Moovit, Google LLC "Google COVID-19 Community Mobility Reports" Accessed: November 15, 2020. Data as of November 13, 2020.
Interested in learning more about UBS Evidence Lab? Email us 28UBS Evidence Lab
US election Implied Probability of Democrat House, Democrat Senate vs. Democrat House,
Republican Senate
Democrat
Democrat House, Democrat Senate
House, Democrat Senate DemocratHouse,
Democrat House,Republican
RepublicanSenate
Senate
100%
100%
Which party will control the US House and
Senate next year according to betting 90%
90%
markets? 80%
80%
70%
70%
UBS Evidence Lab looks at the likelihood of different
political outcomes according to prediction markets,
60%
60%
such as bookmakers and betting exchanges.
The implied probabilities show an 80% chance 50%
50%
that Democrats will retain control of the House
and Republicans will keep the Senate. 40%
40%
This is a sharp change from before election day, 30%
30%
when the implied probabilities showed a ~70%
chance that Democrats would control both 20%
20%
chambers.
10%
10%
Disclaimer: The implied probabilities presented in this analysis reflect
the betting odds as set by bookmakers and betting exchanges and
0%
0%
do not reflect the views of UBS or UBS Evidence Lab. 15-Jul
15-Jul 5-Aug 26-Aug
26-Aug 16-Sep
16-Sep 7-Oct
7-Oct 28-Oct
28-Oct 18-Nov
18-Nov
Source: UBS Evidence Lab
Note: Chart shows implied probability based on betting odds at leading bookmakers (the sum of implied probabilities of different
outcomes often exceeds 100%, as bookmakers and exchanges charge a premium for placing bets)
Interested in learning more about UBS Evidence Lab? Email us 29UBS Evidence Lab
COVID-19 vaccine Net Sentiment* of Vaccine News
Is sentiment on a vaccine becoming more
positive?
UBS Evidence Lab's Deep Theme Explorer uses
natural-language processing to identify mentions of
terms in the news and determine the sentiment
around those terms.
There have been three periods of positive
sentiment around the term "vaccine" in the
news this year.
Recent sentiment about Pfizer's vaccine has
been the most positive of the year.
Both Pfizer and Moderna saw an increase in
positive mentions in July.
Source: UBS Evidence Lab
Note: Data as of November 16, 2020; * Net Sentiment is defined as the number of position mentions less negative mentions
.
Interested in learning more about UBS Evidence Lab? Email us 30UBS Evidence Lab
What will 2021 bring? Let's track it together.
Get the latest insights as they become available.
Contact us
Interested in learning more about UBS Evidence Lab? Email us 31UBS Evidence Lab © UBS 2020. The key symbol and UBS are among the registered and unregistered trademarks of UBS. All rights reserved. This material is for information only. It is for distribution only under such circumstances as may be permitted by applicable law. It may not be distributed, copied or reproduced without the express prior written consent of UBS. The recipient should not construe the contents of this material as legal, tax, accounting, regulatory, or other specialist or technical advice or services or investment advice or a personal recommendation. Neither UBS nor any of its directors, officers, employees or agents accepts any liability for any loss or damage arising out of the use of all or any part of this material or reliance upon any information contained herein. UBS Evidence Lab is a separate business to UBS Research and is not subject to all of the independence disclosure standards applicable to material prepared by UBS Research. UBS Evidence Lab provides data and evidence for analysis and use by UBS Evidence Lab clients including UBS Research; it does not provide research, investment recommendations or advice. Interested in learning more about UBS Evidence Lab? Email us 32
You can also read