Analysis of oxide scale thickness and pores position of HCM12A steel in supercritical water
←
→
Page content transcription
If your browser does not render page correctly, please read the page content below
High Temperature Materials and Processes 2021; 40: 53–65
Research Article
Li Sun* and Weiping Yan
Analysis of oxide scale thickness and pores
position of HCM12A steel in supercritical water
https://doi.org/10.1515/htmp-2021-0016
received October 31, 2020; accepted February 17, 2021
1 Introduction
Abstract: More attention has been paid to the exfoliation With the improvement of operation parameters of super-
of oxide scale on high-temperature heating surface critical and ultra-supercritical boiler power plants, spal-
of utility boiler. The oxidation mechanism of HCM12A lation of oxide scale does a lot of harm to some units. In
steel in supercritical water is proposed and the growth supercritical water environment, oxide scale inevitably
of oxide film is simulated. The duplex scale contains an generates on high-temperature heating surface of boiler,
outer magnetite layer and an inner Cr-rich spinel layer. such as superheater and reheater. In the process of
According to the data of Backhaus and Töpfer, the diffu- starting and stopping of the unit, scale exfoliation threa-
sion coefficient values of iron in magnetite layer are dis- tens the safety and economy of units. Ferritic–martensitic
cussed and the function of RV, RI for oxygen activity can alloys with excellent properties [1] are often used in high-
be used for calculation of iron diffusion coefficients in Cr- temperature heating surface of supercritical power gen-
rich spinel layer. Based on Wagner’s oxidation theory, erating units. Compared with nickel-based alloys and
the oxidation rate constants of HCM12A are calculated austenitic stainless steels, the corrosion resistance of
at 500 and 600°C in supercritical water, compared with ferrite–martensitic steels is lower.
experimental data of the relevant literatures. The oxygen It is generally believed that the reaction of super-
activities at the interfaces of alloy/Cr-rich spinel oxide critical water with ferrite–martensitic steels results in
and magnetite/supercritical water are estimated. The
the formation of double-layer oxide scale, the outer layer
simulation results of weight gain are matched with the
of magnetite and the inner layer of Cr-rich spinel with the
test data. The iron diffusion mechanisms inside the mag-
same thickness. In order to clarify the basic principle of
netite layer and the Cr-rich spinel layer are analyzed. The
oxidation behavior of ferrite–martensitic steels in super-
iron diffusion coefficient at the interface of Cr-rich spinel/
critical water, researchers have performed a lot of experi-
magnetite is discontinuous, while the oxygen activity is
ments. Yin et al. [2] investigated the corrosion behavior
continuous in the whole double layer. The thickness of
of P92 steel in supercritical water at 500–600°C/25 MPa.
oxide scale on inner tube walls of the final superheater
The microstructure of the oxide scale was analyzed by
coils (T91) of a 600 MW supercritical boiler is calculated
X-ray diffraction (XRD) and scanning electron micro-
by using the calculation method provided by the paper.
scopy (SEM) and the corrosion kinetics of P92 steel in
The modeling results, the measured data, and the calcu-
supercritical water were analyzed. The oxide scale is a
lation results by the method are compared. Accurate cal-
double-layer structure. The outer oxide layer is Fe3O4
culation of the thickness of the inner and outer oxide
phase, and the inner oxide layer is Fe3O4/FeCr2O4 phases.
scales can provide a necessary basis for predicting the
Geng et al. [3] studied the effect of temperature and flow
stress and exfoliation of oxide scales.
rate of high-temperature steam on oxidation behavior of
Keywords: supercritical water, HCM12A, thickness, oxide T91 steel and the relationship between microstructure
scale, pores and oxidation kinetics of oxidation layer. Xu [4] put for-
ward the “Ecocide Hypothesis” and explained the reason
why the oxide film on the steam side is easy to fall off
due to oxygenated feed water treatment. The oxygenated
* Corresponding author: Li Sun, Department of Power Engineering,
treatment of the feed water may damage the environment
North China Electric Power University, Baoding 071003, China,
e-mail: sunli1001315@163.com
where the metal oxide film is located. Pores are formed
Weiping Yan: Department of Power Engineering, North China Electric at the interface of the double-layer oxide film due to
Power University, Baoding 071003, China the evaporation and dissipation of chromium, and the
Open Access. © 2021 Li Sun and Weiping Yan, published by De Gruyter. This work is licensed under the Creative Commons Attribution 4.0
International License.54 Li Sun and Weiping Yan
gradual increase of the holes leads to the gradual decreased. The creep strength loss was estimated to be
decrease of the bonding strength of the double-layer about 60–70% [11]. The performance test of HCM12A steel
oxide film interface. Corrosion tests of two ferritic– in before and after service conditions showed that the mea-
martensitic steels, HCM12A and NF616, were carried out sured values of strength properties at room temperature and
in steam and supercritical water at 500°C [5]. The corro- high temperature were close. So was the hardness value.
sion kinetics of the two alloys are similar, and the corro- Long-term service resulted in a relatively slight change of
sion rate in supercritical water is greatly higher than that the strength performance value, and the impact strength
in steam. In both environments, a double oxide structure was reduced by about 50% compared with the condition
is formed on the two steels [5]. Zhong et al. [6] suggested before using. It is estimated that the creep loss of steel is
that the weight gain of P92 steel conforms to the power about 24% [12].
law oxidation kinetics with the increase of oxidation tem- In short, more attention has been paid to lots of
perature. The activation energy of P92 steel in super- experiments in the study on oxidation kinetics of ferritic–
critical water is 174.3 kJ mol‒1. The oxide film consists of martensitic steels, and the kinetic simulation calculation is
three layers, the outer layer which is porous hematite, the relatively less focused on. In this study, the oxidation
middle layer which is magnetite, and the inner layer mechanism of HCM12A steel under different environments
which is chromium and iron-chromium spinel oxides. is presented, the iron diffusion coefficient values in Fe3O4
Tan et al. [7] studied the corrosion behavior of HCM12A and Fe2CrO4 are discussed, and the oxygen activities at the
and NF616 steels in two different oxidation environments interfaces of steel/Cr-rich spinel oxide and magnetite/
by various characterization techniques. The dissolved supercritical water are estimated. Based on Wagner oxida-
oxygen concentration in supercritical water and high- tion theory, the oxidation rate constants of HCM12A (its
temperature water is less than 25 ppb. The surface morpho- chemical compositions are listed in Table 1) are calculated
logies, thickness, and composition of the oxide film were at 500 and 600°C in supercritical water, and the weight
significantly affected by the oxidation temperature and gain of simulation is compared with experimental results
time. The inner spinel layer was found to be porous. The in Bischoff et al. [5,13].
oxidation kinetics and morphologies of oxide film in
steam oxidation were usually similar to those formed in
air–water vapor environment. Under high temperature
and pressure of ultra-supercritical steam cycle, chro- 2 Oxidation mechanism
mium was extensively lost by volatilization. The content
of chromium in alloy was closely related to the oxidation
rates and morphologies [8]. Martinelli et al. [9] studied 2.1 Summary of previous experimental
the oxidation of Fe-9Cr-1Mo martensitic steel (T91) in results
static liquid Pb–Bi eutectic alloy. The growth kinetics
of double-layer oxide scale were simulated, which was Known from the literatures [2–8], a multilayer oxide scale
in agreement with the experimental data. Rouillard is formed on ferritic–martensitic steels in supercritical
and Martinelli [10] have suggested that the oxidation of water. The oxidation film growth follows parabolic oxida-
9Cr1Mo steel in CO2 at 550°C formed a double-layer oxide tion kinetics, and the oxide film generally consists of
film, which consisted of an external layer of magnetite three different layers, namely, a porous surface layer, a
and an internal layer of Cr-rich spinel. The mechanism dense middle layer, and a bottom diffusion layer. The
of void-induced oxidation explained the formation of surface oxide is composed of dense columnar magnetite
internal spinel oxide layer and the corrosion kinetics of (Fe3O4) particles. The middle oxide consists of Cr-rich
oxide were simulated. spinel oxide Fe3−xCrxO4 equiaxed crystal, in which x =
After long-term service, great changes have taken place 0.7–1 is related to the type of alloy [14]. The results of
in the microstructure of HCM12 steel, and the strength pro- SEM show that the ratios of Cr and Fe are slightly dif-
perties at room temperature and high temperature have ferent in each environment. However, a significant trend
Table 1: Chemical compositions of HCM12A steel (wt%)
Steel C Mn P S Si Ni Cr Mo Cu N Nb Al V W
HCM12A 0.11 0.64 0.016 0.002 0.27 0.39 10.83 0.3 1.02 0.063 0.054 0.001 0.19 1.89Analysis of HCM12A steel 55
of the Fe:Cr ratios is observed in different alloys. The • The oxide film is in a local thermodynamic equilibrium
averaged Cr concentrations in the internal oxide of HCM12A condition.
are 11.8%. It is observed that the Cr concentrations in the • The component concentration is fixed at the internal
inner layer are relatively close to those in the original alloy and external interfaces.
substrate, and slight enrichment was observed. Corre- • The oxide thickness growth follows parabolic law.
sponding Fe:Cr:O ratios of inner oxide in HCM12A are • The deviation stoichiometric ratio of Cr-rich spinel
2.1:0.9:4 [14]. So the inner oxide is assumed as a stoichio- layer composition is very small.
metry of Fe2CrO4 in this study. • The influence of cavity and crack is not considered.
• The dissolution of oxide is not considered.
2.2 Proposed mechanism in other
environments 3.2 Formulas
The thickness of growth of the two oxide layers shows
The oxidation characteristics of different Fe–Cr steels are
a parabolic law over time, and the relations can be
similar in different environments, such as evaluated tem-
described as follows:
perature steam, CO2, and liquid LBE. The “available space
model” has become one of the most reliable models to 2
hmag = kp,mag t (1)
explain the structure of double oxide scale [15]. In this
model, Fe atom diffuses outward, and an external oxide
2
hspinel = kp,spinel t (2)
film is formed at the oxide/oxidation medium interface, where hspinel and hmag are the thicknesses of the Cr-rich
where a large number of vacancies are left. Vacancies
spinel layer and the magnetite layer (μm). kp,spinel and
condense into voids at the metal/oxide interface, where kp,mag are the oxidation proportionality constants of oxide
the oxides decompose and produce micro-channels in the layers (cm2 s−1). t is time (s).
oxide scale. The oxidant passes through micro-channels
Based on Wagner oxidation theory, the oxidation
to metal/oxide interface and a new internal oxide layer process of the alloy is controlled by the diffusion of
is formed. In other words, the internal oxide layer grows iron in the oxide layer. The oxidation rate constants of
inward. Although the oxygen transport is very fast through
the two layers obey the following expression [16]:
micro-channels, it is not the growth rate controlling step of
aOmag/scw
internal oxide layer. 2
4
kp,mag =
3
∫ f −1 DFe,mag d ln aO2 (3)
aOmag
2
/spinel
3 Modeling of calculation 4
aOmag
2
/spinel
kp,spinel =
3
∫ f −1 DFe,spinel d ln aO2 (4)
According to the mass conservation of Fe and Cr, the aOsteel/spinel
2
growth of Cr-rich spinel oxide is related to that of mag-
netite. Therefore, the oxidation rate of the alloy depends where aOsteel
2
/spinel
, aOmag
2
/spinel
, and aOmag
2
/scw
are the oxygen
on the diffusion of iron in the oxide layers. activities at steel/Cr-rich spinel layer interface, Cr-rich
spinel layer/magnetite layer interface, and magnetite
layer/SCW interface. f is the correlation coefficient of dif-
fusion mechanism and is about 0.5 [16]. DFe,mag and
3.1 Assumptions DFe,spinel are the diffusion coefficients of Fe in Cr-rich
spinel and magnetite. aO2 = PO2 / PO02 , PO2 is the oxygen
• Ferrite–martensitic steels form double oxide scale in partial pressure at the interface (atm), PO02 = 1 atm .
supercritical water. The external layer is magnetite The iron diffusion coefficient in magnetite and Cr-
layer, whose growth is at the interface of supercritical rich spinel can be showed as a function of oxygen activity
water/magnetite. The internal layer is Cr-rich spinel by the following formula [17,14]:
layer, whose growth is at the interface of alloy/Cr-rich AaO22/ 3
spinel layer. The iron flux through Cr-rich spinel is DFe,mag = + Ba−O22 / 3 (5)
(1 + 2KV aO22/ 3)
equal to that through magnetite.56 Li Sun and Weiping Yan
AaO22/ 3 1,200°C by Töpfer et al. [18], and the iron self-diffusion
DFe,spinel = RV + RI Ba−O22 / 3 (6)
(1 + 2KV aO22/ 3) coefficients at low temperatures can be calculated from
the Töpfer’s data. The experimental values of diffusion
RV = Dspinel,V
topfer topfer
/ Dmag,V coefficients of iron in Fe3O4 and Fe2CrO4 at 1,200°C are
(7) listed in Table 2.
RI = Dspinel,I
topfer topfer
/ Dmag,I
Linear regression was carried out with data points
where A = D V KV/ 12 , B = 4DI KI/ 3, D V and DI are self- in Table 2 and the calculation expressions are listed in
diffusion coefficients of vacancies and interstitials, and Table 3. The relation between the expression of RV and RI
KV and KI are the equilibrium constants for the formation and oxygen activity are derived as:
of vacancies and interstitials in magnetite. They are func- RV = 0.49
tions of temperature [17]. In equation (5), the two terms 0.0078 (9)
represent vacancy diffusion and interstitial diffusion of RI = 0.0462aO2
iron, respectively. Both terms are functions of tempera-
ture and oxygen activity. Interstitial diffusion of Fe occurs
preferentially for low oxygen activity, while iron diffuses
through vacancies for high oxygen activity 3.4 Estimation of oxygen activities at
It is assumed that the diffusion of iron in magnetite
interfaces
and Cr-rich spinel has the same temperature dependence,
RV and RI are the ratios between D V and DI in Cr-rich
The oxidation growth rate is connected with the oxygen
spinel and those in magnetite by Töpfer’s data [18].
topfer topfer
activities at three interfaces. Furukawa considered that
Dmag,V and Dmag,I are the partial cation vacancy and inter- the oxidation growth kinetics do not depend on the pro-
topfer topfer
stitial diffusion coefficients in Fe3O4. Dspinel,V and Dspinel,I perties of the oxidizing medium, but on the oxygen
are the partial cation vacancy and interstitial diffusion activity in the oxidizing medium [19]. During the oxida-
coefficients in Cr-rich spinel oxide layer. tion process of T91 in LBE, magnetite and chromium tri-
It is generally believed that the thickness of the con- oxide are formed at first, and then they react together to
sumed alloy is the same as the thickness of the generated form iron-chromium spinel layer [9]. Considering the
Cr-rich spinel layer. The thickness relationship between T91/magnetite equilibrium for oxygen activity, the calcu-
the two oxide scales can be expressed as follows [14]: lated growth rate is close to experimental data. So equili-
CFe(mag) brium oxygen activity of Fe/magnetite is used as the
hspinel = hmag (8) oxygen activity at steel/Cr-rich spinel interface in this
CFe(steel) − CFe(spinel)
study. The reaction between Fe and H2O is as follows:
where CFe(magnetite), CFe(spinel), and CFe(steel) are the concen- 3Fe + 4H2 O → Fe3 O4 + 4H2 (10)
tration of Fe in magnetite, spinel, and steel (mol/cm3),
respectively. According to Gaskell’s data [20], the standard free
energy of reaction (10) is listed in the following formula:
ΔG T = −107,060 + 93.55T (11)
3.3 Estimation of iron diffusion coefficients
in Fe–Cr spinel and magnetite
Table 2: Logarithm of iron diffusion coefficients measured at
Accurate estimation of iron diffusion coefficients in Cr- 1,200°C at different oxygen activities [18]
rich spinel and magnetite is important to the simulation
results. The diffusion coefficients of iron in magnetite log10 aO2 log10 DFe,mag log10 aO2 log10 DFe,spinel
were given by Töpfer et al. [18] for temperatures at 900
−3.23 −7.68 −4.09 −8.45
and 1,400°C. The iron diffusion coefficients were pro- −4.68 −8.59 −5.54 −9.59
posed by Backhaus-Ricoult and Dieckmann [17], but the −6.98 −9.3 −6.53 −9.99
coefficients were only for higher temperature conditions. −7.84 −8.69 −8.91 −9.70
Atkinson et al. [16] confirmed that the iron diffusion co- −8.84 −8.15 −9.55 −9.10
−10 −8.91
efficients can be estimated to 500°C. The iron diffusion
−10.55 −8.55
coefficients in Fe3O4 and Fe2CrO4 were measured atAnalysis of HCM12A steel 57
Table 3: One-dimensional linear regression equation over logarithm values of iron diffusion coefficients and logarithm values of oxygen
activities at 1,200°C, and deterministic coefficient
Oxide Diffusion via interstitials Diffusion via vacancies
Linear regression equation Deterministic coefficient Linear regression equation Deterministic coefficient
Magnetite log10 DFe,mag = − 0.5893 0.9975 log10 DFe,mag = 0.6276 1
log10 aO2 − 13.3433 log10 aO2 − 5.6529
Fe–Cr spinel log10 DFe,spinel = −0.5815 0.9788 log10 DFe,spinel = −0.6276 0.9673
log10 aO2 − 14.6786 log10 aO2 − 5.963
At 600°C, ΔG T = −25,391 J, and the equilibrium at magnetite/supercritical water interface can be evaluated.
PH2 O/ PH2 ratio is 0.03. From dissociation equation, water These values at 500 and 600°C are shown in Table 4.
dissociation reaction rate, Gibbs free energy, and the
equivalent oxygen pressure at steel/Cr-rich spinel inter-
face can be evaluated. The equivalent oxygen partial pres-
sure at steel/Cr-rich spinel interface at 500 and 600°C is
shown in Table 4. 3.5 Thickness of oxide layer and weight gain
Cory and Herrington [21] suggested that the steam par- of the oxide scale
tial pressure is independent of corrosion rate. The oxygen
activity at the interface of magnetite/external layer is not Weight gain of the oxide scales is linear with oxide scale
that of oxidizing medium, but that of magnetite/hematite thickness due to the absorption of oxygen. With the
equilibrium. The hematite layer is very thin and will change increase of exposure time, the internal and external
the oxygen activity at the magnetite/hematite interface. thickness of oxide scale gradually thickens. The thickness
Fe2O3 is formed at the grain boundary of magnetite by relationship between the two oxide layers and weight gain
reaction (12) at the magnetite/supercritical water interface. is estimated by the following formula [22]:
Oxygen transports through short-circuit channels and
M
grain boundary, and the oxide layers become thicker. Δw = ρouter houter o-outer
The equivalent oxygen partial pressure at the magnetite/ MFe3O4
(14)
supercritical water interface is not the dissolved oxygen Mo-inner
+ ρinner hinnter
partial pressure, but satisfies the pressure at equilibrium MFe3O4 − FeCr2 O4
of reaction (12).
where Δw is the amount of absorbed oxygen per unit area
2Fe3 O4 + H2 O → 3Fe 2 O3 + H2 (12) in mg cm−2, ρouter and ρinner are the external and internal
According to Gaskell’s data [20], the standard free layer density (g cm−3), respectively, houter and hinner are
energy of reaction (12) is listed in the following formula: the external and internal layer thickness, respectively,
Mo-outer and Mo-inner are the mole mass of oxygen in
ΔG T = −3,440 + 81.7T . (13)
external and internal layer, respectively, MFe3O4 and
Using the methods above, water dissociation reaction MFe3O4 − FeCr2 O4 are the mole mass of external and internal
rate, Gibbs free energy, and the equivalent oxygen pressure layer, respectively.
Table 4: Thermodynamic data of reaction (10) and (12) at 500 and 600°C
Reaction Temperature/°C ΔGT /J PH2 O/ PH2 Equivalent PO2 (atm)
3Fe + 4H2 O → Fe3 O4 + 4H2 500 −34,746 4.49 × 10⁻³ 2.01 × 10⁻²⁹
600 −25,391 0.03 3.3 × 10⁻²⁵
2Fe3 O4 + H2 O → 3Fe2 O3 + H2 500 59,714 10,846 3.5 × 10⁻²⁰
600 67,884 11,532 2.57 × 10−1658 Li Sun and Weiping Yan
3.6 Illustration of iron diffusion coefficient, According to the above derivation process, the oxygen
oxygen activity, flux of ion and its activity and the position (x/X) in the magnetite layer have
divergence as a function of the location the following relationship:
(x/X) in the oxide scale aO2
∫a (II) DFe,mag d ln aO2
x O b a
= a 2(III) +
Figure 1 shows a schematic diagram of iron and oxygen X ∫
O 2
DFe,mag d ln aO2 a + b a+b (19)
aO2(II)
diffusion in magnetite layer and Cr-rich spinel layer.
During the formation of double oxide scale, iron diffuses a≤x≤b
inward and oxygen diffuses outward. According to Millot’s research [24], the diffusion
The flux of iron in the Cr-rich spinel layer of HCM12A coefficient of oxygen in Fe3O4 at 1,073 and 1,423 K follows
is expressed as [23]: an equation of the form:
2CFe(spinel) DFe,spinel d ln aO2 DO = CPO−21 / 2 + FPO1/2 6 (20)
JFe = (15)
2.4 dx
where C and F are the fitting parameters, respectively.
The above formula is integrated through the Cr-rich
With the data given by Millot, the oxygen diffusion
spinel layer.
coefficient in magnetite can be estimated to the tempera-
aO2(II)
ture applied in this study. Because the data of oxygen
2CFe(spinel)
JFe a =
2.4
∫ DFe,spinel d ln aO2 (16) diffusion coefficient in Cr-rich spinel is not reported,
aO2(I) the oxygen diffusion coefficient is assumed to be the
same as that in magnetite. The results of extrapolation
The equation (15) is integrated from 0 to x,
are in Table 5.
aO2
2CFe(spinel) The flux of oxygen in the Cr-rich spinel layer of
JFe x =
2.4
∫ DFe,spinel d ln aO2 (17) HCM12A is expressed as [23]:
aO2(I)
Co(spinel) Do,spinel dμO2
JO,spinel = − (21)
a, b, and X are the thickness of Cr-rich spinel layer, mag- 2RT dx
netite layer, and whole oxide scale layer, respectively.
where Co(spinel) is the concentration of oxygen ion (mol m−3),
The oxygen activity and the position (x/X) in the Cr-rich
Do,spinel the oxygen diffusion coefficient in Fe–Cr spinel
spinel layer have the following relationship:
layer (m2 s−1), and μO2 the chemical potential of oxygen
aO2
∫a DFe,spinel d ln aO2 (J mol−1).
x O (I) a The relation between oxygen chemical potential and
= a 2(II) 0≤x≤a (18)
X ∫
O2
DFe,spinel d ln aO2 a + b oxygen partial pressure is given as:
aO2(I)
dμO2 = d(μOO2 + RT ln PO2) = RT d ln PO2 (22)
where μO02 is the standard chemical potential of oxygen
(J mol−1), R gas constant (J mol−1 K−1).
With equations (18), (21), and (22), the flux of oxygen
in the Cr-rich spinel layer is derived as follows:
aO2(II)
Co(spinel) Do,spinel
∫a DFe,spinel d ln aO2
JO,spinel = −
O2 (I) (23)
2DFe,spinel a
Table 5: The results of extrapolation of parameter C and parameter F
Temperature (°C) C (m2s−1 atm1/2) F (m2 s−1 atm−1/6)
500 1.74 × 10−36 3.8 × 10⁻²³
Figure 1: Schematic diagram of iron and oxygen diffusion in mag- 600 3.07 × 10⁻³² 5.2 × 10⁻²¹
netite layer and spinel layerAnalysis of HCM12A steel 59
First order derivative of the variable JO,spinel with respect to the independent variable x, i.e., the divergence of
oxygen flux, is derived as:
2
aO2(II)
dJO,spinel Co(spinel) ∫aO2(I) DFe,spinel d ln aO2
=−
dx 2DFe,spinel a2
(24)
2 aO (1 + 2KV aO2 2/ 3) − KV aO1 /23
2 −1 / 3 4
(
1 1
)
− 2 CP−O32 / 2 + 6 FP−O52 / 6 DFe,spinel − Do,spinel − 3 RI Ba−O52 / 3 + RV A 3 2
2/3 2
( 1 + 2KV aO2 )
3
×
DFe,spinel 2
In the same way, the flux of oxygen in the magnetite layer is derived as:
aO2(III)
Co(mag) Do,mag
∫a DFe,mag d ln aO2
JO,mag = −
O2 (II) (25)
2DFe,mag b
The divergence of oxygen flux in magnetite layer is expressed:
2
aO2(III)
dJO,mag Co(mag) ∫aO2(II) DFe,mag d ln aO2
=−
dx 2DFe,mag a2
(26)
2 aO (1 + 2KV aO2 2/ 3) − KV aO1 /23
2 −1 / 3 4
(
1 1
)
− 2 CPO−23 / 2 + 6 FPO−25 / 6 DFe,mag − Do,mag − 3 Ba−O52 / 3 + A 3 2
2/3 2
( 1 + 2KV aO2 )
3
×
DFe,mag 2
4 Results and analysis to iron diffusion different mechanism in oxide. The iron
diffusion under high oxygen activity follows the vacancy
mechanism and the interstitial mechanism under low
4.1 Iron diffusion coefficient in oxide scale
oxygen activity [9].
In fact, the oxygen activity is low at the steel/Cr-rich
Using equations (4), (5), (6), and (9), iron diffusion coef-
spinel interface, and iron diffuses via interstitial mechanism.
ficients in Fe3O4 and Fe2CrO4 are available at 500 and
The oxygen activity is high at the magnetite/supercritical
600°C. The iron diffusion coefficients are presented over
water interface and iron diffuses via vacancies mechanism.
oxygen activity at 500 and 600°C, as shown in Figure 2.
The oxygen activity at the magnetite/Cr-rich spinel interface
The vacancy diffusion and interstitial diffusion regions of
iron in magnetite at 600°C are shown in the Figure 2.
-3
The kinetics of oxide layer are generally bound up -4
,URQGLIIXVLRQFRHIILFLHQWLQPDJQHWLWHDWć
,URQGLIIXVLRQFRHIILFLHQWLQ&UULFKVSLQHODWć
,URQGLIIXVLRQFRHIILFLHQWLQPDJQHWLWHDWć
with many factors, such as defect properties, defect con- -5 ,URQGLIIXVLRQFRHIILFLHQWLQ&UULFKVSLQHODWć
centration, and oxide microstructure [25]. According to -6
-7
Wagner oxidation theory, the oxidation rate constant -8 Diffusion via vancancies
log10(D)/(cm /s)
Diffusion via interstitials
which depends on the property of the diffusing defect
2
-9
-10
can vary with the oxygen partial pressure. With increasing -11
temperature, the vacancy concentration at the external -12
-13
layer/supercritical water interface is higher than that at
-14
the steel/internal layer interface. The external oxygen par- -15
tial pressure increases and the vacancy concentration -16
-17
increases too. The conversion between a vacancy and an
-35 -30 -25 -20 -15 -10
interstitial mechanism depends on the temperature and log10(aO )
2
external oxygen activity. There is a strong correlation
between iron self-diffusion coefficient in oxide layer and Figure 2: Iron diffusion coefficient in magnetite and Cr-rich spinel
oxygen activity, and different oxygen activities correspond over oxygen activity at 500 and 600°C.60 Li Sun and Weiping Yan
needs to be determined by calculation, so it is impossible to HCM12A oxidation weight gain in supercritical water at
predict the diffusion mechanism of the interface. With the 500 and 600°C are shown in Figure 4.
increase of temperature, the iron diffusion coefficient and The relative errors between the simulated values and
the growth rate of oxide film increase. the experimental values of HCM12A oxidation weight
gain at 500 and 600°C are less than 20%, and the calcu-
lated values are consistent with the experimental values
with increasing time.
Without considering the scale pores, bucking, and
4.2 Comparisons between simulation peeling, some errors between simulation and experi-
results and experiment results ments of oxidation rate are present.
According to equations (1)–(9) and (14), the simulation of
HCM12A in supercritical water at 500 and 600°C under
25 MPa was carried out. The simulation results and experi- 4.3 Comparison of oxidation rates
ment results of oxide weight gain are compared in Figure 3.
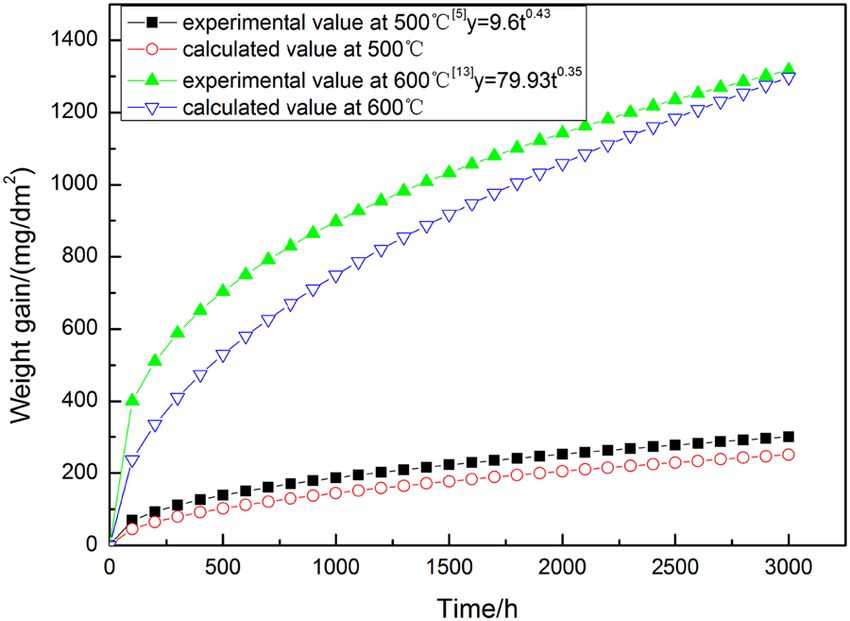
In ref. [5,13], oxidation tests of HCM12A exposed to From the above relational expression, the oxidation rates
SCW at 500 and 600°C, and 25 MPa are performed for of each layer and the overall oxidation rate are calculated
oxidation time from 1 to 3,000 h. The dissolved oxygen and compared with the data in EPRI [26]. These values
concentration in supercritical water is less than 20 ppb. are shown in Table 6.
The simulated values of oxidation weight gain of The oxidation rates of simulation for HCM12A at 500
HCM12A at 500 and 600°C are lower than the experi- and 600°C agree with that of the data in EPRI [26] in the
mental values. The maximum difference in weight gain same order. Because of the errors of diffusion coefficients
at 600°C is 178 mg dm−2, and the equivalent thickness is which were estimated to be at low temperature, the oxi-
12.7 µm according to the formula (14). The maximum dif- dation rate of simulation is lower. The oxidation rate of
ference in weight gain at 500°C is 49 mg dm−2, and the simulation of HCM12A at 600°C is nearly 100 times higher
equivalent thickness is 3.5 µm. The reason for the differ- than that at 500°C.
ence may be that the equilibrium oxygen partial pressure
of the selected reaction (10) is higher than the actual
oxygen partial pressure of the steel/Cr-rich spinel inter-
face at this temperature, or the thermodynamic equili- 4.4 Analysis of oxygen activities and iron
brium oxygen partial pressure of the reaction (12) is lower diffusion coefficients in oxide scale
than the actual oxygen partial pressure at the magnetite/
supercritical water interface. The oxygen partial pressures at the oxide interfaces
Over 3,000 h of oxidation, the relative errors between HCM12A at 500 and 600°C are shown in Table 6. When
the predicted values and the experimental values of
40 ć
ć
30
Relative error/%
20
10
0
0 500 1000 1500 2000 2500 3000
Time/h
Figure 4: Relative errors between the simulated values and the
Figure 3: Simulation results and experiment results of oxidation experimental values of HCM12A oxidation weight gain in super-
weight gain of HCM12A in supercritical water at 500 and 600°C. critical water at 500 and 600°C.Analysis of HCM12A steel 61
Table 6: The oxidation rate of internal and external oxides, kmag , kspinel , the overall oxidation rate, koxide , and oxygen partial pressure of
interfaces
Alloy Temperature/°C Oxidation rate constant/(cm2 s−1) Oxygen partial pressure at interfaces/atm
kmag kspinel k oxide kEPRI[24] palloy/spinel pspinel/mag pmag/scw
HCM12A 500 8.08 × 10⁻¹⁴ 7.03 × 10⁻¹⁴ 3.01 × 10⁻¹³ 2.6 × 10⁻¹² 2.01 × 10⁻²⁹ 1.68 × 10⁻²⁰ 3.5 × 10⁻²⁰
600 2.16 × 10⁻¹² 1.88 × 10⁻¹² 8.06 × 10⁻¹² 10.1 × 10⁻¹² 3.36 × 10⁻²⁵ 1.12 × 10⁻¹⁶ 2.57 × 10⁻¹⁶
HCM12A is oxidized at 600°C, the oxygen activities It can be seen from Figures 5 and 6 that the oxygen
on both sides of the Cr-rich layer are 3.36 × 10⁻²⁵ and activity in the oxide scale suddenly increases at a certain
1.12 × 10⁻¹⁶, respectively. From Figure 2, there is a change position, and the iron diffusion coefficient reaches the
diffusion of iron via from interstitials to vacancies. The minimum value. It is possible to form pores at the loca-
oxygen activities on both sides of the magnetite layer tion of the minimum iron diffusion coefficient. Figure 6
are 1.12 × 10⁻¹⁶ and 2.57 × 10⁻¹⁶ , and iron diffusion fol- shows relationship between iron diffusion coefficient and
lows the vacancy diffusion mechanism. At 500°C, the normalized position (x/X) in oxide scale on HCM12A at
oxygen activities on both sides of Cr-rich spinel layer 600 and 500°C. When the normalized position is about
are 2.01 × 10⁻²⁹ and 1.68 × 10⁻²⁰, and there is a change 0.05 at 500°C, the iron diffusion coefficient of oxide scale
diffusion of iron via from interstitials to vacancies. The formed on HCM12A reaches the minimum. The higher the
oxygen activities on both sides of the magnetite layer are experimental temperature, the closer the location of pores
1.68 × 10⁻²⁰ and 3.5 × 10⁻²⁰, and iron diffusion conforms to the internal layer/external layer interface.
to the vacancy diffusion mechanism.
The normalized position (x/X) is used to express
the iron diffusion coefficient in oxide scale of HCM12A 4.5 Flux of oxygen ion and its divergence in
in supercritical water for 3,000 h. Figure 5 shows the
oxide scale
relationship between the calculated oxygen activities
and the normalized position (x/X) in the oxide scale on
Figures 7–10 show the calculated results in oxide scale
HCM12A at 600 and 500°C. Figure 6 shows the relation-
formed on HCM12A in supercritical water for 3,000 h at
ship between the iron diffusion coefficient and the nor-
600 and 500°C. Figure 7 shows the change of the flux of
malized position (x/X) in the oxide scale on HCM12A.
oxygen ion in oxide scale formed on HCM12A at 600 and
The oxygen activity in the oxide scale of HCM12A steel
500°C over normalized position. The flux of oxygen ion in
is continuous, but the iron diffusion coefficient at the
the double oxide scale is negative. In the case of oxida-
interface between the internal and external layers is
tion of HCM12A at 600°C, the sudden change in the flux of
discontinuous.
1E-15
-12.0
1E-16
1E-17 -12.5
1E-18 -13.0
1E-19
-13.5
1E-20
-14.0
ć
ć
log10(DFe)
1E-21 ć
ć
2
1E-22 -14.5
aO
1E-23
-15.0
1E-24
-15.5
1E-25
1E-26 -16.0
Cr-rich spinel Magnetite
1E-27
-16.5
1E-28
-17.0
1E-29
0.0 0.1 0.2 0.3 0.4 0.5 0.6 0.7 0.8 0.9 1.0 0.0 0.1 0.2 0.3 0.4 0.5 0.6 0.7 0.8 0.9 1.0
x/X x/X
Figure 5: Model predictions of oxygen activities in oxide scale on Figure 6: Relationship between iron diffusion coefficient and nor-
HCM12A as a function of normalized position. malized position (x/X) in oxide scale on HCM12A.62 Li Sun and Weiping Yan
oxygen ion occurs at the interface between the internal 5 A case verification of a power
oxide and the external oxide. The flux of oxygen ion
sharply increases at a certain position (x/X = 0.11) and
plant
the normalized position (x/X = 0.05) in the magnetite
In the above sections, the oxidation kinetics model of
layer during oxidation at 600 and 500°C, respectively.
ferritic–martensitic steel was verified by the experimental
Figure 8 shows logarithm of negative of flux of
data of Bischoff [5,13]. In this section, the last stage
oxygen ion in the double oxide scale of HCM12A at 500
superheater tube (T91) of a power plant is taken as the
and 600°C. The flux of oxygen ion in the double oxide
research object, and the thickness of oxide scale on the
scale is discontinuous at the Cr-rich spinel layer/magne-
steam side of the last stage superheater is predicted with
tite layer interface.
the above method. The predicted results are compared
Figure 9 shows divergence of oxygen ion flux in the
with the in situ measurement data and the results calcu-
double oxide scale. At 600°C, the divergence of flux of
lated by EPRI’s oxidation kinetic parameters.
oxygen ion in oxide scale is negative at the range from the
Since the SG2080/25.4-M969 boiler of a 600 MW super-
substrate/Cr-rich spinel layer interface to the normalized
critical boiler in a power plant was put into operation,
position (x/X = 0.11). The divergence of flux of oxygen ion
oxide scale exfoliation has become a prominent problem.
at the Cr-rich spinel layer/magnetite layer interface is
The oxide scale thickness at 13,000, 21,000, 25,000, and
discontinuous. Then the divergence of flux of oxygen
36,000 h at the outlet of the last stage superheater was
ion becomes positive from this position to the surface.
measured by ultrasonic technique. The range of oxide thick-
The drastic change at the normalized position (x/X =
ness is shown in Table 7.
0.11) indicates pore formation. At 500°C, divergence of
According to the above model and relative basic heat
flux of oxygen ion in the double oxide scale is negative
transfer theory, the growth model of oxide scale on
at the range from substrate/Cr-rich spinel layer interface
superheater tubes is put forward by iterative technology
to the normalized position (x/X = 0.05). The drastic
[27]. The relevant parameters are from EPRI report [26].
change at the normalized position (x/X = 0.05) indicates
The forecast thickness results of oxide scale on boiler
pore formation. Then divergence of flux of oxygen ion
superheater tubes for different service time are given,
becomes positive from this position to the surface.
as shown in Figure 11.
Figure 10 shows logarithm of the divergence of flux of
Figure 11 shows the simulation of oxide scale thick-
oxygen ion in oxide scale on HCM12A at 600 and 500°C
ness, in situ measurement data, and calculation results
over normalized position. Flux of oxygen ion and its
predicted by a method in ref. [27]. As can be seen from the
divergence in oxide scale are discontinuous at the Cr-
figure, the predicted results are reliable. The calculated
rich spinel layer/magnetite layer interface, which indi-
results of this method and the method in ref. [27] are close
cates pores probably form at this interface.
to the in situ measured data. The oxide scale may peel off
1.00E-011
0.00E+000
0.00E+000
-1.00E-011 -1.00E-014
Cr-rich spinel magnetite
-2.00E-011 -2.00E-014
Cr-rich spinel magnetite
-2 -1
-3.00E-011
JO /mol m s
-2 -1
JO /mol m s
-3.00E-014
-4.00E-011
-4.00E-014
2
-5.00E-011
2
-6.00E-011 -5.00E-014
-7.00E-011
-6.00E-014
-8.00E-011
-7.00E-014
0.0 0.1 0.2 0.3 0.4 0.5 0.6 0.7 0.8 0.9 1.0 0.0 0.1 0.2 0.3 0.4 0.5 0.6 0.7 0.8 0.9 1.0
x/X x/X
Figure 7: Calculated flux of oxygen ion in oxide scale on HCM12A at 500°C (left) and 600°C (right) over normalized position.Analysis of HCM12A steel 63
-9.5 -13
-10.0
-10.5
-11.0
-11.5 -14
-2 -1
-12.0
log10(-JO )/mol m s
-2 -1
log10(-JO )/mol m s
-12.5
-13.0
-13.5 -15
2
2
-14.0
-14.5
-15.0
-15.5 Magnetite -16 Magnetite
Cr-rich spinel Cr-rich spinel
-16.0
-16.5
0.0 0.1 0.2 0.3 0.4 0.5 0.6 0.7 0.8 0.9 1.0 0.0 0.1 0.2 0.3 0.4 0.5 0.6 0.7 0.8 0.9 1.0
x/X x/X
Figure 8: Logarithm of negative of the flux of oxygen ion in oxide scale on HCM12A at 500°C (left) and 600°C (right) over normalized position.
0.008
0.0000006
0.006 0.0000005
0.0000004
-1
dJO /dx / mol m s
-1
dJO /dx / mol m s
0.004
-3
-3
0.0000003
0.0000002
0.002 magnetite
Cr-rich spinel magnetite
Cr-rich spinel
2
0.0000001
2
0.000 0.0000000
-0.0000001
-0.002
0.0 0.1 0.2 0.3 0.4 0.5 0.6 0.7 0.8 0.9 1.0 0.0 0.1 0.2 0.3 0.4 0.5 0.6 0.7 0.8 0.9 1.0
x/X x/X
Figure 9: Divergence of flux of oxygen ion in oxide scale on HCM12A at 500°C (left) and 600°C (right) over normalized position.
-2 -6
-7
log10(dJO /dx) / (mol m s )
log10(dJO /dx) / (mol m s )
-1
-1
-4
-3
-3
-8
-6
-9
2
2
-8 Cr-rich spinel magnetite -10
-11
-10
Cr-rich spinel magnetite
-12
-12
0.0 0.1 0.2 0.3 0.4 0.5 0.6 0.7 0.8 0.9 1.0 0.1 0.2 0.3 0.4 0.5 0.6 0.7 0.8 0.9 1.0
x/X x/X
Figure 10: Logarithm of the divergence of flux of oxygen ion in oxide scale formed on HCM12A at 500°C (left) and 600°C (right) over
normalized position.64 Li Sun and Weiping Yan
Table 7: In situ measurement data and predicted results of oxide scale thickness
Exposure time/h In situ measurement data of oxide Predicted results of oxide scale Proportional error compared with the
scale thickness/μm thickness/μm maximum value/%
10,000 116–148 172.2 16.4
21,000 188–209 218.9 4.7
25,000 187–225 238.8 6.1
36,000 144–258 286.6 11.1
(12) is adopted for the magnetite/supercritical water
Minimum values of in-situ measurement data
300 Maximum values of in-situ measurement data interface. The calculated rate constant is close to the
simulation results
Results according to a method in Ref. [27] experimental value. The relative errors between the
250
simulated values and the experimental values of HCM12A
Oxide scale thickness/μm
200 oxidation weight gain at 500 and 600°C are less than
20%, and the predicted values are consistent with the
150 experimental data with increasing time. The errors are
due to the predicted calculation of iron diffusion coeffi-
100
cient from high temperature to low temperature accord-
50 ing to the Töpfer’s data [18].
3. According to the data of Backhaus and Töpfer, the dif-
0
0 5000 10000 15000 20000 25000 30000 35000 40000
fusion coefficient values of iron in Fe3O4 are discussed
Exposure time of T91 steel tube/h and RV , RI as the function of oxygen activity can be used
for calculation of iron diffusion coefficients in Fe2CrO4.
Figure 11: The oxide scale thickness of last stage superheater tubes
4. The oxygen activity in the oxide scale of HCM12A steel
for in situ measurement data, predicted results, and calculation
results according to a method in ref. [27]. is continuous, but the iron diffusion coefficient at the
interface between the internal and external layers is
discontinuous. The oxygen activity in the oxide scale
during the running of boiler, so the predicted results of suddenly increases at a certain position, and the iron
the oxide layer thickness are larger than the maximum diffusion coefficient reaches the minimum value. It is
value of in situ measured data. possible to form pores at the location of the minimum
iron diffusion coefficient.
5. This oxidation kinetics model of HCM12A in supercri-
tical water can be applied to other ferritic–martensitic
steels.
6 Conclusion
The oxidation kinetics of ferritic–martensitic steel HCM12A Funding information: This project was funded by Basic
in supercritical water at 500 and 600°C can be predicted Scientific Research Business Expenses of Central Universities
by simulation. According to the data of Backhaus-Ricoult (2014MS107).
and Dieckmann [17] and Töpfer et al. [18], the diffusion
coefficient of iron in Fe3O4 and Fe2CrO4 is extrapolated at Author contributions: Weiping Yan contributed to con-
low temperature. The followings are the major conclusions: ceptualization and methodology; Li Sun performed data
1. The calculated value of oxidation weight gain of HCM12A analyses and manuscript.
at 500 and 600°C is close to the experimental value
[5,13]. Conflict of interest: The authors have no conflicts of
2. The calculated value of oxidation rate is closely related interest to declare.
to the value of oxygen partial pressure at the interfaces.
The equilibrium oxygen partial pressure of reaction Data availability statement: The raw/processed data of
(10) is adopted for the steel/Cr-rich spinel interface, these findings can be shared by contacting the corre-
and the equilibrium oxygen partial pressure of reaction sponding author.Analysis of HCM12A steel 65
References [14] Ampornrat, P. Determination of oxidation mechanisms of
ferritic–martensitic alloys in supercritical water. The University
[1] Klueh, R. L. and A. T. Nelson. Ferritic/martensitic steels for of Michigan, Michigan, 2011.
next-generation reactors. Journal of Nuclear Materials, [15] Martinelli, L., F. Balbaud–Célérier, A. Terlain, S. Bosonnet,
Vol. 371, No. 1–3, 2007, pp. 37–52. G. Picard, and G. Santarini. Oxidation mechanism of an
Fe–9Cr–1Mo steel by liquid Pb–Bi eutectic alloy at 470°C (Part II).
[2] Yin, K., S. Y. Qiu, R. Tang, Q. Zhang, L. F. Zhang, H. Liu, et al.
Corrosion Science, Vol. 50, No. 9, 2008, pp. 2537–2548.
Corrosion behavior of steel P92 in supercritical water.
[16] Atkinson, A., M. L. O’dwyer, and R. I. Taylor. 55Fe diffusion in
Corrosion and Protection, Vol. 31, No. 5, 2010, pp. 334–337.
magnetite crystals at 500°C and its relevance to oxidation of iron.
[3] Geng, B., L. Zhang, N. Q. Fan, Z. X. Xia, and J. N. Liu. Effect of
Journal of Materials Science, Vol. 18, No. 8, 1983, pp. 371–2379.
water vapor temperature and flow on oxidation behavior of T91
[17] Backhaus-Ricoult, M. and R. Dieckmann. Defects and cation
heat resisting steel. Journal of materials engineering, Vol. 0,
diffusion in magnetite (VII) diffusion controlled formation of
No. 1, 2014, pp. 52–57.
magnetite during reactions. Berichte der Bunsengesellschaft
[4] Xu, H. A discussion on exfoliation behavior of duplex scales
für physikalische Chemie, Vol. 90, No. 8, 1986, pp. 690–698
based on ecocide hypothesis. Journal of Chinese Society of
[18] Töpfer, J., S. Aggarwal, and R. Dieckmann. Point defects and
Power Engineering, Vol. 32, No. 9, 2012, pp. 734–739.
cation tracer diffusion in (CrxFe1−X)3−δO4 spinels. Solid State
[5] Bischoff, J., A. T. Motta, C. Eichfeld, R. J. Comstock, G. Cao, and
Ionics, Vol. 81, No. 3–4, 1995, pp. 251–266.
T. R. Allen. Corrosion of ferritic–martensitic steels in steam
[19] Furukawa, T., G. Müller, G. Schumacher, A. Weisenburger,
and supercritical water. Journal of Nuclear Materials, Vol. 441,
No. 1–3, 2013, pp. 604–611. A. Heinzel, and K. Aoto. Effect of oxygen concentration and
[6] Zhong, X., X. Wu, and E. H. Han. Effects of exposure tem- temperature on compatibility of ODS steel with liquid,
perature and time on corrosion behavior of a ferritic–marten- Stagnant Pb45 Bi55. Journal of Nuclear Materials, Vol. 335,
sitic steel P92 in aerated supercritical water. Corrosion No. 2, 2004, pp. 189–193.
Science, Vol. 90, No. 23, 2015, pp. 511–521. [20] Gaskell, D. R., Eds. Introduction to metallurgical thermo-
[7] Tan, L., X. Ren, and T. R. Allen. Corrosion behavior of 9–12% Cr dynamics. Taylor & Francis, London, 1981.
ferritic–martensitic steels in supercritical water. Corrosion [21] Cory, N. J. and T. M. Herrington. The location of hydrogen in the
Science, Vol. 52, No. 4, 2010, pp. 1520–1528. kinetics of oxidation of ferrous alloys by superheated steam.
[8] Wright, I. G. and R. B. Dooley. A review of the oxidation Oxidation of Metals, Vol. 29, No. 1–2, 1988, pp. 135–152.
behaviour of structural alloys in steam. International Materials [22] Zhang, N. Q., H. Xu, B. R. Li, Y. Bai, and D. Y. Liu. Influence of
Reviews, Vol. 55, No. 3, 2010, pp. 129–167. the dissolved oxygen content on corrosion of the ferritic–
[9] Martinelli, L., F. Balbaud-célérier, G. Picard, and G. Santarini. martensitic steel P92 in supercritical water. Corrosion Science,
Oxidation mechanism of a Fe–9Cr–1Mo steel by liquid Pb–Bi Vol. 56, 2012, pp. 123–128.
eutectic alloy (Part III). Corrosion Science, Vol. 50, No. 9, 2008, [23] Maruyama, T., N. Fukagai, M. Ueda, and K. Kawamura.
pp. 2549–2559. Chemical potential distribution and void formation in magne-
[10] Rouillard, F. and L. Martinelli. Corrosion of 9Cr steel in CO2 at tite scale formed in oxidation of iron at 823 K. Materials
intermediate temperature III: Modelling and simulation of Science Forum, Vol. 461–464, 2004, pp. 807–814.
void-induced duplex oxide growth. Oxidation of Metals, [24] Millot, F., J. C. Lorin, B. Klossa, Y. Niu, and J. R. Tarento. Oxygen
Vol. 77, No. 1, 2012, pp. 71–83. self-diffusion in Fe3O4: An experimental example of inter-
[11] Zieliński, A., G. Golański, M. Sroka, and T. Tański. Influence of actions between defects. Berichte Der Bunsen-Gesellschaft-
long–term service on microstructure, mechanical properties, Physical Chemistry, Vol. 101, No. 9, 1997, pp. 1351–1354.
and service life of HCM12A steel. Materials at High [25] Schmucker, E., C. Petitjean, L. Martinelli, P. J. Panteix, S. B.
Temperatures, Vol. 33, No. 1, 2016, pp. 24–32. Lagha, and M. Vilasi. Oxidation of Ni-Cr alloy at intermediate
[12] Zieliński, A., H. Paszkowska, P. Skupień, and G. Golański. oxygen pressures. I. Diffusion mechanisms through the oxide
Assessment of service life of HCM12 steel after 100,000 hrs of layer. Corrosion Science, Vol. 111, 2016, pp. 474–485.
service. Archives of Metallurgy and Materials, Vol. 61, No. 2B, [26] Wright, I. G., P. F. Toetorelli, and M. Schütze. Program on tech-
2016, pp. 1021–1029. nology innovation oxide growth and exfoliation on alloys exposed
[13] Bischoff, J. and A. T. Motta. Oxidation behavior of ferritic– to steam. Electric Power research institure, California, USA, 2007.
martensitic and ODS steels in supercritical water. [27] Sabau, A. S. and I. G. Wright. On the estimation of thermal
Journal of Nuclear Materials, Vol. 424, No. 1–3, 2012, strains developed during oxide growth. Journal of Applied
pp. 261–276. Physics, Vol. 106, No. 2, 2009, pp. 023503-1–8.You can also read