Pigeon Lake Report 2019 - Battle River Watershed Alliance
←
→
Page content transcription
If your browser does not render page correctly, please read the page content below

Pigeon Lake Report
2019
ALBERTA LAKE MANAGEMENT
                           SOCIETY’S LAKEWATCH PROGRAM
                            LakeWatch has several important objectives, one of which is to collect and interpret
                            water quality data from Alberta’s Lakes. Equally important is educating lake users
                            about aquatic environments, encouraging public involvement in lake management,
                            and facilitating cooperation and partnerships between government, industry, the
                            scientific community and lake users. LakeWatch reports are designed to summarize
                            basic lake data in understandable terms for the widest audience, and are not meant
                            to be a complete synopsis of information about specific lakes. Additional
                            information is available for many lakes that have been included in LakeWatch, and
                            readers requiring more information are encouraged to seek those sources.

                            ALMS would like to thank all who express interest in Alberta’s aquatic
                            environments, and particularly those who have participated in the LakeWatch
                            program. These leaders in stewardship give us hope that our water resources will
                            not be the limiting factor in the health of our environment.

                            If you require data from this report, please contact ALMS for the raw data files.

               ACKNOWLEDGEMENTS
The LakeWatch program is made possible through the dedication of its volunteers. A
special thanks to Bob Gibbs and Daren Lorentz for their commitment to collecting
data at Pigeon Lake. We would also like to thank Sarah Davis Cornet, Caleb Sinn, and
Pat Heney, who were summer technicians in 2019. Executive Director Bradley Peter
and Program Coordinator Caitlin Mader were instrumental in planning and
organizing the field program. This report was prepared by Pat Heney, Bradley Peter,
and Caleb Sinn.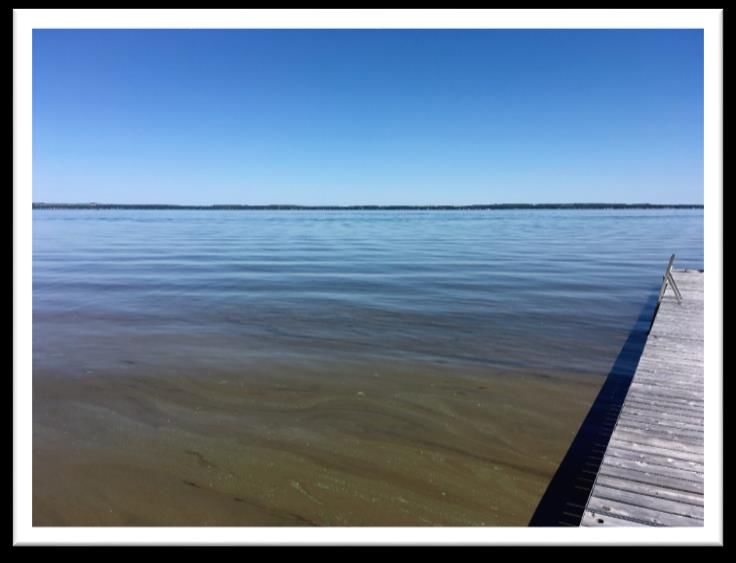
PIGEON LAKE
Pigeon Lake is a large (96.32 km2), shallow
(average depth = 6m) lake located in the
counties of Wetaskiwin and Leduc. It is a
popular recreational lake within easy
driving distance from the cities of
Edmonton, Leduc, and Wetaskiwin. Pigeon
Lake lies within the Battle River watershed.
Water flows into the lake through
intermittent streams draining the west and
northwest portions of the watershed. The
outlet, Pigeon Lake Creek, at the southeast
margin of the lake, drains toward the
Battle River.1 The lake’s drainage basin is     Pigeon Lake at Poplar Bay 2017 (Photo by Laura Redmond)
                   2
small (176.62 km ) but heavily developed
with agriculture, oil and gas, and community developments.2

The lake name is a translation from the Cree Mehmew Sâkâhikan, which means ‘Dove Lake’, but by
1858 the name Pigeon Lake was in use.3 It has been suggested that the name Pigeon Lake refers to
the huge flocks of Passenger Pigeons that once ranged in the area.1 The lake was also previously
known as Woodpecker Lake, and the Stoney name is recorded as Ke-gemni-wap-ta.3 The water
quality of Pigeon Lake is typical of large, productive, shallow lakes in Alberta, with water remaining
quite green for most of the summer. However, residents have recently expressed concern over
perceptions of deteriorating water quality as a result of recurring blue-green algal blooms, fish kills,
and beach advisories4. Due to these concerns, there has been a demand to examine ways to reduce
the frequency and intensity of cyanobacteria blooms. In 2013, data was collected to prepare a
nutrient budget for Pigeon Lake - this report was later released in 2014 and it outlines areas of
interest when considering watershed and in-lake management options5. In 2018 the Pigeon Lake
Watershed Association released their Pigeon Lake Watershed Management Plan which can be
accessed via www.plwmp.ca.

The watershed area for Pigeon Lake is 176.62 km2 and the lake area is 97.32 km2. The lake to
watershed ratio of Pigeon Lake is 1:2. A map of the Pigeon Lake watershed area can be found
http://alms.ca/wp-content/uploads/2016/12/Pigeon.pdf.

1Mitchell, P. and Prepas, E. (1990). Atlas of Alberta Lakes, University of Alberta Press. Retrieved from
http://sunsite.ualberta.ca/projects/alberta-lakes/
2 Teichreb, C., Peter, B. and Dyer, A. (2013). 2013 Overview of Pigeon lake Water Quality, Sediment Quality, and Non-

Fish Biota. 2 pp.
3 Aubrey, M. K. (2006). Concise place names of Alberta. Retrieved from

http://www.albertasource.ca/placenames/resources/searchcontent.php?book=1
4 Aquality Environmental Consulting. (2008). Pigeon Lake State of Watershed Report. Prepared for Pigeon Lake

Watershed Alliance. Retrieved from: www.plwa.ca.
5 Teichreb, C. (2014). Pigeon Lake Phosphorus Budget. Alberta Environment and Sustainable Resource Development.

28 pp.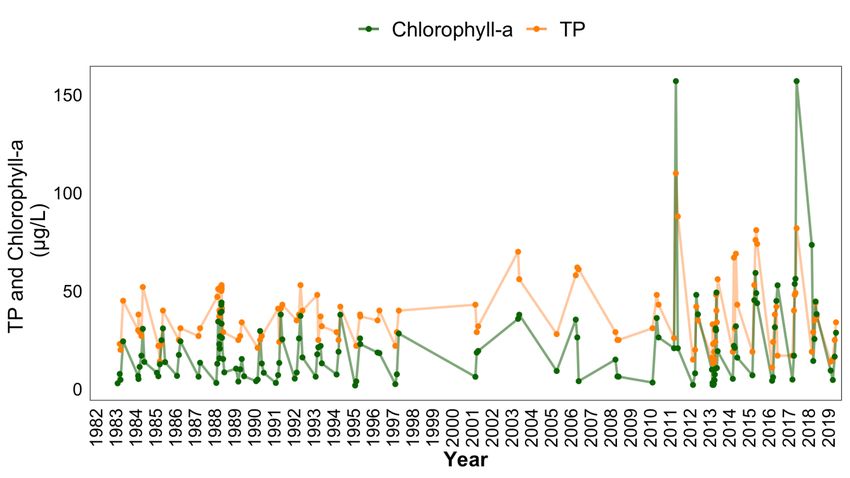
METHODS
Profiles: Profile data is measured at the deepest spot in the main basin of the lake. At the profile site,
temperature, dissolved oxygen, pH, conductivity and redox potential are measured at 0.5 – 1.0 m intervals.
Additionally, Secchi depth is measured at the profile site and used to calculate the euphotic zone. For select
lakes, metals are collected at the profile site by hand grab from the surface on one visit over the season.

Composite samples: At 10-sites across the lake, water is collected from the euphotic zone and combined
across sites into one composite sample. This water is collected for analysis of water chemistry, chlorophyll-a,
nutrients and microcystin. Quality control (QC) data for total phosphorus was taken as a duplicate true split
on one sampling date. ALMS uses the following accredited labs for analysis: Routine water chemistry and
nutrients are analyzed by Maxxam Analytics, chlorophyll-a and metals are analyzed by Innotech Alberta, and
microcystin is analyzed by the Alberta Centre for Toxicology (ACTF).

Invasive Species: : Invasive mussel monitoring involved sampling with a 63 μm plankton net at three sample
sites twice through the summer season to determine the presence of juvenile dreissenid mussel veligers.
Technicians also harvested potential Eurasian watermilfoil (Myriophyllum spicatum) samples and submitted
them for further analysis at the Alberta Plant Health Lab to genetically differentiate whether the sample was
the invasive Eurasian watermilfoil or a native watermilfoil. In addition, select lakes were subject to a bioblitz,
where a concerted effort to sample the lake’s aquatic plant diversity took place.

Data Storage and Analysis: Data is stored in the Water Data System (WDS), a module of the Environmental
Management System (EMS) run by Alberta Environment and Parks (AEP). Data goes through a complete
validation process by ALMS and AEP. Users should use caution when comparing historical data, as sampling
and laboratory techniques have changed over time (e.g. detection limits). For more information on data
storage, see AEP Surface Water Quality Data Reports at www.alberta.ca/surface-water-quality-data.aspx.

Data analysis is done using the program R.1 Data is reconfigured using packages tidyr 2 and dplyr 3 and figures
are produced using the package ggplot2 4. Trophic status for each lake is classified based on lake water
characteristics using values from Nurnberg (1996)5. The Canadian Council for Ministers of the Environment
(CCME) guidelines for the Protection of Aquatic Life are used to compare heavy metals and dissolved oxygen
measurements. Pearson’s Correlation tests are used to examine relationships between total phosphorus (TP),
chlorophyll-a, total kjeldahl nitrogen (TKN) and Secchi depth, providing a correlation coefficient (r) to show
the strength (0-1) and a p-value to assess significance of the relationship.

1R Core Team (2016). R: A language and environment for statistical computing. R Foundation for Statistical Computing, Vienna,
Austria. URL https://www.R-project.org/.
2 Wickman, H. and Henry, L. (2017). tidyr: Easily Tidy Data with ‘spread ( )’ and ‘gather ( )’ Functions. R package version 0.7.2.

https://CRAN.R-project.org/package=tidyr.
3 Wickman, H., Francois, R., Henry, L. and Muller, K. (2017). dplyr: A Grammar of Data Manipulation. R package version 0.7.4.

http://CRAN.R-project.org/package=dplyr.
4 Wickham, H. (2009). ggplot2: Elegant Graphics for Data Analysis. Springer-Verlag New York.
5Nurnberg, G.K. (1996). Trophic state of clear and colored, soft- and hardwater lakes with special consideration of nutrients,

anoxia, phytoplankton and fish. Lake and Reservoir Management 12: 432-447.
BEFORE READING THIS REPORT, CHECK
OUT A BRIEF INTRODUCTION TO
LIMNOLOGY AT ALMS.CA/REPORTS
WATER CHEMISTRY
ALMS measures a suite of water chemistry parameters. Phosphorus, nitrogen, and chlorophyll-a are
important because they are indicators of eutrophication, or excess nutrients, which can lead to harmful
algal/cyanobacteria blooms. One direct measure of harmful cyanobacteria blooms are Microcystins, a
common group of toxins produced by cyanobacteria. See Table 2 for a complete list of parameters.
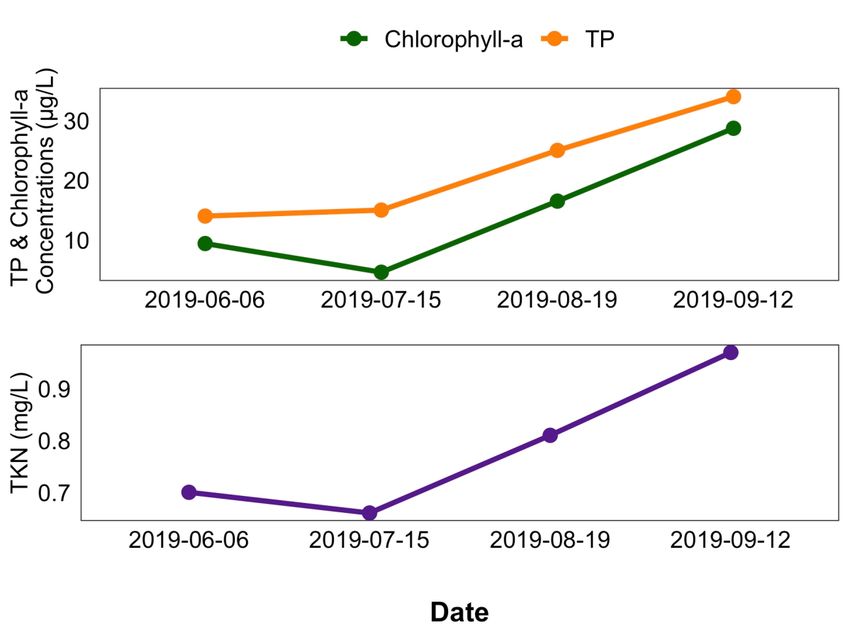
The average total phosphorus (TP) concentration for Pigeon Lake was 22 μg/L (Table 2), falling into the
mesotrophic, or moderately productive trophic classification. This value falls within the range of historical
averages. Detected TP was lowest when first sampled in June at 14 μg/L, and peaked at 34 μg/L in September
(Figure 1).
Average chlorophyll-a concentrations in 2019 was 15 μg/L (Table 2), falling into the category of eutrophic, or
highly productive trophic classification. Chlorophyll-a was highest in September at 28.7 μg/L and reached its
lowest point of 4.6 μg/L on July 15.
Finally, the average TKN concentration was 0.8 mg/L (Table 2) with concentrations peaking on September 12
at 1.0 mg/L.
Average pH was measured as 8.51 in 2019, buffered by moderate alkalinity (168 mg/L CaCO3) and
bicarbonate (195 mg/L HCO3). Calcium was the dominant ion contributing to a low conductivity of 333 μS/cm
(Table 2).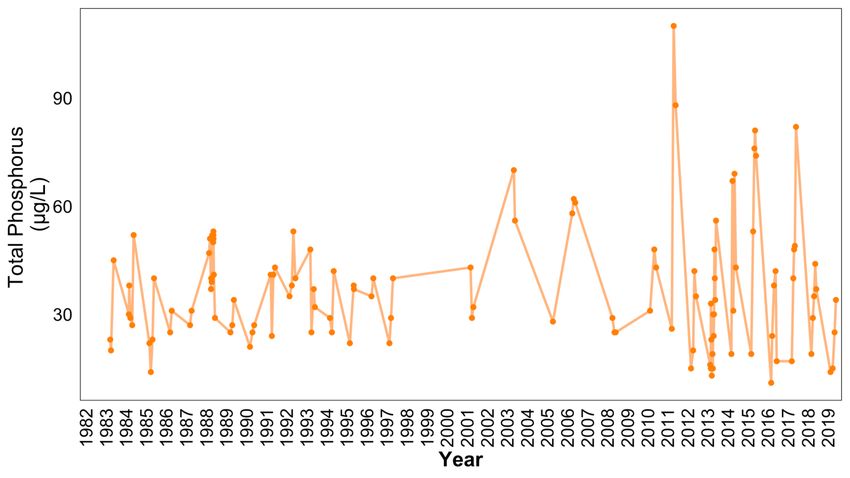
Figure 1. Total Phosphorus (TP), Total Kjeldahl Nitrogen (TKN), and Chlorophyll-a concentrations measured
four times over the course of the summer at Pigeon Lake.

METALS
Samples were analyzed for metals once throughout the summer (Table 3). In total, 27 metals were sampled
for. It should be noted that many metals are naturally present in aquatic environments due to the
weathering of rocks and may only become toxic at higher levels.

Metals were not measured in Pigeon Lake in 2019. Table 3 presents historical metal concentrations from
previously measured years.
WATER CLARITY AND SECCHI DEPTH
Water clarity is influenced by suspended materials, both living and dead, as well as dissolved colored
compounds in the water column. During the melting of snow and ice in spring, lake water can become
turbid (cloudy) from silt transported into the lake. Lake water usually clears in late spring but then becomes
more turbid with increased algal growth as the summer progresses. The easiest and most widely used
measure of lake water clarity is the Secchi depth. Two times the Secchi depth equals the euphotic depth –
the depth to which there is enough light for photosynthesis.

The average Secchi depth of Pigeon Lake in 2019 was 2.94 m (Table 2). This depth was shallowest on August
19, indicating relatively lower water clarity. Secchi depth was deepest on July 15, indicating higher water
clarity (Figure 2).

Figure 2. Secchi depth values measured four times over the course of the summer at Pigeon Lake in 2019.
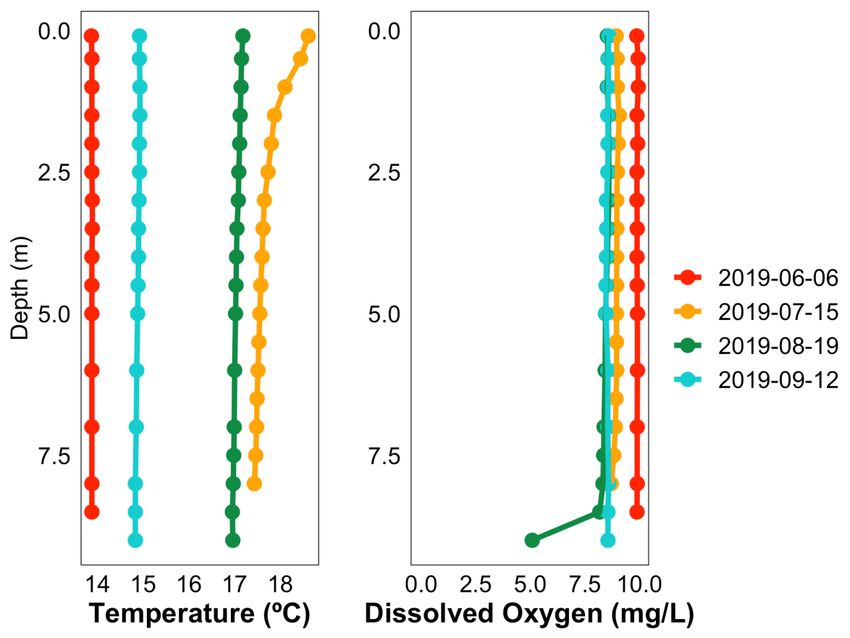
WATER TEMPERATURE AND DISSOLVED OXYGEN
Water temperature and dissolved oxygen (DO) profiles in the water column can provide information on
water quality and fish habitat. The depth of the thermocline is important in determining the depth to which
dissolved oxygen from the surface can be mixed. Please refer to ALMS’ Brief Introduction to Limnology for
descriptions of technical terms.

Temperatures of Pigeon Lake varied throughout the summer, with a minimum temperature of 13.9 °C
through the entire water column on June 6, and a maximum temperature of 18.6 °C measured at the surface
on July 15 (Figure 3a). The lake was not stratified during any of the samplings, with temperatures remaining
relatively constant from top to bottom. This indicates partial or complete mixing throughout the season.

Pigeon Lake remained well oxygenated through most of the water column throughout the summer,
measuring above the CCME guidelines of 6.5 mg/L dissolved oxygen (Figure 3b). The oxygen level fell below
this level close to lake bottom on August 19.

Figure 3. a) Temperature (°C) and b) dissolved oxygen (mg/L) profiles for Pigeon Lake measured four times
over the course of the summer of 2019.

MICROCYSTIN
Microcystins are toxins produced by cyanobacteria (blue-green algae) which, when ingested, can cause
severe liver damage. Microcystins are produced by many species of cyanobacteria which are common to
Alberta’s Lakes, and are thought to be the one of the most common cyanobacteria toxins. In Alberta,
recreational guidelines for microcystin are set at 20 µg/L. Blue-green algae advisories are managed by
Alberta Health Services. Recreating in algal blooms, even if microcystin concentrations are not above
guidelines, is not recommended.

Composited microcystin levels in Pigeon Lake fell below the recreational guideline of 20 µg/L on each
sampling date (Table 1). Caution should still be observed when recreating in visible cyanobacteria blooms.

Table 1. Microcystin concentrations measured five times at Pigeon Lake in 2019.

                      Date                                 Microcystin Concentration (µg/L)
                   06-Jun-19                                             0.05
                    15-Jul-19                                            0.11
                   19-Aug-19                                             0.05
                   12-Sep-19                                             0.05
                    Average                                              0.07

INVASIVE SPECIES MONITORING
Dreissenid mussels pose a significant concern for Alberta because they impair the function of water
conveyance infrastructure and adversely impact the aquatic environment. These invasive mussels have
been linked to creating toxic cyanobacteria blooms, decreasing the amount of nutrients needed for fish and
other native species, and causing millions of dollars in annual costs for repair and maintenance of water-
operated infrastructure and facilities.

Monitoring involved using a 63 μm plankton net at three sample sites to look for juvenile mussel veligers in
each lake sampled. No mussels were detected at Pigeon Lake in the summer of 2019.

Eurasian watermilfoil is non-native aquatic plant that poses a threat to aquatic habitats in Alberta because
it grows in dense mats preventing light penetration through the water column, reduces oxygen levels when
the dense mats decompose, and outcompetes native aquatic plants.

Suspect samples collected from Pigeon Lake on August 10 were confirmed to be the native Northern
watermilfoil (Myriophyllum sibiricum).
WATER LEVELS
There are many factors influencing water quantity. Some of these factors include the size of the lake’s
drainage basin, precipitation, evaporation, water consumption, ground water influences, and the efficiency
of the outlet channel structure at removing water from the lake. Requests for water quantity monitoring
should go through Alberta Environment and Parks Monitoring and Science division.

Water levels in Pigeon Lake have remained relatively stable since Environment Canada began monitoring the
lake in 1972 (Figure 4). Since 1972, Pigeon Lake water levels fluctuated between a maximum of 850.6 m asl
and a minimum of 849.4 m asl. Data from Environment Canada was only available until 2015. A weir at the
mouth of the outlet was installed in 1983 by ESRD to maintain water levels at 849.935 meters above sea level
(m asl). In 2008, monitoring revealed that the weir had risen 0.15 m due to frost heaving. In 2013, the height
was adjusted by ESRD to bring the structure back to the intended level of 849.935 m asl.1

                       850.8

                       850.6

                       850.4

                       850.2
    Elevation (masl)

                       850.0

                       849.8

                       849.6

                       849.4

                       849.2
                               1971

                                      1974

                                             1977

                                                    1980

                                                           1983

                                                                  1986

                                                                         1989

                                                                                1992

                                                                                        1995

                                                                                               1998

                                                                                                      2001

                                                                                                             2004

                                                                                                                    2007

                                                                                                                           2010

                                                                                                                                  2013

                                                                                                                                         2016

                                                                                                                                                2019

                                                                                       Year
Figure 4. Water levels measured in meters above sea level (masl) from 1972-2019. Data retrieved from
Environment Canada (1972 – 2018), and Alberta Environment and Parks (2019).

1
 Teichreb, C., Peter, B. and Dyer, A. (2013). 2013 Overview of Pigeon lake Water Quality, Sediment Quality,
and Non-Fish Biota. 2 pp.
Table 2a. Average Secchi depth and water chemistry values for Pigeon Lake. Historical values are given for reference.
Parameter 1983 1984 1985 1986 1987 1988 1989 1990 1991 1992 1993 1994 1995
TP (μg/L) 27 35 23 29 29 43 29 26 34 38 36 29 32
TDP (μg/L) / / / / / / / / / / / / /
Chlorophyll-a (μg/L) 9.9 14.1 13.8 16.1 9.9 25.7 9.2 11.9 17.4 18.6 16.1 16.6 17.5
Secchi depth (m) 3.19 1.94 2.19 3.08 2.25 1.63 2.35 2.32 2.14 1.72 1.98 2.13 2.20
TKN (mg/L) 0.9 / / / / / / / / / / / 0.9
NO2-N and NO3-N (μg/L) / / / / / / / / / / / / /
NH3-N (μg/L) / / / / / / / / / / / / /
DOC (mg/L) / / / / / / / / / / / / /
Ca (mg/L) / / / / / / / / / / / / /
Mg (mg/L) / / / / / / / / / / / / /
Na (mg/L) 15 15 16 15 15 17 16 14 14 17 17 17 18
K (mg/L) / / / / / / / / / / / / /
SO42- (mg/L) / / / / / / / / / / / / /
-
Cl (mg/L) / / / / / / / / / / / / /
CO3 (mg/L) / / / / / / / / / / / / /
HCO3 (mg/L) 181 178 184 169 176 171 187 175 177 174 175 177 168
pH 8.37 8.43 8.35 8.57 8.50 8.36 8.32 8.50 8.46 8.45 8.56 8.60 8.61
Conductivity (μS/cm) 283 288 292 280 293 279 302 294 293 286 287 290 282
Hardness (mg/L) 112 103 113 110 111 109 120 122 121 111 113 114 111
TDS (mg/L) 157 154 158 151 157 151 163 158 156 152 154 155 156
Total Alkalinity (mg/L
152 153 153 147 154 145 156 153 150 146 148 150 149
CaCO3)
Microcystin (μg/L) / / / / / / / / / / / / /Table 2b. Average Secchi depth and water chemistry values for Pigeon Lake. Historical values are given for reference.
Parameter 1996 1997 1983 2003 2005 2006 2008 2010 2011 2013 2014
TP (μg/L) 38 30 35 63 27 60 26 41 75 27 46
TDP (μg/L) / / / / 6 38 9 13 19 8 16
Chlorophyll-a (μg/L) 18.5 12.8 15.0 36.9 9.2 21.9 8.0 21.9 66.2 12.3 19.2
Secchi depth (m) 1.80 2.50 1.50 1.38 1.90 2.70 4.42 2.75 1.25 3.23 2.31
TKN (mg/L) / / 0.6 1.1 0.7 1.1 0.7 1.0 1.5 0.8 0.7
NO2-N and NO3-N (μg/L) / / 1 / 3 29 13 8 16 6 26
NH3-N (μg/L) / / 3 / 3 124 16 72 109 28 25
DOC (mg/L) / / / / / 7 / 7 / / 8
Ca (mg/L) / / / / 29 21 27 24 20 28 23
Mg (mg/L) / / / / 13 14 13 14 13 13 11
Na (mg/L) 15 19 / 19 20 21 20 22 20 21 24
K (mg/L) / / / / 6 7 6 6 6 7 7
SO42- (mg/L) / / / / 7 10 5 9 3 6 5
Cl- (mg/L) / / / / 4 3 3 3 3 3 4
CO3 (mg/L) / / / / 8 5 3 1 9 3 6
HCO3 (mg/L) 163 190 / 169 183 180 198 195 161 195 192
pH 8.66 8.17 / 8.56 8.60 8.50 8.37 8.57 8.74 8.34 8.59
Conductivity (μS/cm) 293 304 / / 313 287 322 310 287 320 314
Hardness (mg/L) 106 130 / 103 125 119 121 116 100.2 122 104
TDS (mg/L) 151 169 / / 177 173 175 174 153 176 182
Total Alkalinity (mg/L
149 156 / 151 163 155 166 160 147 164 157
CaCO3)
Microcystin (μg/L) / / / / / / / 0.09 0.17 0.14 0.97Table 2c. Average Secchi depth and water chemistry values for Pigeon Lake. Historical values are given for
reference.
Parameter 2015 2016 2017 2018 2019
TP (μg/L) 61 26 47 33 22
TDP (μg/L) 11 6 4 5 6
Chlorophyll-a (μg/L) 41 28 58 39 15
Secchi depth (m) 1.65 3.36 1.85 2.29 2.94
TKN (mg/L) 1.3 0.9 1.3 1.0 0.8
NO2-N and NO3-N (μg/L) 3 3 2 9 6
NH3-N (μg/L) 31 25 21 16 11
DOC (mg/L) 8 7 8 8 8
Ca (mg/L) 20 26 25 25 27
Mg (mg/L) 13 14 15 14 14
Na (mg/L) 21 24 24 24 24
K (mg/L) 6 7 7 7 7
SO42- (mg/L) 5 6 5 7 7
Cl- (mg/L) 4 4 5 5 5
CO3 (mg/L) 4 6 8 7 4
HCO3 (mg/L) 178 184 178 188 195
pH 8.48 8.60 8.63 8.56 8.51
Conductivity (μS/cm) 298 320 316 328 333
Hardness (mg/L) 101 124 120 124 125
TDS (mg/L) 166 190 182 196 195
Total Alkalinity (mg/L
154 160 160 164 168
CaCO3)
Microcystin (μg/L) 2.32 0.13 0.47 0.58 0.07Table 3. Concentrations of metals were last measured in Pigeon Lake in August 2017. The CCME heavy
metal Guidelines for the Protection of Freshwater Aquatic Life (unless otherwise indicated) are presented
for reference.
Metals (Total Recoverable) 2003 2012 2014 2015 2016 2017 Guidelines
Aluminum μg/L 14.9 5.13 10.55 14.3 7.2 5.1 100a
Antimony μg/L 0.05 0.06685 0.089 0.0785 0.066 0.064 /
Arsenic μg/L 1.67 1.375 2.285 2.145 2.06 1.87 5
Barium μg/L 78.5 89.75 77.35 74.1 73.5 78.1 /
Beryllium μg/L 0.02 0.00675 0.004 0.004 0.004 0.0015 100c,d
Bismuth μg/L 0.0025 0.00125 0.0005 0.00325 0.001 0.0015 /
Boron μg/L 27.9 29.85 27.4 28.5 31.1 27.3 1500
Cadmium μg/L 0.01 0.00325 0.002 0.004 0.005 0.005 0.26b
Chromium μg/L 0.27 0.015 0.5235 0.09 0.04 0.05 /
Cobalt μg/L 0.11 0.00605 0.006565 0.018 0.005 0.021 1000d
Copper μg/L 1.08 0.2255 0.4155 0.235 0.5 0.22 4b
Iron μg/L 39 2.04 15.75 144.2 20.6 14.3 300
Lead μg/L 0.145 0.0167 0.245 0.0595 0.028 0.032 7b
Lithium μg/L 8.6 9.09 8.29 9.175 11.2 9.47 2500e
Manganese μg/L 54.1 16.9 15.75 49.65 6.48 27.5 200e
Molybdenum μg/L 0.62 0.704 0.731 0.728 0.907 0.711 73c
Nickel μg/L 0.16 0.0025 0.3465 0.0205 0.219 0.88 150b
Selenium μg/L 0.25 0.103 0.35 0.03 0.21 0.1 1
Silver μg/L 0.0025 0.0015 0.00681 0.002 0.003 0.0005 0.25
Strontium μg/L 245 234 261 233 249 231 /
Thallium μg/L 0.0015 0.00105 0.00291 0.000875 0.0075 0.003 0.8
Thorium μg/L 0.0015 0.008725 0.003575 0.011425 0.01 0.005 /
Tin μg/L 0.05 0.0549 0.0231 0.0355 0.027 0.03 /
Titanium μg/L 1.5 0.8925 1.4355 3.125 1 1.37 /
Uranium μg/L 0.086 0.1805 0.1945 0.167 0.161 0.144 15
Vanadium μg/L 0.26 0.1545 0.456 0.14 0.26 0.189 100d,e
Zinc μg/L 1.5 0.899 1.56 0.65 0.9 0.3 30
Values represent means of total recoverable metal concentrations.
a
Based on pH ≥ 6.5
b
Based on water hardness > 180mg/L (as CaCO3 )
c
CCME interim value.
d
Based on CCME Guidelines for Agricultural use (Livestock Watering).
e
Based on CCME Guidelines for Agricultural Use (Irrigation).
A forward slash (/) indicates an absence of data or guidelines.LONG TERM TRENDS
Trend analysis was conducted on the parameters total phosphorus (TP), chlorophyll-a, total dissolved solids
(TDS) and Secchi depth to look for changes over time in Pigeon Lake. In sum, non-significant increases were
observed in TP and secchi depth, and significant increasing trends were observed in chlorophyll-a and TDS.
Secchi depth can be subjective and is sensitive to variation in weather - trend analysis must be interpreted
with caution. Data is presented below as both a line graph (all data points) or a box-and-whisker plot.
Detailed methods are available in the ALMS Guide to Trend Analysis on Alberta Lakes.
Table 4. Summary table of trend analysis on Pigeon Lake data from 2003 to 2019.
Parameter Date Range Trend Probability
Total Phosphorus 1983-2019 Increasing Not significant
Chlorophyll-a 1983-2019 Increasing Significant
Total Dissolved Solids 1983-2019 Increasing Significant
Secchi Depth 1983-2019 Increasing Not significant
Definitions:
Median: the value in a range of ordered numbers that falls in the middle.
Trend: a general direction in which something is changing.
Monotonic trend: a gradual change in a single direction.
Statistically significant: The likelihood that a relationship between variables is caused by something other
than random chance. This is indicated by a p-value ofTotal Phosphorus (TP) Trend analysis of TP over time showed that it has not significantly changed in Pigeon Lake since 1982 (Tau = 2.75 x 10⁻², p = 0.70). Recent recent years show greater variation in total phosphorous levels than have been seen historically. Figure 5. Monthly total phosphorus (TP) concentrations measured between June and September over the long term sampling dates between 1983 and 2019 (n = 94). The value closest to the 15th day of the month was chosen to represent the monthly value in cases with multiple monthly samples.
Chlorophyll-a

Chlorophyll-a has increased significantly over time at Pigeon Lake (Tau = 0.17, p < 0.01). The rate of change
is very low, with the slope of the trend suggesting an increase of around 3.29 µg/decade over the 35 years
sampled. Chlorophyll-a trends follow TP trends with correlation over time (r = 0.67, p =
Total Dissolved Solids (TDS)
Trend analysis showed a significantly increasing trend in TDS since 1983 in Pigeon Lake (Tau = 0.57, p =
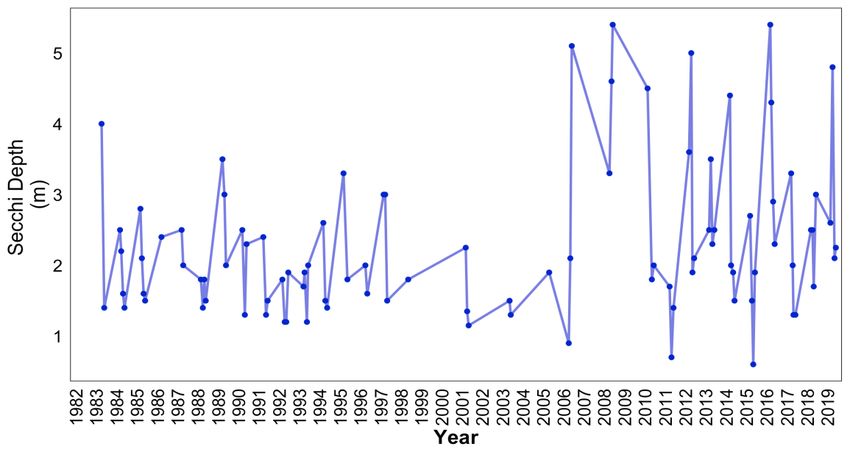
Secchi Depth
Secchi depth has not changed significantly in Pigeon Lake since 1983 (Tau = 0.16, p = 0.01). Recent years
show much greater variation both within and between seasons.

Figure 8. Monthly Secchi depth values measured between June and September over the long term sampling
dates between 1983 and 2019 (n = 95). The value closest to the 15th day of the month was chosen to
represent the monthly value in cases with multiple monthly samples.
Table 5. Results of trend tests using total phosphorus (TP), chlorophyll-a, total dissolved solids (TDS) and
Secchi depth data from June to September on Pigeon Lake data.

                                           Total                                   Total
  Definition             Unit           Phosphorus         Chlorophyll-a        Dissolved         Secchi Depth
                                           (TP)                                Solids (TDS)
  Statistical                                                                    Seasonal           Seasonal
                           -           Mann Kendall        Mann Kendall
   Method                                                                         Kendall            Kendall
 The strength
 and direction
 (+ or -) of the         Tau             2.75 x 10⁻²            0.17               0.57                0.13
trend between
    -1 and 1
The extent of
                        Slope            9.46 x 10⁻⁵          0.0008            2.86 x 10⁻³        3.48 x 10⁻⁵
  the trend
 The statistic
 used to find
                           Z                0.389               2.59               7.11                1.81
significance of
   the trend
  Number of
    samples                n                 94                 109                 73                  95
    included
       The
significance of            p                0.70
You can also read