Isles of Scilly Source Protection Zone Delineation - Project ENVRESW001361 December 2016 - Gov.uk
←
→
Page content transcription
If your browser does not render page correctly, please read the page content below
This publication was withdrawn 24 November 2020

                                                      20
                                                    20
                                                   ov
                                               N
                                   24
                  n
                aw

     Isles of Scilly Source Protection Zone
     Delineation
        dr
 ith

     Project ENVRESW001361
     December 2016
W
We are the Environment Agency. We protect and improve the environment.
  Acting to reduce the impacts of a changing climate on people and wildlife is at
  the heart of everything we do.
  We reduce the risks to people, properties and businesses from flooding and
  coastal erosion.
  We protect and improve the quality of water, making sure there is enough for

                                                                       20
  people, businesses, agriculture and the environment. Our work helps to
  ensure people can enjoy the water environment through angling and
  navigation.

                                                                     20
  We look after land quality, promote sustainable land management and help
  protect and enhance wildlife habitats. And we work closely with businesses to
  help them comply with environmental regulations.
  We can’t do this alone. We work with government, local councils, businesses,

                                                      ov
  civil society groups and communities to make our environment a better place
  for people and wildlife.

                                               N
                                   24
                n
              aw

  Published by:
  Environment Agency                           Further copies of this report are available
     dr

  Horizon House, Deanery Road,                 from our publications catalogue:
  Bristol BS1 5AH                              www.gov.uk/government/publications
  Email: enquiries@environment-agency.gov.uk
                                               or our National Customer Contact Centre:
 ith

  www.gov.uk/environment-agency
                                               T: 03708 506506
                                               Email: enquiries@environment-agency.gov.uk.
  © Environment Agency 2014
W

  All rights reserved. This document may be
  reproduced with prior permission of the
  Environment Agency.

                                                                                             2 of 32
Executive summary
  The Environment Agency delineates Source Protection Zones (SPZs) to protect groundwater in the
  catchments of potable groundwater abstractions from pollution by potentially contaminative
  activities. SPZ 1 represents the 50 day groundwater travel time to a source (or is a ‘default’ 50 m
  radius), SPZ 2 represents the 400 day travel time (or is a default 250 m radius), and SPZ 3
  represents the total catchment to the source.

                                                                           20
  Prior to 2010, the Isles of Scilly were exempt from UK environmental legislation. This situation was
  ended in 2010, with the introduction of the Environmental Permitting Regulations (EPR). Due to
  the extension of EPR to the islands, the Environment Agency has produced SPZs there.
  The Isles of Scilly are formed of fractured granite, with overlying blown sand and alluvium in some

                                                                         20
  areas. The surface of the granite has been very highly weathered. Groundwater flow through the
  fractured granite is very rapid.
  The Isles of Scilly are dependent upon groundwater for water supply. Source Protection Zones
  have been delineated for the groundwater abstractions operated by the Council of the Isles of
  Scilly, the Duchy of Cornwall and Tresco Estate. These sources supply a large proportion of the

                                                           ov
  population.
  The zones were delineated using available information about the sources, the geology,
  hydrogeology and topography of the islands, groundwater velocity estimates, and a simple model.
  Due to the rapid groundwater flow, separate SPZ3s were not drawn: SPZ 2 was taken to extend to
  entire catchments.
                                                   N
  The zones are shown in the Figures section of this report.
                                     24
                n
              aw
     dr
 ith
W

                                                                                               3 of 32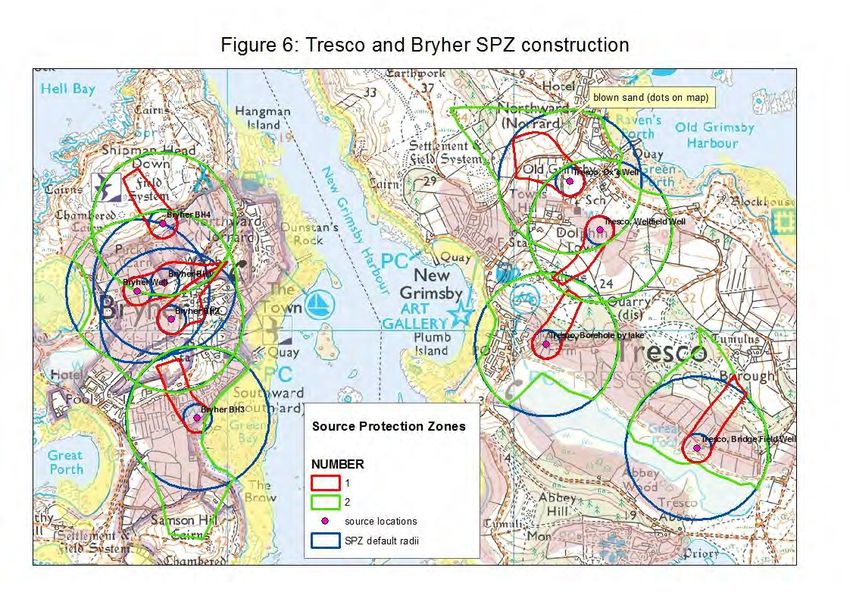
Contents
  1. Background ............................................................................................................................... 5
  2. Description of sources ............................................................................................................. 5
  3. Geological and hydrogeological conceptual understanding ................................................. 8
     3.1. General ................................................................................................................................ 8

                                                                                                             20
     3.2. St Mary's .............................................................................................................................. 9
     3.3. St Martin's .......................................................................................................................... 10
     3.4. Bryher................................................................................................................................. 10

                                                                                                           20
     3.5. Tresco ................................................................................................................................ 10
     3.6. St Agnes ............................................................................................................................. 11
  4. Delineation of Source Protection Zones ............................................................................... 11
     4.1. General .............................................................................................................................. 11

                                                                                      ov
     4.2. St Mary's ............................................................................................................................ 11
     4.3. St Martin's .......................................................................................................................... 12
     4.4. Tresco ................................................................................................................................ 13

                                                                           N
     4.5. Bryher................................................................................................................................. 13
     4.6. St Agnes ............................................................................................................................. 13
  5. Confidence in Source Protection Zone boundaries, and potential for further work .......... 13
                                                     24
  6. Figures ..................................................................................................................................... 14
  7. References .............................................................................................................................. 23
  8. Appendices ............................................................................................................................. 24
                      n
                    aw
      dr
 ith
W

                                                                                                                                          4 of 32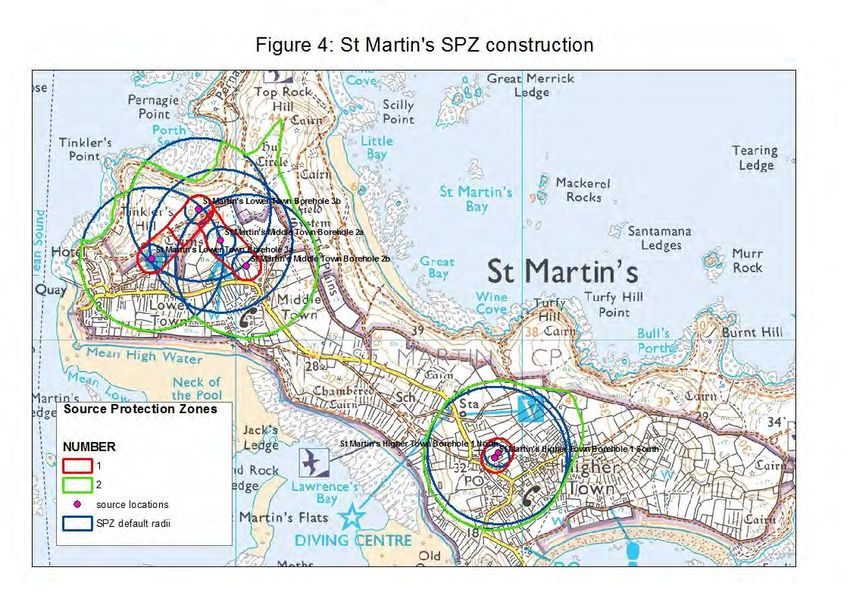
1. Background
  The Isles of Scilly comprise 5 inhabited islands, and a large number of uninhabited islands. St
  Mary’s is the main inhabited island. The other inhabited islands are St Martin’s, St Agnes, Tresco
  and Bryher.
  The Isles of Scilly are dependent upon groundwater for water supply. There are few surface water
  courses on the islands, and these are not abstracted from. The Council of the Isles of Scilly

                                                                           20
  provides a water supply on St Mary’s, which comes from groundwater and a desalination plant.
  The Council also supplies Bryher, from groundwater abstraction. The Duchy of Cornwall operates
  some groundwater abstractions on St Martin’s and St Agnes. On Tresco, all water supply is
  provided from groundwater by Tresco Estate. A great number of private abstractions also exist
  across the islands, supplying individual households or groups of households.

                                                                         20
  Prior to 2010, the Isles of Scilly were exempt from UK environmental legislation. This situation was
  ended in 2010, with the introduction of the Environmental Permitting Regulations. The
  Environment Agency uses Source Protection Zones (SPZs) in its risk assessment of permit
  applications and in response to pollution incidents. With the introduction of permitting to the
  islands, SPZs are needed.

                                                            ov
  SPZ 1 represents the 50 day groundwater travel time to a source (or is a 50 m default radius), and
  SPZ 2 represents the 400 day groundwater travel time (or is a default 250 m radius). SPZ 3
  represents the total groundwater catchment draining towards a source.

                                                    N
  This report describes the delineation of SPZs for the groundwater sources operated by the Council
  of the Isles of Scilly, the Duchy of Cornwall and Tresco Estate. These sources were chosen for
  this initial SPZ delineation as they supply the largest number of people.

  2. Description of sources
                                     24

  The Council of the Isles of Scilly operates the following sources:
  Table 1
                 n

            Source         NGR                information
            name
               aw

            St Mary’s      SV 92297 10973 Well
            Carss
                                              Located in Higher Moors
                                              Average daily abstraction rate 2012 – 2015: 21
                                              m3/d
     dr

                                              Average water level 2010 – 2015: 1.3 mbgl
            St Mary’s      SV 92139 11040 Borehole
 ith

            Hales
                                              Located in Higher Moors
                                              Average daily abstraction rate 2012 – 2015:
                                              115.9 m3/d
W

                                              Average water level 2010 – 2015: 4.1 mbgl
            St Mary’s      SV 92200 11099 Well
            Venns
                                              Located in Higher Moors
                                              Average daily abstraction rate 2012 – 2015:
                                              105.8 m3/d
                                              Average water level 2010 – 2015: 3.1 mbgl

                                                                                               5 of 32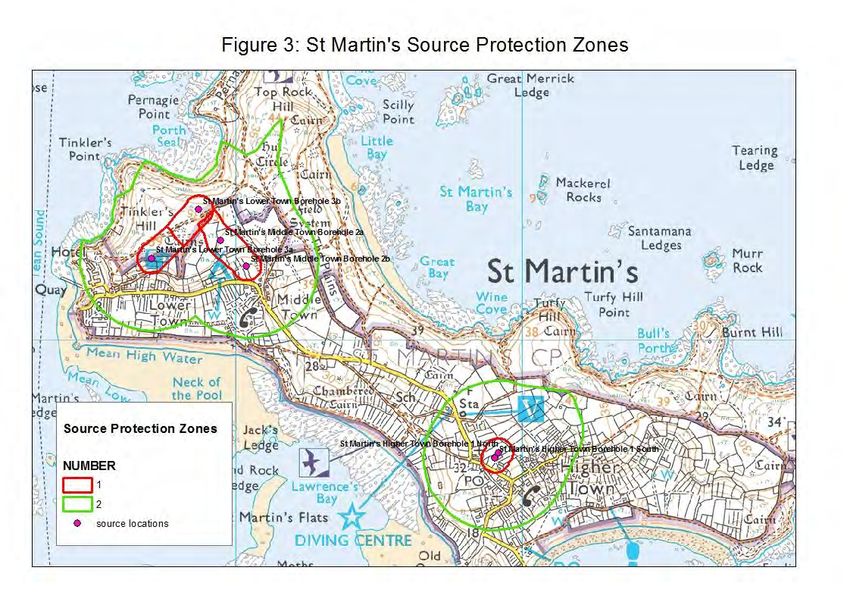
St Mary’s     SV 91353 10736 Well
  Joaneys
                                Located in Lower Moors
                                Average daily abstraction rate 2012 – 2015: 58.6
                                m3/d
                                Average water level 2010 – 2015: 1.8 mbgl
                                Borehole depth: 5.49 m
  St Mary’s     SV 91107 11077 Borehole

                                                             20
  Rocky Hill
                                Located in Lower Moors.
                                Average daily abstraction rate 2012 – 2015: 84.3
                                m3/d

                                                           20
                                Average water level 2010 – 2015: 3mbgl
                                Borehole depth: 10.36 m
  Bryher Well   SV 87685 15138 Constructed 1980
                                Well depth:6 m

                                             ov
                                Water level 02/12/15: 3 mbgl
                                Average daily abstraction rate 2011 – 2015: 14.5
                                m3/d
  Bryher BH2                          N
                SV 87803 15038 Constructed 2011
                                Borehole depth: 32 m
                                Water level 02/12/15: 8.3 mbgl
                        24
                                Average daily abstraction rate 2011 – 2015: 4.5
                                m3/d
  Bryher BH4    SV 87773 15373 Constructed 2011
                                Borehole depth: 40 m
       n

                                Water level 02/12/15: 9.3 mbgl
     aw

                                Average daily abstraction rate 2011 – 2015: 0.7
                                m3/d
  Bryher BH1    SV 87779 15167 Constructed 1992
                                Borehole depth: 32 m
  dr

                                Water level 02/12/15: 11.5 mbgl
                                Average daily abstraction rate 2011 – 2015: 9.5
                                m3/d
 ith

  Bryher BH3    SV 87894 14694 Only used in summer months when demand at
                               its peak
                                Average daily abstraction rate 2011 – 2015: 4.2
W

                                m3/d

                                                                                   6 of 32
The Duchy of Cornwall operates the following sources:
  Table 2
            Source name             NGR                   information
            St Martin’s Higher      SV 92919 15608 Combined Higher Town boreholes
            Town Borehole 1 North                  average daily abstraction rate 2008 –
                                                   2015: 1.5 m3/d.
            St Martin’s Higher    SV 92907 15588 Combined Higher Town boreholes

                                                                           20
            Town Borehole 1 South                average daily abstraction rate 2008 –
                                                 2015: 1.5 m3/d.
                                                          Borehole depth approximately 40m
                                                          Water level 11/11/15: 10.7 mbgl

                                                                         20
            St Martin’s Lower Town SV 91706 16284 Combined Lower Town boreholes
            Borehole 3a                           average daily abstraction rate 2008 –
                                                  2015: 1.3 m3/d.
            St Martin’s Lower Town SV 91872 16456 Combined Lower Town boreholes

                                                           ov
            Borehole 3b                           average daily abstraction rate 2008 –
                                                  2015: 1.3 m3/d.
            St Martin’s Middle      SV 91948 16347 Combined Middle Town boreholes
            Town Borehole 2a                       average daily abstraction rate 2008 –

            St Martin’s Middle
            Town Borehole 2b
                                                 N 2015: 7.9 m3/d.
                                    SV 92038 16259 Combined Middle Town boreholes
                                                   average daily abstraction rate 2008 –
                                                   2015: 7.9 m3/d.
                                    24
            St Agnes Coveon        SV 88305 08169 Data supplied by the Duchy for 2013
            Borehole (Higher Town)                – 2016 shows average daily
            29                                    abstraction rates for the 4 St Agnes
                                                  boreholes combined of 6.3 m3/d.
                 n

            St Agnes Johans Field   SV 87916 08233 Data supplied by the Duchy for 2013
            Borehole 33                            – 2016 shows average daily
               aw

                                                   abstraction rates for the 4 St Agnes
                                                   boreholes combined of 6.3 m3/d.
            St Agnes Plump          SV 88259 08243 Supplies half of St Agnes
            Borehole 28 (Higher
                                                          Borehole depth 29.6 m
            Town)
     dr

                                                          Water level 11.9 mbgl
                                                          Data supplied by the Duchy for 2013
                                                          – 2016 shows average daily
 ith

                                                          abstraction rates for the 4 St Agnes
                                                          boreholes combined of 6.3 m3/d.
            St Agnes Tommys Barn SV 88075 08141 Data supplied by the Duchy for 2013
            Borehole 31                         – 2016 shows average daily
W

                                                abstraction rates for the 4 St Agnes
                                                boreholes combined of 6.3 m3/d.

                                                                                                 7 of 32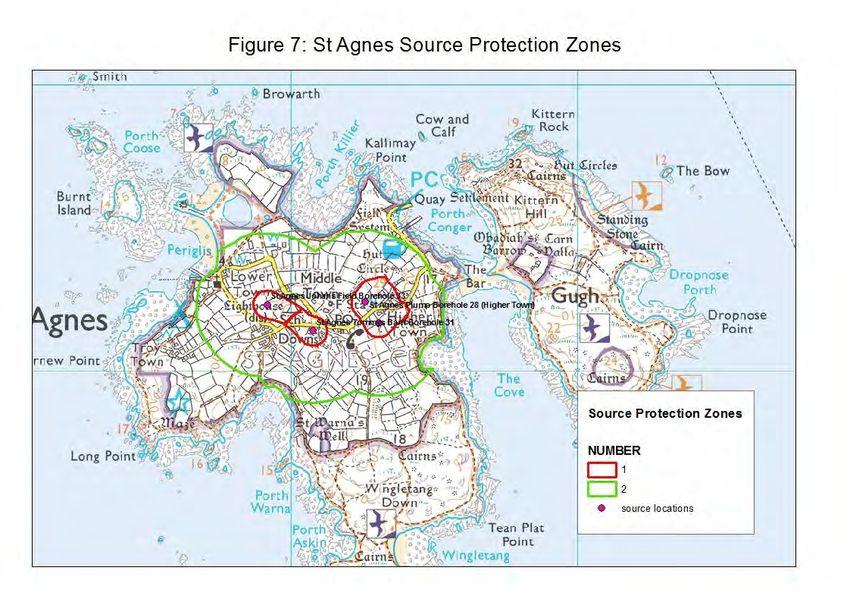
Tresco Estate operates the following sources
  Table 3
            Source         NGR                information
            name
            Borehole by    SV 89113 14952 This source is only used in summer, and yields
            Lake                          around 30 m3/d.
                                              Well depth: 25.4 m

                                                                             20
                                              Water level 23/11/15: 4.65 mbgl
            Ox’s Well      SV 89195 15521 Water level ranges seasonally between around
                                          0.5 and 3.8 mbgl.

                                                                           20
                                              Well depth: 5.84 m
                                              Water level 23/11/15: 2.7 mbgl
            Bridge Field   SV 89639 14590 Very wide diameter well. Tresco Estate
            Well                          excavated it 20 years ago. Concrete ring
                                          construction.

                                                             ov
                                              Water level ranges seasonally between around
                                              1.5 mbgl and 3.8 mbgl.
                                              Well depth: 4.9 m

            Wellfield
            Well
                                                     N
                                              Water level 23/11/15: 3.1 mbgl
                           SV 89300 15350 Well was constructed by the Navy in World War
                                          One. In summer, water level reaches pump cut
                                      24
                                          out.
                                              Water level ranges seasonally between around
                                              2.5 mbgl and 6 mbgl.
                                              Well depth 6.6 m
                  n

                                              Water level 23/11/15: 4.6 mbgl
                aw

  Information provided by Tresco Estate shows an average daily water usage for the island of 81
  m3/d in 2013 - 2014.

  3. Geological and hydrogeological
     dr

  conceptual understanding
 ith

  3.1. General
  The Isles of Scilly are located 45km to the west of Land’s End. These granite islands are part of
  the Cornubian batholith (a line of igneous intrusions), which begins at Dartmoor in Devon, and
  extends through Cornwall.
W

  Barrow (1906) states that, ‘the material formed by the denudation of the granite is an important
  component of some of the islands. This granite waste takes two forms, angular head and blown
  sand. The latter is by far the more important so far as bulk is concerned’.
  Barrow states further that, ‘considering the small size of the area above water, the amount of
  blown sand in the Scilly Isles is remarkable’, and that, ‘the blown sand has had the effect of joining
  different granite patches or small islands together so as to form a continuous land-surface or one
  island’.

                                                                                                 8 of 32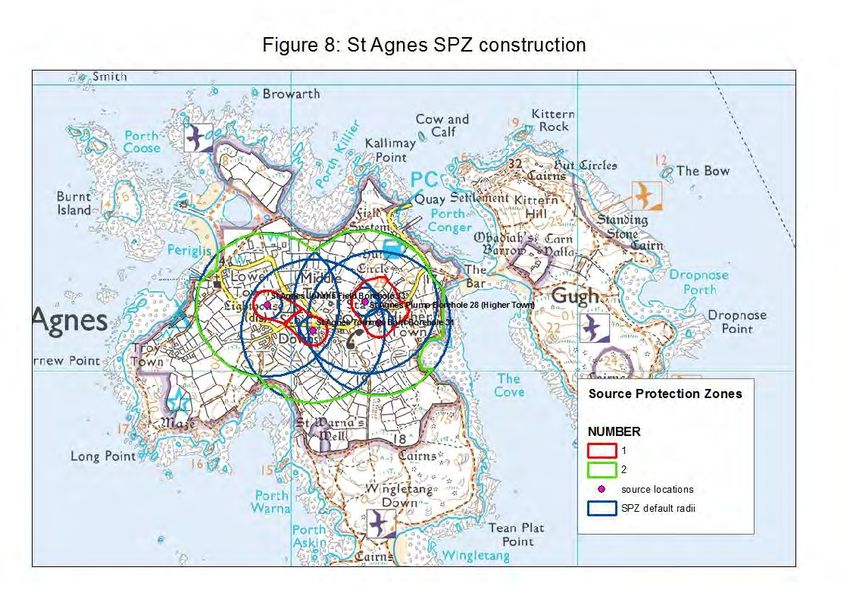
Watkins (1999) expands on the hydrogeological aspects of, this stating that, ‘the upper surface of
  the granite has been very highly weathered, by glacial processes, into a permeable sandy material
  or head, known locally as Ram’. Over some lower-lying parts of the islands, the granite head is
  overlain by blown sand, which is also very highly permeable.
  The islands are characterised by a general absence of streams (except within the Higher and
  Lower Moors SSSIs). This indicates that there is minimal runoff and that residual rainfall (after
  evapotranspiration) infiltrates the drift or bedrock (ESI, 2012). The high bedrock permeability is
  due to the highly fractured nature of the granite. Groundwater flow through the fractures is likely to
  be rapid. Fracturing is most highly developed in the upper parts of the granite. The majority of

                                                                             20
  groundwater flow is therefore fairly shallow. Groundwater flow paths are likely to be short and to
  follow the topography, from the higher land towards the centre of the islands towards the sea,
  where discharge occurs.
  It must be noted that, in contrast to the understanding presented above, South West Water (1982),

                                                                           20
  states that, ‘pumping tests have shown that the area of influence of each borehole source rarely
  exceeds 40 m radial distance because the permeability of the granite is very low’. This relates to
  private sources, however.

  3.2. St Mary's

                                                             ov
  The Council of the Isles of Scilly abstraction boreholes are located in the Higher Moors and Lower
  Moors areas of St Mary’s.
  According to ESI (2012), the alluvial aquifers of the Lower and Higher Moors form the major
  groundwater catchments on St Mary’s. In the Higher Moors, the drift infills a valley running from
                                                     N
  Holy Vale to Porth Hellick, and in the Lower Moors, drift covers the area bounded by Old Town
  Beach in the south and Porth Mellon in the west, with a tongue stretching to Porthloo. The drift
  infilling the granite hollows is made up of lower granitic ‘head’, locally known as ram, and the
  weathered granite layer, also known as re-worked ram, underlying a confining layer of alluvium. In
                                      24
  the Higher Moors, sandy units of the drift deposits are considered to act as ‘drainage blankets’,
  collecting water from the underlying granite and discharging it seawards.
  A diagram reproduced in ESI’s report indicates groundwater flowing through the granite of the
  Higher Moors, from the higher land to the north towards the sea. Groundwater is also indicated
  flowing through outwash gravels between the alluvium and granite. Groundwater is shown flowing
                 n

  beneath the drift infill, and then through it at the saline interface. The diagram is shown below:
               aw
     dr
 ith
W

  An excerpt from South West Water, 1982, relating to the Moors, is shown below:

                                                                                                 9 of 32
20
                                                                           20
                                                             ov
                                                     N
  Joaney’s Well geological log (Appendix 4) shows that this source is 5.49 m deep and that only the
  final 15 cm is ‘hard fissured granite’. ‘Fine china clay and gravel’ forms the largest thickness (2.44
  m). ‘Coarse gravel’ and ‘mixed coarse gravel and decomposed granite’ together form 1.83 m of
                                      24
  the borehole. Information included with the geological log shows a yield of up to 90 m3/d ‘during
  sinking operations’. It states that ‘immediately pumping ceased, the well commenced to fill and
  rose to a point [0.3 m] below normal rest level in one hour’. The pumped water level was 2.74
  mbgl. ‘steady pumping [up to 163 m3/d] failed to lower the water table below [2.74 mbgl]’. The
  information states that the borehole is supplied by granite fissures at depth [-3 mbgl]. Taken
  together, this information indicates that the well is supplied by very permeable strata, and that
                 n

  groundwater flow rates will be rapid.
               aw

  Rocky Hill’s geological log (Appendix 4) shows subsoil and sand from the surface to 3.81 mbgl,
  and decomposed granite below that, to the base of the borehole, at 10.36 mbgl.

  3.3. St Martin's
  ESI (2012) states that hydrogeologically St Martin’s can be described in terms of two main
     dr

  aquifers, the granite and the blown sand, generally comprising the higher and lower lying ground
  respectively. Typical permeability is 0.04 m/d in the granite, and 4 m/d in the blown sand. Steep
  hydraulic gradients within the granite and shallow gradients in the blown sand suggest that the
  sand (and possibly the ram) may act as a subsurface drain. Regular dipping by Camborne School
 ith

  of Mines showed rest water levels in some wells fluctuating by up to 10 m between summer and
  winter.

  3.4. Bryher
W

  ESI (2012) state that no information has been seen on aquifer characteristics for Bryher, but that it
  is likely that these are very similar to the other islands.

  3.5. Tresco
  Barrow (1906) states that blown sand is exceptionally abundant on the island of Tresco, and that
  within the main sand bar on the southern part of the island is ‘a depressed area containing a large

                                                                                                10 of 32
fresh-water lake, the surface of which is distinctly below high-water mark, yet the sea water does
not seem to filter through’.
Aquatic Water Services, 2005, states that the wells on Tresco are relatively shallow and that the
blown sand is the main aquifer. Aquatic Water Services carried out pumping tests in 2004 and
2005 and state that the hydraulic conductivities calculated for Ox’s Well, Wellfield Well and Bridge
Field Well are moderate to high, which is representative of blown sand deposits. The report shows
hydraulic conductivities ranging between 7 m/d and 13 m/d.
3.6. St Agnes
20
ESI (2012) report that hydrogeological conditions on St Agnes are very similar to on St Martin’s.
They state, however, that some studies have commented that the granite of St Agnes seems to be
less permeable than that of St Martin’s. ESI report a seasonal fluctuation of groundwater levels of
2 – 3 m.
20
4. Delineation of Source Protection
Zones
ov
4.1. General
SPZ 1 represents the 50 day groundwater travel time to a source, and SPZ 2 the 400 day
source. N
groundwater travel time. SPZ 3 represents the total groundwater catchment draining towards a
All potable groundwater sources in England automatically have ‘default’ 50 m radius SPZ 1s and
250 m radius SPZ 2s. For most larger sources, ‘bespoke’ SPZs have been produced, using more
24
detailed information. As a starting point for the Isles of Scilly delineation, circles of 50 m and 250
m radii were produced about the abstraction points. They were then modified, using information
on the geological, hydrogeological and topographical setting. Groundwater velocities were
estimated using available aquifer parameters. For the larger sources, on St Mary’s, the US
Environmental Protection Agency’s ‘WhAEM’ (Wellhead Analytical Element Model) model ‘simple
WHPA’ (Well Head Protection Area) option was used to give some additional estimates of zone
n
size. This model is one of the standard methods used by the Environment Agency in SPZ
delineation. Its use in the Isles of Scilly SPZ work is described in Appendix 1.
aw
Due to assumed fast groundwater flow travel times (as described earlier for the islands’ fissured
granite, decomposed granite, gravel, alluvium and blown sand), separate SPZ 3s were not
produced. The 400 day travel time zone (SPZ 2) is set equal to the total catchment zone (SPZ 3).
This report describes the delineation of SPZs for the larger groundwater abstractions on the
dr
islands, which can be seen as equivalent to public water supplies. Although SPZs for smaller,
private supplies have not been drawn in this exercise, all potable abstractions do automatically
have the default 50 m radius SPZ 1 and 250 m radius SPZ 2s.
ith
The SPZs for each island are shown in Figures 1, 3, 5 and 7. Their construction is shown in
Figures 2, 4, 6 and 8.
4.2. St Mary's
W
See Figures 1 and 2. The sources on St Mary’s fall into a Higher Moors group and a lower Moors
Group.
For the Higher Moors group (Carss, Hales and Venns), a combined SPZ 1 was produced for all 3
sources, and a combined SPZ 2 was produced for all 3 sources. For the Lower Moors group
(Joaneys and Rocky Hill), individual zones were produced.
11 of 32The SPZ 2s of the 2 groups adjoin each other. These were drawn following the topography (on the
assumption that the groundwater table is a subdued version of the topography, and groundwater
divides roughly follow topographic ridges), and taking the default 250 m SPZ 2 buffer as a starting
point. The SPZ 2s extend to the topographic high point approximately 800 m to the north of the
sources. The boundary extends through Mount Todden and Pelistry, between Maypole and
Borough, and south of Porthloo. The SPZ 2s of the two groups are divided by the topographic
ridge running from Rocky Hill to Maypole. The SPZ 2 area is very similar to the Source Protection
Zone catchment area proposed by ESI in their 2012 study. ESI’s proposed zones are reproduced
in Figure 9.
20
It is assumed that the alluvium-infilled valley running from Holy Vale to Porth Hellick, in which the
Higher Moors group of abstractions are located, forms a preferential flow path for groundwater
flowing through the granite and very permeable alluvium and gravels, and discharging to the sea.
To produce the SPZ 1s, aquifer properties reported from investigations on the sources were taken
20
from ESI’s 2012 study, input into a calculation to estimate groundwater flow velocity and distance
travelled over 50 days, and also input into the WhAEM model. The output from WhAEM is shown
in Figure 2. The values input into WhAEM are shown in Appendix 2. The length of the 50 day
travel time zone obtained from the velocity calculation was 158 m. The calculation and results are
shown in Appendix 3.
ov
The combined SPZ 1 for the Higher Moors group was produced by drawing a polygon to
encompass the 50 m radius default circles and WhAEM zones for each source. The lengths of the
zones produced by WhAEM were around 50 m longer than those produced by the velocity
calculation. SPZ 1 was then extended up-gradient around the boundary of the alluvium as the
available information indicates that groundwater flow in the alluvium and underlying gravel is rapid.
N
Separate SPZ 2s were produced for Joaneys Well and Rocky Hill. The dividing line is a
topographic ridge.
Joaneys Well SPZ 1 was produced by extending the 50 m radius circle up the valley above the
24
source to the distance suggested by the WhAEM model output. The bedrock in valleys is
generally more fractured and transmissive than on interfluves, and groundwater converges
towards valleys. They therefore form preferential groundwater flow paths. The WhAEM model
output is a long, thin zone, due to the high hydraulic conductivity and hydraulic gradient and low
porosity values input into it.
n
For Rocky Hill, the SPZ 1 was drawn by extending the default 50 m radius SPZ 1 circle up to the
SPZ 2 catchment divide. The WhAEM output suggested a longer distance than this, but there is
aw
insufficient additional evidence for extension of the zone beyond the topographic divide. Note that
the groundwater flow direction is a specified, single input parameter to the model. The output will
therefore be a straight line, and will not bend with the curve of e.g. a valley.
4.3. St Martin's
dr
See Figures 3 and 4. The 6 Duchy of Cornwall sources on St Martin’s are located on or close to
the top of the ridge which runs the length of the island. Assuming that the groundwater
catchments are roughly equivalent to the topographic catchments, this means that the up-gradient
ith
catchment areas will be small.
The 2 Higher Town boreholes are close together (approximately 23 m apart). They are located on
the top of a fairly flat area of the topographic ridge, and their average abstraction rates (1.5 m3/d
combined 2008 – 2015) are low. Their catchments are likely to be small. SPZ 1 was delineated by
W
merging the 50 m radius circles about each borehole. SPZ 2 was delineated by merging the 250
m radius circles about each borehole, and adding a small area of higher ground to the north of the
sources.
A combined SPZ 2 was produced for the Lower Town and Middle Town boreholes. The 50 m
radius circles were extended the short distances to the topographic divide in the up-gradient
direction. One of the Middle Town boreholes is directly up-gradient of the other, and the SPZ 1s
for these 2 sources were combined.
12 of 324.4. Tresco
The 250 m default SPZ 2 radii extended to close to the topographic divides up-gradient of the
sources. Where the circles did not reach a divide, the SPZ was extended to it.
Results from the groundwater velocity equation were used to assist in drawing SPZ 1s. The same
parameters were used as were used for the St Mary’s sources, except that a hydraulic conductivity
of 0.47, reported by ESI, 2012 for St Martin’s was taken, and hydraulic gradients were estimated
for the area close to each source. The results showed 50 day travel time distances beyond the
topographic divides for all sources but Ox’s Well. SPZ 1 was drawn to the topographic divides for
20
all sources but Ox’s Well.
Ox’s Well is located in an area of mapped blown sand. The permeability of the blown sand is
reported to be high. SPZ 1 was drawn by extending the 50 m radius default circle in the up-
gradient direction as far as the edge of the outcrop of the mapped blown sand.
20
4.5. Bryher
Since the island is small, the 250 m SPZ 2 default radii extended beyond any catchment divides.
The groundwater velocity equation was applied as described in the section on Tresco above. It
gave distances beyond topographic divides, so the SPZ 1s were drawn to the topographic divides.
ov
4.6. St Agnes
A single SPZ 2 was drawn for the 4 Duchy of Cornwall sources on this small island. SPZ 1s were
drawn by extending the default 50 m radius circles the short distances to groundwater divides.
5. Confidence in Source Protection
N
Zone boundaries, and potential for
24
further work
n
Topographic catchment boundaries were the main means of delineating the SPZ total catchment
zones. However, it is possible for groundwater catchments to differ from and extend beyond
topographic catchments. There is potential for this to happen in the granite due to fractures
aw
forming preferential groundwater pathways. The British Geological Survey (BGS) geological
memoir (Barrow, 1906), mentions, ‘a series of cracks or fissure lines trending slightly west of
north’. Barrow states that, ‘they have an important bearing on the configuration of the islands, and
on the production of the water-ways into the interior sea’. There was not sufficient information on
the fractures for this piece of information to have a bearing on the delineation of the SPZs,
dr
however.
The most recent geological mapping of the Isles of Scilly was carried out by the BGS in 1906. In
response to an enquiry on the potential for re-mapping, the BGS stated that they could provide
ith
more detail on joint (fracture) patterns, and could more accurately delineate the extent of the
superficial deposits and weathered granite. Re-mapping would contribute to an improved
understanding of groundwater flow patterns. This would aid in any future update of the SPZs, and
also in the Environment Agency’s permitting and incident response roles.
W
This report describes the delineation of Source Protection Zones for the Isles of Scilly’s larger
groundwater sources, which can be seen as equivalent to public water supplies on the mainland.
This work could be extended in future to include drawing SPZs for smaller, private potable
abstractions. Due to the large concentrations of private abstractions on the islands, the mapped
SPZs would cover a large land area. Although the Environment Agency has not drawn SPZs for
the Isles of Scilly’s private supplies through the exercise described in this report, the 50 m radius
default SPZ 1 and 250 m radius default SPZ 2 do automatically exist for all private supplies there.
13 of 326. Figures
20
20
ov
N
24
n
aw
dr
ith
W
14 of 32W
ith
dr
aw
n
24
N
ov
20
20W
ith
dr
aw
n
24
N
ov
20
16 of 32
20W
ith
dr
aw
n
24
N
ov
20
17 of 32
20W
ith
dr
aw
n
24
N
ov
20
18 of 32
20W
ith
dr
aw
n
24
N
ov
20
19 of 32
20W
ith
dr
aw
n
24
N
ov
20
20 of 32
20W
ith
dr
aw
n
24
N
ov
20
21 of 32
20W
ith
dr
aw
n
24
N
ov
20
22 of 32
207. References
Aquatic Water Services Limited, 2015. ‘Tresco – The Isles of Scilly groundwater
hydraulic analysis and sustainability – long term monitoring programme, 2004 –
20
2005’.
Banks, D. Skarphagen, H. Reimann, C. and Watkins, D. 1997. The Comparative
Hydrochemistry of Two Granitic Island Aquifers: The Isles of Scilly, U.K., and the
20
Hvaler Islands, Norway. Geological Survey of Norway.
Barrow, 1906. ‘Memoirs of the Geological Survey England and Wales –
explanation of sheets 357 and 360 – the geology of the Isles of Scilly’.
ov
Environment Agency, 2016. ‘Sewage-related contaminants in Isles of Scilly
groundwater: concentrations, spatial distribution, sources and risk’.
N
ESI., 2012. Isles of Scilly initial groundwater conceptualisation project.
Institute of Geological Sciences Isles of Scilly geological map sheet 357/360 1:50
000 series.
24
South West Water, 1982, ‘1982 Water Resources Report, St Mary’s, Isles of Scilly’.
Watkins, D, 1999., Water resources of St Martin’s, Isles of Scilly. CSMA Minerals
n
Limited
aw
Watkins, D, 1999., Water resources of St Agnes, Isles of Scilly. CSMA Minerals
Limited
dr
ith
W8. Appendices
20
20
ov
N
24
n
aw
dr
ith
W
24 of 32Appendix 1 – WhAEM model
The US Environmental Protection Agency’s ‘Wellhead Analytical Element Model’ (WhAEM) ‘simple
WHPA’ (Well Head Protection Area) option was used to assist in producing SPZ 1s for the sources
on St Mary’s. This option implements Jacob and Bear’s (1965) solution for finding the down-
gradient stagnation point and the width of the area from which groundwater is drawn towards a
well. It is able to solve the equation in such a way as to give travel time zones, and hence also
gives up-gradient capture zone extents.
20
20
ov
N
24
n
aw
dr
ith
W
25 of 32Appendix 2 - values input into WhAEM:
The values input for the Higher Moors group are listed below:
Aquifer parameter value Source of information
Hydraulic gradient (i) 0.019 estimated from topographic contours shown
on 1:25k scale OS map
Porosity 0.006 ESI, 2012
Ambient flow 0.95 m/d k*h*I (k*h = transmissivity, which was given
20
as 50 m2/d in ESI, 2012). i was estimated
from topographic contours to be 0.019.
Aquifer thickness (h) 50 m estimated
20
The same values were used for the Lower Moors abstractions, except that ambient flow was
calculated using a transmissivity of 112 m2/d (ESI, 2012), an i of 0.03 was used for Joaneys and
0.05 for Rocky Hill.
ov
N
24
n
aw
dr
ith
W
26 of 32Appendix 3
A groundwater velocity equation was used to assist in producing the SPZ 1s.
The equation: SPZ 1 length = 50ki/ne was used, where:
K = hydraulic conductivity
i = hydraulic gradient
ne = porosity
20
The values used in, and calculated by the equation for the Higher Moors group are shown in the
table below:
aquifer parameter value notes
K (m/d) a transmissivity of 50
20
m3/d (ESI, 2012), divided
by an estimated aquifer
1.00 thickness of 50m
i (dimensionless) estimated from
topographic contours
ov
shown on 1:25k scale
0.019 OS map
ne (dimensionless) 0.006 ESI, 2012
time (d)
Velocity (m/d)
Distance (m)
50.00
3.17
158
N
Calculated by equation
Calculated by equation
24
n
aw
dr
ith
W
27 of 32Appendix 4 – geological and construction logs
Joaneys Well
20
20
ov
N
24
n
aw
dr
ith
W
28 of 32W
ith
dr
aw
n
24
N
ov
20
29 of 32
20Rocky Hill
20
20
ov
N
24
n
aw
dr
ith
W
30 of 32W
ith
dr
aw
n
24
N
ov
20
31 of 32
2020
20
ov
N
24
www.gov.uk/environment-agency
n
aw
dr
ith
W
32 of 32You can also read