Mapping Somali cities - Training manual - UN-Habitat
←
→
Page content transcription
If your browser does not render page correctly, please read the page content below
Mapping
Somali cities
    Training manual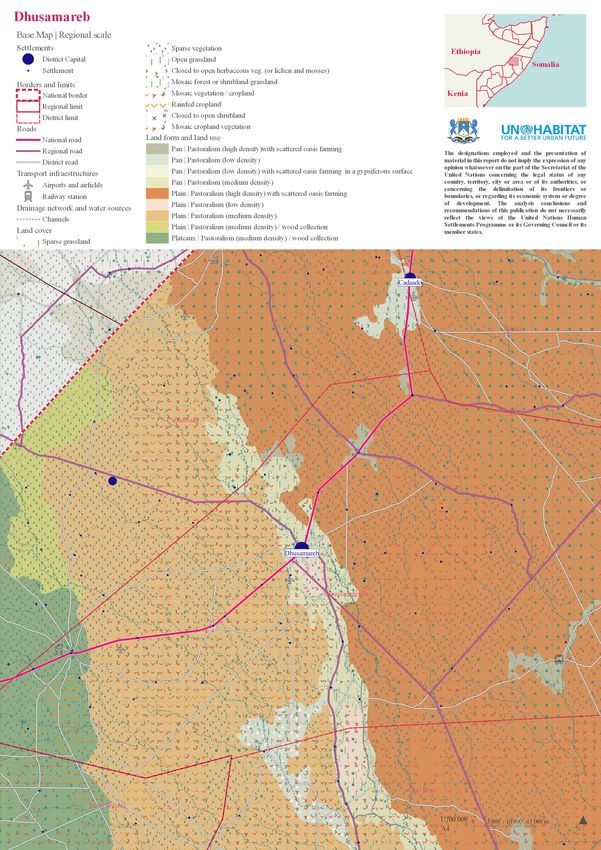
02

UNITED NATIONS HUMAN SETTLEMENTS PROGRAMME
P.O. Box 30030 Nairobi 00100, Kenya
www.unhabitat.org

Disclaimer
The designations employed and the presentation of material in this report do not imply the expression of any opinion whatsoever
on the part of the Secretariat of the United Nations concerning the legal status of any country, territory, city or of its authorities,
or concerning the delimitation of its frontiers or boundaries, or regarding its economic system or degree of development. The
analysis conclusions and recommendations of this publication do not necessarily reflect the views of the United Nations Human
Settlements Programme or its Governing Council or its member states.

Reference of this publication of any specific commercial products, brand names, processes, or services, or the use of any trade,
firm, or corporation name does not constitute endorsement, recommendation, or favouring by UN-Habitat or its officers, nor does
such a reference constitute an endorsement of UN-Habitat.

Programme coordinator: Francesco Tonnarelli
Manual desing and cartography: Lucía Corral and María Núñez
03

                                           Index

Introduction		                                04
What to map?                                  06
How to map?                                   08
- Data gathering                              10
How to organize information?                  12
-   00 Political Administrative Entities      14
-   01 Topography and hydrology               15
-   02 Land                                   16
-   03 Built                                  17
How to represent information?                 22
- Organising the map                          23
- Examples of representation                  24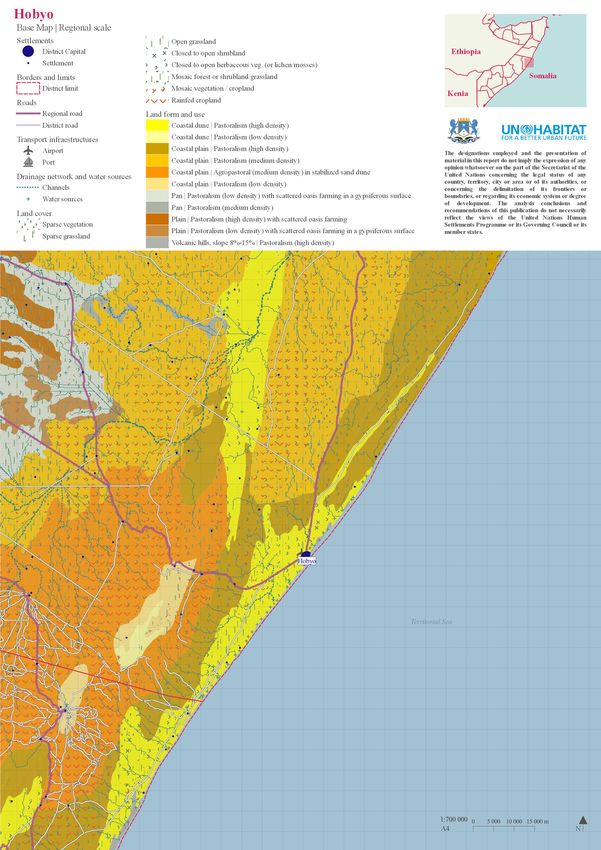
04

                                   Introduction

Why this manual?
Maps are not simple representations of the real world on a much smaller scale. They
are a tool to organize information. With maps, it become much easier to investigate a
place’s infrastructure, economy and settlement information, which are all very important
facets of population and development situation.
Maps can also easily and concretely show change through time, and allow to understand
one place’s trend and plan for the future. They help you figure out where you are and
how to get where you want to go.
While many data are available across different sectors and key actors, there is no official
cartography which represents Somalia as it is now. In this sense, Somalia is, by many
ways, an unexplored territory. The limitations in access of many parts of its extension
made very difficult to provide updated, reliable and verified information from a spatial
prospective.
With concrete improvements in the governance of the country, from the Federal level to
the Federal Member States established in the last years, to the administrations at district
and municipal level, the chance is to coordinate different level of spatial data and
produce an updated cartography. This would contribute in an effective way to develop
a shared understanding of the complexity of Somalia territory and support the country’s
development.

What is the manual about?
The manual is meant to feed into a training course for base mapping in Somalia. It
serves as an introduction for local government and other interested stakeholders,
guiding through the different scales and themes relevant to the context, the different
sources available, and different visualization requirements.

Who is the target for this course?
This course is designed as an introductory training module, which would enable
participants to equip themselves with foundation principles, further disseminate the
knowledge or train others.
The end-users of the course are intended to be local government staff (ministries,
district), as well as other stakeholders (e.g. NGOs and international agencies),
particularly those engaged in development activities that deal with infrastructure,
agriculture, hydrology, land administration, urban planning, solid waste management, or
natural resource management.
The course assumes a basic knowledge of concept of Geographic Information systems
(GIS) and the use of QGIS 3 (a free and open-source cross-platform GIS software).
In selecting participants, ensuring geographical and gender distribution, a range of
expertise and experience as well as diversity of ethnic and religious backgrounds would
augment the mutual learning experience.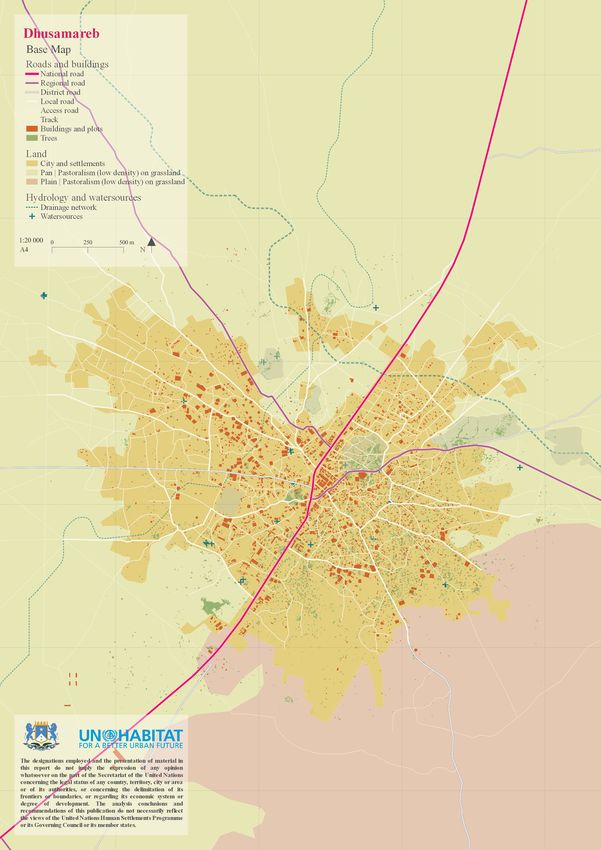
05

By the end of the course participants should be:
•      familiar with
•      aware of
•      able to

Limitations
The manual is structured to work with other material. That is:
•        a set of base layers
•       QGIS projects and styles
The layers made available are not meant to constitute to only source for the production
of the maps, but they are the most updated publicly-available spatial layers sufficient
for the elaboration of most of the thematic maps reputed necessary for a basic
representation of the territory at district level. The training attendees will be able to
collect further data and enrich their maps with ground-level information.

Building up local governments technical capacity
This manual is part of a UN-Habitat strategy for building up capacity of local and state
government in Somalia and laying the foundation for the establishment of functional
urban development departments able to cope with the tremendous urban development
challenges of the country. Mapping is only one of the technical skills at the base of
urban planning. Others training developed in coordination with the current one are:

•      Rapid urban profiling and land use mapping
•      Urban risk mapping and resilience planning
•      Roles and responsibilities in urban planning
06
What to map?
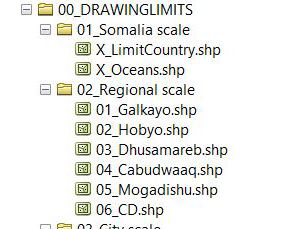
Very first step is defining what to represent and at what scale, the drawing limits.
Mapping cities through Geographic Information Systems (GIS) makes it possible to
identify and work with different city areas of influence.
For this task, it is suggested to work in one of these two scales:
- Regional scale (RS), which integrates the areas, cities and settlements that are less
than an hour’s drive from the studied city. It is considered that the average speed of a car
on a National Road is approximately 70 km/hour. Therefore, an area of 75 km radius is
established around the city.
- Urban Scale (US), which focuses on the urban area and its most immediate
surroundings.
75 000 m
City Buffer 75 000 Oriented
Regional scale
meters minimum
bounding box
Influence
area
Xm
Urban scale City
Buffer X meters Oriented
(depends minimum
on the size of bounding box
the city) Urban
area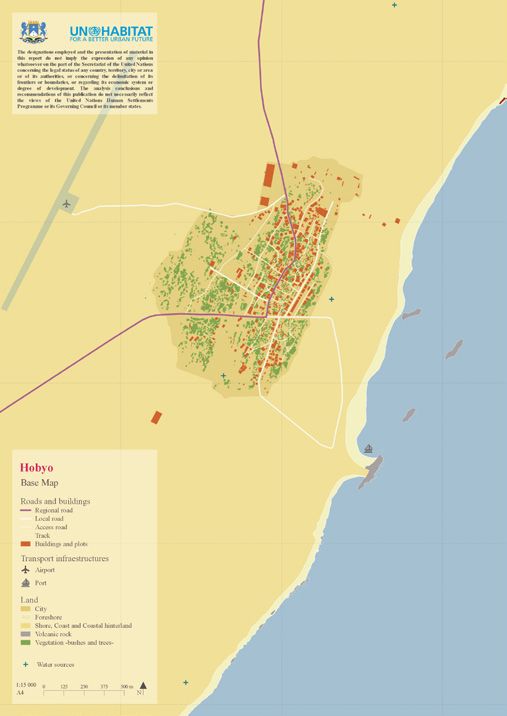
07

                  To do this, it is suggested to start from a layer of points that identifies the position of the
                  city, creating a layer that identifies the area of study and simplifies the following steps.
                  These cropping layers/bounding boxes define the boundaries of the site to be reviewed,
                  and they also limit the working area if the data is too heavy to allow for a fluid
                  workflow.
                  This work is not necessarily a linear process. Scale and limits could be modified based
                  on new finding in the future.

         75 000 m
                        Intersect

                                                                                      Example:
City clip layer                      Layers that need                                 Regional scale
Regional scale
                                    manual revision or                                Hobyo 1: 700.000
                                    that are too heavy

        Xm
                  Intersect

City clip layer
 Urban scale                  Example:                    Example:                    Example:
                              Urban scale                 Urban scale                 Urban scale
                              Galkayo 1: 50.000           Dhusamareb 1: 20.000        Hobyo 1: 15.000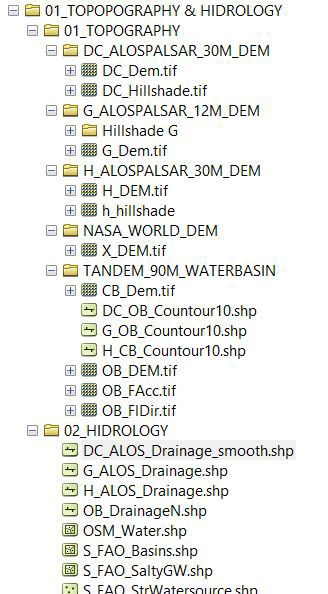
08

                                                 How to map?
                  It is necesary to pre-select and prepare the information before starting to work with it.
                  For this purpose, it is important to sort out the downloaded or received information from
                  work layers into different folders -the information will be used later on the maps. This
                  step provides a more organized arrangement of information and avoids having unused
                  layers in the workspace. The separation of data is also useful in case of data loss or
                  damage.
                  Once the information is downloaded, it is necessary to do a pre-selection by triage,
                  processing the information. Later we will do an evaluation to decide which layers are
                  needed. These layers will be extracted directly from the chosen source (and named
                  according to the nomenclature defined in page 09), and projected in the chosen CRS.

Downloaded/
  Received                                  Downloaded / Received information
information

                       triage and projection CRS

                  00 Drawing limits                                                (layers p 06-07)

                  00 Political Administrative Entities                                (layers p 14)
  Preselected
base layers are
   organized
                  01 Topography and Hydrology                                         (layers p 15)

in main folders
                  02 Land                                                             (layers p 16)

                  03 Built                                                         (layers p 17-21)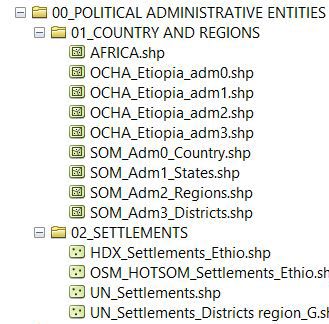
09

Triage
Information triage is the selection of relevant information for the mapping. This
requires opening each layer in QGIS and looking at both the visible information and
the information present in the attribute tables. It is also necessary to download or
choose some layers instead of others filtering by the latest update -which appears in the
download portal. The most recent ones, or those with higher quality information, will be
chosen to make the maps.
The scheme of page 07 shows the sources of the layers that were selected to make the
working layers.

Projection in Coordinate
Reference System (CRS)
To avoid problems while working, every layer must be projected in CRS WGS 84/
UTM 38N EPSG: 32638. If layers are not projected it can be impossible to operate with
them. For that it is important to choose in the Properties of QGIS project as Predefined
Coordinate Reference System, WGS 84/ UTM 38N EPSG: 32638.

If a layer is correcty located but the CRS is not the chosen one it is necessary to (by
right clicking on the layer), “Save as” (QGIS 2.18) or “Export” (QGIS 3.12) modifying
the CRS of the layer.
If a layer is not corrrectly located it is necessary to, first, change its CRS (right clicking
on the layer on “Properties”) and change CRS; then, it is necessary to (by right clicking
on the layer), “Save as” (QGIS 2.18) or “Export” (QGIS 3.12), modifying the CRS.
Where toData
                                                  obtain
                                                                                                       10

                                                     gathering
                                         information...?
                                                                                  UN OCHA
                                                                          https://data.humdata.org/

                                                                            FAO SWALIM
                                            https://spatial.faoswalim.org/layers/?limit=20&offset=0
International                                                   FAO GEONETWORK
organizations                                   http://www.fao.org/geonetwork/srv/en/main.home
                                                                           *for Landcover maps

                                                  GLOBAL SHELTER CLUSTER
                                        https://cccm-cluster-somalia.github.io/OPSMAP/#moreinfo

                                                                                   HOTOSM
                                                                          https://www.hotosm.org/
Open maps
                                                                                           OSM
                                                          http://download.geofabrik.de/africa.html

                  ALOS PALSAR | ASF Data Search Vertex | DEM 30M
Open datasets                                                         https://search.asf.alaska.edu/
                                                                                 *needs registration
from satellite
                                                             TANDEM-X | DEM 90M
images                                                https://download.geoservice.dlr.de/TDM90/
                               recommended for basin scale hydrologic analysis *needs registration

                                                                                  Bing aerial
                                                                         *With OpenLayers plugin

                                                                           Google satellite
Tracing /                                                                *With OpenLayers plugin
Teledetection    and registration in Google Cloud Platform with Gmail account to set up an API key
                                                                      from “Maps JavaScript API”
from aerial                                                                    Google Earth
view                                                         https://www.google.com/intl/es/earth/

                                                                              Other sources
                                                                                    Paper maps etc

Goverment
...to create base layers?
11
This manual is for base mapping. The layers made available are not meant to constitute
to only source for the production of the maps, but they are the most updated publicly-
available spatial layers (UN system, international organization and open sources)
sufficient for the elaboration of most of the thematic maps reputed necessary for a basic
*Regional scale - RS | Urban scale -US
representation of the territory at district level. The training attendees will be able to
when indicated layers can only be used in one specific scale
collect further data and enrich their maps with ground-level information.
District | polygon
Region | polygon 00
State | polygon Administrative
Country | polygon limits and
Settlements| point boundaries
Digital elevation model -30M | raster 1B | 30x30m
Hillshade | raster 1B | 30x30m
Contour lines | line
Drainage network | line 01
Topography
Water ponds | polygon
and hydrology
Salty ground water sources | polygon
Land form and use - RS* | polygon
Land cover -RS* | polygon
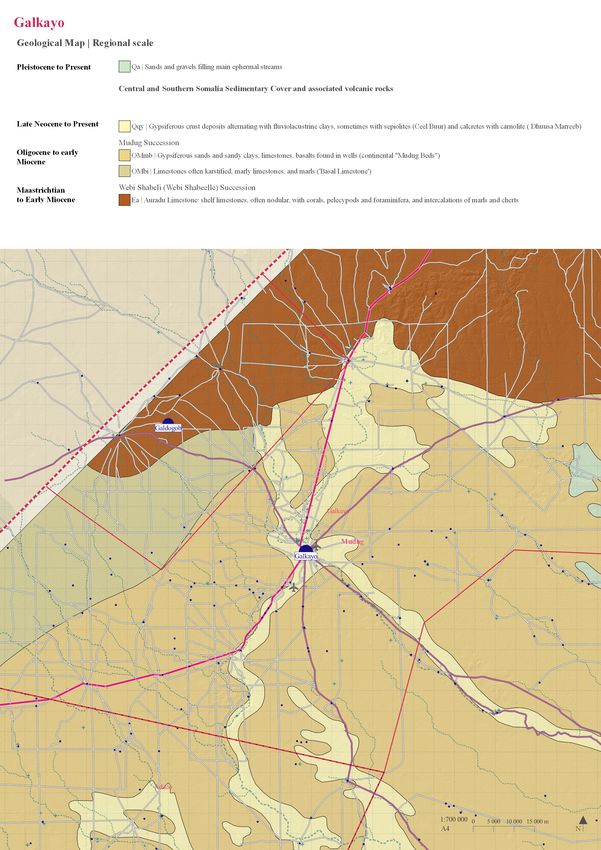
Geology -RS* | polygon 02
Land form and use - US* | point Land
Trees -US* | polygon
Built | polygon
Areas | polygon
Facilities and infrastructures | point
Roads | line
Transport | point
03
Built
Water sources | point
IDP Camps | point
Historical - US* | polygon
In addition to the sources of data suggested, the layers could be completed with the
information that country institutions could have.How
How to
to organize
12
organize
information?
information?
00 Drawing limits (layers p 06-07)
00 Political Administrative Entities (layers p 14)
Main folders 01 Topography and Hydrology (layers p 15)
02 Land (layers p 16)
03 Built (layers p 17-21)
Example
of folders
organization13
* Government should
create a database to be
upgrated and maintained
of ground-level and
validated data.
Inside every main folder the information can be organized by theme, according to the
sources, or according to scale. This will vary depending on how the information was
produced, on the availability and size of the information, or on the map needs.
Naming
However, it is always recommended to maintain the hierarchy in naming the files and
folders as described below. This allows to retrace and identify the contents of the layer
without opening it.
Scale_Source_Topic (.extension)
Scale Source Topic
National Scale Only one source
> Ø or S or SOM (without intervention in attribute layer) Different topics are presented in previous
Example: > Initials of the source page.
FAO_Landcover.shp Example: Example:
SOM_Adm0.shp FAO_Landusystem.shp Landusystem.shp
DEM.tif
Regional or Urban Scale Multiple sources G_building.shp
> Initials of the area (sources are mentioned in attribute table)
Example: >Ø
Ogaden Basin= OB Example:
OB_ALOS_Drainage.shp H_Buildings.shp
Galcayo=G
G_Roads.shp14
00 Political/Administrative Entities
This information is generally well organized, but national and regional boundaries can
vary greatly depending on the source and the time of mapping.
In this document the border of Somalia is considered to be demilited by the
administrative boundaries as made available by UN OCHA.
UN OCHA
https://data.humdata.org/
AdmN layers | Administrative divisions
https://data.humdata.org/dataset/administrative-regions-of-somalia
District | polygon | Adm 3
Region | polygon | Adm 2
State | polygon | Adm 1
Country | polygon | Adm 0
UN OCHA
https://data.humdata.org/
Settlements
Settlements| point
https://data.humdata.org/dataset/somalia-settlements-p-coded-shapefile15
01 Topography and hydrology
Hydrology and topography information is extracted from different DEM models.
A first hydrological approach is made with TANDEM-X (cell size: 90 x 90 meters)
information for the hole Ogaden Basen (and, partially, for the Central Coastal Basin).
This information allows to extract countour lines for regional scale. A second and
more precise hydrologic analysis to extract local drainage network is made with ALOS
PALSAR DEM (cell size: 30 x 30 meters) from 2007 to 2011. The DEM also allows
to extract Hillshade. Even if Ogaden Basin information is not represented on the maps,
it allows for the study of hydrologicaly connected sites; this information is therefore
available in the folders.
More information about accuracy of ALOS PALSAR for extracting Drainage network in
arid and semi-arid environments:
> https://www.sciencedirect.com/science/article/pii/S221458181830212X
ALOS PALSAR | ASF Data Search Vertex | DEM 30M
https://search.asf.alaska.edu/
*needs registration
Merge raster layers
> https://docs.qgis.org/2.8/en/docs/training_manual/processing/cutting_merging.html)
Digital elevation model -30M | raster 1B | 30x30m
Hillshade from DEM
> https://docs.qgis.org/2.8/en/docs/user_manual/processing_algs/gdalogr/gdal_analysis/hillshade.html
Hillshade | raster 1B | 30x30m
Hydrological analysis
>https://docs.qgis.org/2.2/en/docs/training_manual/processing/hydro.html
Drainage network | line
TANDEM-X | DEM 90M
https://download.geoservice.dlr.de/TDM90/
recommended for basin scale hydrologic analysis *needs registration
Contour from DEM
> Raster menu >> Extraction >> Contour
Contour lines | line
OSM Bing aerial Google satellite
http://download.geofabrik.de/africa.html *With OpenLayers plugin *With OpenLayers plugin
Water ponds and water surfaces| polygon
This layer is not automatically generated, because temporary or stable water surfaces are not numerous nor well docu-
mented. Some have been traced from satellite images and some have been compiled from different sources.
FAO SWALIM
https://spatial.faoswalim.org/layers/?limit=20&offset=0
Salty ground water sources | polygon
https://spatial.faoswalim.org/layers/geonode:Salty_Ground_Water_Sources
License: Open Data Commons Open Database License
Publication: December, 6th; 2019 at 10:3916
02 Land
Landscape information at regional level is obtained from FAO SWALIM and FAO
Geonetwork. This information has a fairly high resolution, so at the closest scales
it is necessary to adapt it to the actual scale of representation; either by integrating
information sources that have a higher resolution, or tracing from aerial images or -if
possible- by taking field data.
FAO SWALIM FAO GEONETWORK
https://spatial.faoswalim.org/layers/?limit=20&offset=0 http://www.fao.org/geonetwork/srv/en/main.home
Land cover -RS* | polygon
Land cover of Somalia | Globcover Regional (2005)
http://www.fao.org/geonetwork/srv/en/metadata.show?currTab=simple&id=37207
Land cover of Ethiopia | Globcover Regional (2005)
http://www.fao.org/geonetwork/srv/en/main.home?uuid=acdb1530-1840-4a91-a25e-09ee6e4d06e8
Publication: May, 11th; 2009 at 15:49 Resolution: 300 m
Geology -RS* | polygon
Geology Abbate et al. (1993)
https://spatial.faoswalim.org/layers/geonode:Geology_Abbate_et_al_1993#/
License: ?
Publication: December, 11th; 2019 at 17:02
Landuse system | polygon
Somalia Landuse system (2007)
https://spatial.faoswalim.org/layers/geonode:SOM_Landuse_System_FAOSWALIM2007#/
License: Open Data Commons Open Database License
Publication: December, 3th; 2019 at 16:15
Landform | polygon
Somalia Landforms (2008)
https://spatial.faoswalim.org/layers/geonode:SOM_Landforms_FAOSWALIM20080#/
License: Open Data Commons Open Database License
Publication: December, 3th; 2019 at 16:49
Union of both layers and Eliminate sliver polygon tools -for small polygons A https://docs.qgis.org/2.18/en/docs/user_manual/processing_algs/saga/imagery_classification.
html#supervised-classification
Trees -US* | polygon17
03 Built environment
This folder contains information from different sources; aditionally, documentation
is often not as thorough and well-organized. Therefore, it is proposed to not only
perform a series of transformation operations, but also to create databases that allow the
available information to be updated and represented in a homogeneous way.
To this end, a series of fields have been created which are common to all the tables, and
which allow a first approximation to an urban database.
Attribute table common fields
GROUP TYPE NAME
Official name / Other
Generic object
Specific type of object known names -if
selection
relevant-
SOURCE_1 SOURCE_2 DISTRICT
Source quoted by
Source that the the first source from Name of the district
element was extracted which the element where the element
from was originally taken resides
from
REGION STATE CURRENT_ST
R= Revised / It is
most likely to be at
Name of the region Name of the state
this stage
where the element where the element
NR= Needs revision /
resides resides
It is unlikely to be at
this stage18
Roads
Road information requires manual prioritization of transport routes. Although a large
proportion of roads are found in OSM, there are often many problems with the road
hierarchy. This requires consulting other sources - Aerial Bing, Google satellite and
Google Earth - and comparing different readings of the road network.
OSM
http://download.geofabrik.de/
OSM Roads | line
http://download.geofabrik.de/africa/somalia.html
License: Attribution-ShareAlike 2.0 Generic (CC BY-SA 2.0)
Bing aerial Google satellite Google Earth and
*With OpenLayers plugin *With OpenLayers plugin
Google Maps
https://www.google.com/
intl/es/earth/
Verify road hierarchy and trace roads if necessary.
Adapt road hierarchy to proposed road hierarchy.
Roads | line
Layer that contains roads
GROUP TYPE
Trunk road > National road
> Regional road
> District road
Urban road > Local road
> Access road
> Track road
> New development (ND) road19
Buildings
Information on buildings and urban spaces is scarce and can be found in many different
sources. That is why we propose a 4-layer organization. The work to be done consists
of comparing the different databases and integrating the information available in these
databases. In some cases the sources repeat information so it is necessary to check the
information to avoid duplication.
HOTOSM OSM Google satellite FAO SWALIM
https://www.hotosm.org/ http://download.geofabrik. *With OpenLayers plugin https://spatial.faoswalim.
de/ org/layers/?limit=20&off-
set=0
Police stations | point
Police stations in Somalia | UNSOS 2018
https://spatial.faoswalim.org/layers/geonode:SOM_Police_Stations_UNSOS2018#/
License: Open Data Commons Open Database
Publication: December, 3th; 2019 at 13:30
Airfield UNSOS | point
Airfields in Somalia | UNSOS 2007
https://spatial.faoswalim.org/layers/geonode:Airfields_UNSOS#/
License: Open Data Commons Open Database
Publication: December, 5th; 2019 at 20:33
OSM Buildings| point
http://download.geofabrik.de/africa/somalia.html
License: Attribution-ShareAlike 2.0 Generic (CC BY-SA 2.0)
OSM Facilities| polygon and points
http://download.geofabrik.de/africa/somalia.html
License: Attribution-ShareAlike 2.0 Generic (CC BY-SA 2.0)
OSM Religious| polygon
http://download.geofabrik.de/africa/somalia.html
License: Attribution-ShareAlike 2.0 Generic (CC BY-SA 2.0)
HOTOSM_Interest points| polygons and points
https://data.humdata.org/organization/hot
License: Open Data Commons Open Database
UNSOS Facilties | polygon
Organisation in new layers and Built | polygon
information adding through Layer that contains buildings or plots of the city in polygons
personal knowledge and
information available in Google Areas | polygon
Earth and Google maps Open areas in the city with specific use such as parks, airfields...
Google satellite Transport | points
*With OpenLayers plugin Layer that contains points of airports, harbors, and bus stations
Google Earth Facilities and infrastructures | points
https://www.google.com/ Layer that contains points locating facilities and infrastructures
intl/es/earth/
GROUP TYPE
Building
Educational > School / Community centre /Other
Health > Hospital / Pharmacy / Health care center / NGO health care cente / Other
Police Station > Police station / Central police station / Coast guard
Religious > Muslim / Mosque / Madrassa/ Place of Worship
Social > Community centre / Feeding centre / Food distribution center / Other
Sports > Playground / Stadium / Pitch
Government > Local government centre
Tertiary > Hotel / Cafe / Market / Store / Money transfer office / Travel Agency / Bank
Infrastructures > Tower / Communication tower / Mast
NGO > Office
Other > Cemetery
Not classified > Not classified20
Others
OSM FAO SWALIM
http://download.geofabrik.de/ https://spatial.faoswalim.org/layers/?lim-
it=20&offset=0
StrategicWater sources | point
Strategic Water sources in Somalia | FAOSWALIM February 2018
https://spatial.faoswalim.org/layers/geonode:SOM_Strategic_Water_Sources_Feb2018#/
License: Open Data Commons Open Database
Publication: September, 26th; 2019 at 13:30
OSM Facilities | line
http://download.geofabrik.de/africa/somalia.html
License: Attribution-ShareAlike 2.0 Generic (CC BY-SA 2.0)
Fusing two layers after verifying that some points do not refer to the same point. If this is the case, only
include the point from Strategic water sources. Include as well all the fields present in the Strategic Water
Sources map. Points classified by OSM as “Water Well” are classified as “Not classified”.
Water sources | point
Layer that contain water sources and data about its maintenance and quality
GROUP TYPE
Water source > Berkad
> Borehole
> Dam
> Dug well
> Water tower
> Other
> Not classified21
GLOBAL SHELTER CLUSTER
https://cccm-cluster-somalia.github.io/OPSMAP/#moreinfo
Adaptation of fields present in dowloadable .xls file to used fields
Group: Refugee IDP Camp
IDP Camps | point
Google Earth Other sources
https://www.google.com/intl/es/earth/ Paper maps etc
Drawing an approximation of the city limits evolution though aerial images and old
maps
https://support.google.com/earth/answer/148094?hl=en
Historical - US* | polygon22
How to represent
information?
Plan representation always starts from the Base maps, both on regional scale (US) and Le
urban scale (RS). In the rest of the maps, certain layers are included or highlighted to Ma
The
Specific
give rise to specific content maps. of t
information wat
from
Specific information: layers with specific information wishing to be presented in each - By
+
map (facilities, watersources, IDP Camps, etc). Sty
cop
Cover layer Cover layer: we can apply the City clip layer used to define the drawing limits (pg 09) reci
with a transparency. Overlapping this cover layer will facilitate reading the specific - By
+ tem
information above the base map. Sym
Base map: it is recommended to remove the layers of the base map that do not
Base map
contribute to the reading of each case.
1.0.Base map*US 1.1.Facilities 1.2.Hidrology 1.3.IDP Camps 1.4. Urban Pa
includes includes includes includes growth Sc
-from top to down- -from top to down- -from top to down- -from top to down- includes No
AdmN Facilities and Water sources -from top to down-
Area infrastructures -represented three times ,
Buildings -with different codes for showing both water source type IDP Camps Historical
Trees differents groups and selected and water quality indicators- -size of the location depending
types- on the population of the camp-
Transport Water drainage
Roads (all) Regional scale
Water sources (Transparency) M
Water drainage
Landform and use * US Base map*US Base map*US Base map*US Base map*US
except Water sources and
drainage
2.0. Base map*RS 2.1.Hidrology 2.2.Topographic 2.3.Geology
includes includes includes includes
-from top to down- -from top to down- -from top to down- -from top to down-
AdmN
Settlements Water sources Base map*RS Base map*RS
represented three times , instead of Land layers instead of Land layers
Transport showing both water source type
Roads Only truck roads and water quality indicators-
DEM Geology
represented with a color represented with the same
Hillshade Water drainage gradient colours and codes
Water sources -the same for all the maps- than Geology A
Water drainage Regional scale map in SWALIM Atlas of Water
(Transparency) and Land in
Landcover Lo
Landform and use * RS dis
Base map*RS
except Water sources and
drainage23
Organising the map
Information on buildings and urban spaces is scarce and can be found in many different
sources. That is why we propose a 4-layer organization. The work to be done consists
of comparing the different databases and integrating the information available in these
databases. In some cases the sources repeat information so it is necessary to check the
information to avoid duplication.
Legend
Map content
The symbology stablished for each
of the layers (roads, buildings,
water sources, etc), can be copy
from one project map to another:
- By right clicking Style/Copy
Style on the layer that we want to
copy and Style/Paste Style on the
recipient layer.
- By saving the style as a new
template in Layer Properties/
Symbology/Style/Save Style.
Page Format
Scale
North
Map
S
Additional
information
Logos, crédits, sources,
disclaimer, authors, etc).24
Examples of representation
URBAN SCALE
1.0 Base map
1.1 Facilities
1.2 Hydrology
1.3 IDPCamps
1.4 UrbanGrowth
REGIONAL SCALE
2.0 Base map
2.1 Hydrology
2.2 Topographic
2.3 Geology25
Urban scale
1.0 Base Map
Layers used
-from top to down-
AdmN
Transport
Water sources
Roads (all)
Buildings
Area
Trees
Water drainage
Landform and use * US26
Urban scale
1.1 Facilities
Layers used
-from top to down-
Facilities and
infrastructures
-with different codes for
differents groups and selected
types-
Regional scale
(Transparency)
Base map*US27
Urban scale
1.2 Hydrology
Layers used
-from top to down-
Water sources
-represented three times ,
showing both water source
type and water quality
indicators-
Water drainage
Base map*US
except Water sources and
drainage28
Urban scale
1.3 IDP Camps
Layers used
-from top to down-
IDP Camps
-size of the location
depending on the
population of the camp-
Base map*US29
Urban scale
1.4 Urban growth
Layers used
-from top to down-
Historical
Base map*US30
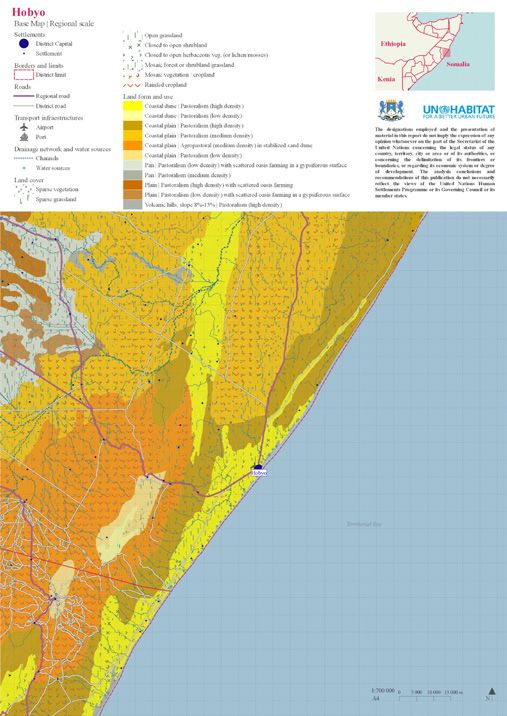
Regional scale
2.0 Base map
Layers used
-from top to down-
AdmN
Settlements
Transport
Roads Only truck roads
Hillshade
Water sources
Water drainage
Landcover
Landform and use * RS31
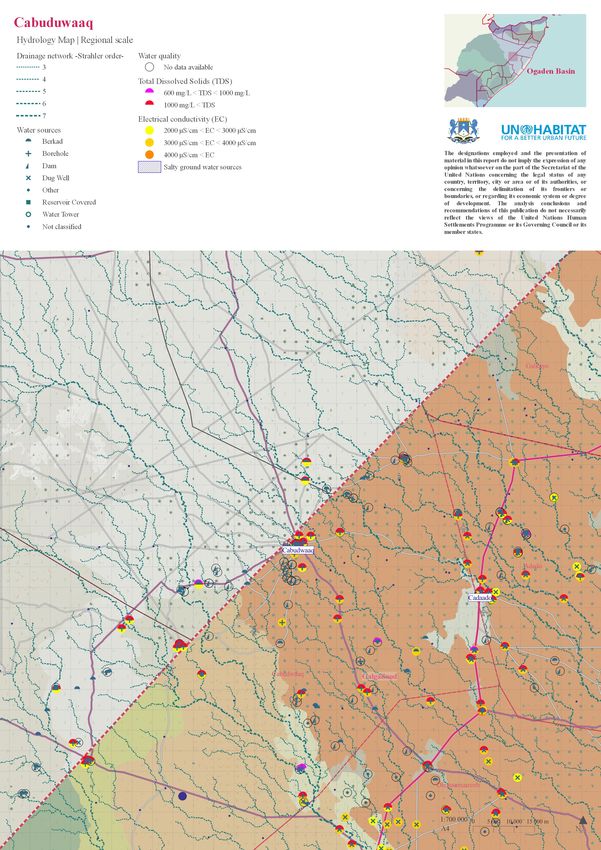
Regional scale
2.1 Hydrology
Layers used
-from top to down-
Water sources
represented three times ,
showing both water source type
and water quality indicators-
Water drainage
Regional scale
(Transparency)
Base map*RS
except Water sources and
drainage32
Regional scale
2.2 Topographic
Layers used
-from top to down-
Base map*RS
instead of Land layers
DEM
represented with a color
gradient
-the same for all the maps33
Regional scale
2.3 Geology
Layers used
-from top to down-
Base map*RS
instead of Land layers
Geology
represented with the same
colours and codes
than Geology
map in SWALIM Atlas of Water
and LandYou can also read